
In the dynamic world of finance, from personal budgeting to large-scale investment strategies, percentages are the universal language. They provide a standardized way to compare quantities, track growth, understand discounts, and evaluate performance, transforming raw numbers into meaningful insights. Whether you’re trying to figure out how much you’ve saved on a sale item, calculate the interest on a loan, or understand the return on your investments, mastering the art of calculating percentages is an indispensable skill.
This guide delves into the straightforward methods of obtaining a percentage of a number, illustrating its critical applications across various financial scenarios. We will move beyond mere arithmetic to reveal how this fundamental mathematical concept empowers better financial decision-making, fostering greater control and clarity over your economic landscape. From the simplest discounts to complex portfolio analyses, understanding percentages is not just about numbers; it’s about unlocking financial literacy and achieving your monetary goals with precision and confidence.

The Foundational Formula: Deconstructing the Percentage Calculation
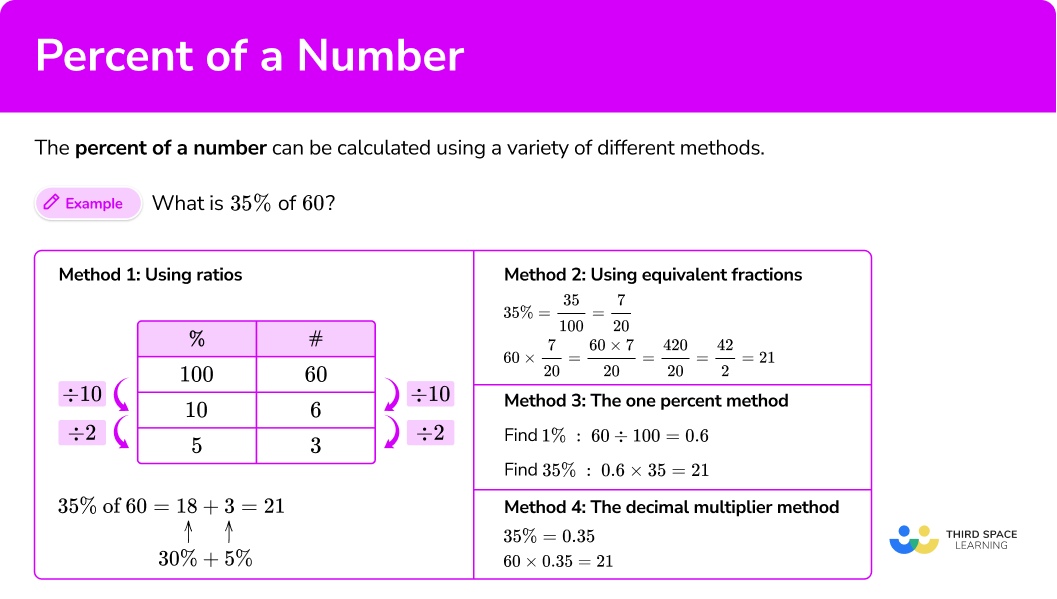
At its core, calculating a percentage is about understanding a part in relation to a whole, expressed as a fraction of 100. This universal concept forms the bedrock of countless financial calculations, making it imperative for anyone navigating the world of money.
What is a Percentage?
The term “percent” originates from the Latin “per centum,” meaning “by the hundred.” Essentially, a percentage is a way of expressing a number as a fraction of 100. For instance, 25% means 25 out of 100, or 25/100. It’s a dimensionless quantity, providing a proportional relationship that is incredibly useful for comparing different values or showing changes over time, regardless of the absolute scale of the numbers involved. In finance, this allows us to compare returns on investments of different sizes, understand the proportion of income allocated to expenses, or track changes in market value without getting bogged down by raw, often disparate, figures.
The Core Calculation: Part / Whole x 100
The primary formula for calculating a percentage is remarkably simple yet profoundly powerful:
Percentage = (Part / Whole) x 100
Let’s break down the components:
- Part: This is the specific amount or quantity you are interested in, representing a portion of the total.
- Whole: This is the total amount, the grand sum, or the base figure against which the “part” is being compared.
- x 100: Multiplying by 100 converts the decimal fraction (Part/Whole) into a percentage, making it easier to read and interpret.
Understanding this formula is the gateway to unlocking financial comprehension. It’s not just a mathematical operation; it’s a conceptual tool that helps you contextualize financial information. For example, if you want to know what percentage of your income goes to rent, your rent payment is the ‘part’ and your total income is the ‘whole’. The result gives you a clear, comparable metric.
Practical Example: Calculating a Simple Discount
Let’s put the formula into action with a common financial scenario: calculating a discount.
Imagine you’re buying a new gadget that originally costs $500. It’s currently on sale, offering a $100 discount. You want to know what percentage discount you’re receiving.
- Identify the Part: The discount amount is $100.
- Identify the Whole: The original price of the gadget is $500.
- Apply the Formula:
Percentage Discount = ($100 / $500) x 100
Percentage Discount = 0.20 x 100
Percentage Discount = 20%
This calculation immediately tells you that you are getting a 20% discount. This simple example highlights how percentages translate raw numbers into easily digestible insights, helping you evaluate the value of a deal or compare different offers effectively. This foundational understanding extends to calculating markups, tax rates, and many other everyday financial transactions.
Percentages in Personal Finance and Budgeting
For individuals, percentages are not just theoretical concepts; they are the bedrock of effective personal finance management. From tracking where your money goes to setting ambitious savings goals, a solid grasp of percentages provides clarity and control.
Tracking Expenses as a Percentage of Income
One of the most powerful applications of percentages in personal finance is understanding your spending habits relative to your income. This insight is crucial for budgeting and identifying areas where you might need to cut back or reallocate funds.
To calculate this:
- Identify the Part: The total amount spent on a specific category (e.g., groceries, entertainment, housing) over a period.
- Identify the Whole: Your total net income for the same period.
- Apply the Formula:
(Category Expenses / Total Net Income) x 100
For example, if your net monthly income is $4,000, and you spend $1,200 on rent:
Rent Percentage = ($1,200 / $4,000) x 100 = 0.30 x 100 = 30%
Many financial experts recommend allocating specific percentages of income to different categories, such as the 50/30/20 rule (50% for needs, 30% for wants, 20% for savings/debt repayment). By consistently calculating your spending percentages, you can quickly see if you are adhering to your budget guidelines and make informed adjustments. This provides a clear, quantitative measure of your financial health, far more impactful than just looking at absolute dollar amounts in isolation.
Setting Savings Goals: The Power of Percentages
Saving money is often seen as a challenge, but setting goals using percentages can make the process more manageable and motivational. Instead of aiming to save a vague “some money,” setting a percentage-based goal gives you a clear target proportional to your income.
If your goal is to save 15% of your net income each month:
- Identify the Whole: Your total net income (e.g., $4,000).
- Identify the Percentage: 15%.
- Calculate the Part: To find the actual dollar amount to save, you’ll work the formula backward or directly multiply:
(Percentage / 100) x Whole
Savings Amount = (15 / 100) x $4,000 = 0.15 x $4,000 = $600
This tells you that you need to save $600 each month to hit your 15% goal. This method scales automatically with your income – if your income increases, the dollar amount you save will also increase proportionally, without needing to recalculate your target percentage. It instills a disciplined approach to building your financial reserves, whether for an emergency fund, a down payment, or retirement.
Understanding Loan Interest Rates and APR
Loans, whether for a car, a house, or personal needs, are intrinsically tied to percentages, specifically through interest rates and Annual Percentage Rate (APR). These percentages dictate the cost of borrowing money.
-
Interest Rate: This is the percentage charged by a lender for the use of assets, typically expressed annually. If you have a $10,000 loan with a 5% annual interest rate, you would owe 5% of $10,000, which is $500, in interest over that year (simplified, not including compounding).
Interest = (Interest Rate / 100) x Principal
Interest = (5 / 100) x $10,000 = 0.05 x $10,000 = $500 -
APR (Annual Percentage Rate): This is a broader measure of the cost of borrowing money, including not just the interest rate but also other fees and charges, expressed as an annual percentage. It provides a more comprehensive picture of the true cost of a loan, allowing for clearer comparisons between different loan products. While the calculation of APR can be complex and often involves specific financial formulas and regulatory standards, understanding that it represents the total cost as a percentage is vital. A higher APR means a more expensive loan.
Knowing how to interpret these percentages empowers you to choose the most cost-effective borrowing options and understand the real financial commitment you are making.
Leveraging Percentages for Investment Insights
For investors, percentages are the language of performance, risk, and allocation. They provide critical metrics for evaluating potential investments, tracking portfolio health, and making strategic decisions.
Calculating Investment Returns (ROI)
Return on Investment (ROI) is arguably one of the most important metrics for an investor. It measures the profitability of an investment as a percentage of its initial cost.
To calculate ROI:
- Identify the Gain from Investment: (Current Value of Investment – Original Cost of Investment)
- Identify the Original Cost: The initial amount invested.
- Apply the Formula:
(Gain from Investment / Original Cost of Investment) x 100
Suppose you invested $5,000 in stocks, and they are now worth $6,500.
Gain from Investment = $6,500 – $5,000 = $1,500
ROI = ($1,500 / $5,000) x 100 = 0.30 x 100 = 30%
A 30% ROI indicates a strong performance relative to the initial outlay. Calculating ROI allows investors to compare the effectiveness of different investment vehicles (e.g., stocks vs. real estate) or evaluate the performance of their overall portfolio over time. It offers a standardized way to measure success, making it invaluable for strategic planning.

Analyzing Portfolio Allocation and Diversification
A well-diversified investment portfolio spreads risk across various asset classes. Percentages are essential for understanding and managing this allocation. By expressing each asset’s value as a percentage of your total portfolio, you can ensure your investments align with your risk tolerance and financial goals.
Let’s say your total portfolio is worth $100,000, and you have:
- Stocks: $60,000
- Bonds: $25,000
- Real Estate: $15,000
To find the percentage allocation for each:
- Stocks: ($60,000 / $100,000) x 100 = 60%
- Bonds: ($25,000 / $100,000) x 100 = 25%
- Real Estate: ($15,000 / $100,000) x 100 = 15%
This analysis helps you quickly see if you are over-allocated in one area or under-allocated in another. For instance, if your target is 70% stocks, you’ll know you need to adjust your portfolio by selling some bonds or real estate and buying more stocks, or directing new investments towards stocks. This percentage-based approach is fundamental to maintaining a balanced and resilient investment strategy, allowing you to rebalance your portfolio as market conditions or personal circumstances change.
Understanding Market Changes and Volatility
Financial news constantly reports market movements in percentages – “The S&P 500 rose 1.5% today” or “Company X’s stock dropped 5%.” These percentages provide context and indicate the magnitude of change, which is crucial for assessing market sentiment and potential volatility.
If a stock is trading at $100 and drops by 5%:
Percentage Drop = 5%
To find the dollar amount of the drop: (Percentage / 100) x Original Price
Dollar Drop = (5 / 100) x $100 = 0.05 x $100 = $5
New Stock Price = $100 – $5 = $95
Understanding these percentage changes helps investors quickly grasp the impact on their holdings, gauge market trends, and react appropriately. A small percentage drop might be negligible, while a significant percentage decline could signal a need for re-evaluation. Similarly, percentage gains are often celebrated, but understanding their context – over what period, against what benchmark – is key to informed decisions.
Percentages in Business and Entrepreneurship
For businesses, large and small, percentages are an indispensable tool for analyzing performance, profitability, and operational efficiency. They provide a clear, standardized way to measure success, identify areas for improvement, and make strategic decisions.
Profit Margins and Markup
In business, understanding how to calculate and interpret profit margins is critical for pricing strategies, cost control, and overall financial health.
-
Gross Profit Margin: This indicates the percentage of revenue left after subtracting the cost of goods sold (COGS).
Gross Profit Margin = ((Revenue - COGS) / Revenue) x 100
If a product sells for $100 and its COGS is $60, the gross profit is $40.
Gross Profit Margin = ($40 / $100) x 100 = 40%
A higher gross profit margin suggests better efficiency in production or sourcing. -
Net Profit Margin: This is the percentage of revenue left after all expenses, including COGS, operating expenses, interest, and taxes, have been deducted. It’s a key indicator of a company’s overall profitability.
Net Profit Margin = (Net Profit / Revenue) x 100
If a company has $1,000,000 in revenue and a net profit of $150,000, its net profit margin is 15%.
Net Profit Margin = ($150,000 / $1,000,000) x 100 = 15%
Comparing net profit margins to industry averages helps businesses gauge their competitive standing. -
Markup: This is the percentage added to the cost of a product to determine its selling price.
Markup Percentage = ((Selling Price - Cost) / Cost) x 100
If an item costs $50 to produce and sells for $75, the markup is $25.
Markup Percentage = ($25 / $50) x 100 = 50%
Understanding markup is vital for ensuring that products are priced to cover costs and generate desired profit levels.
Sales Growth and Market Share
Businesses constantly track their growth and position within their market, both of which are best expressed through percentages.
-
Sales Growth Rate: This measures the percentage increase or decrease in sales revenue over a specific period.
Sales Growth Rate = ((Current Period Sales - Prior Period Sales) / Prior Period Sales) x 100
If a company’s sales went from $500,000 last year to $600,000 this year:
Sales Growth Rate = (($600,000 – $500,000) / $500,000) x 100 = ($100,000 / $500,000) x 100 = 20%
Positive sales growth is a strong indicator of business health and market acceptance. -
Market Share: This represents a company’s sales as a percentage of total sales within its industry or market.
Market Share = (Company's Sales / Total Market Sales) x 100
If a company sells $1,000,000 worth of product in a market where total sales are $10,000,000:
Market Share = ($1,000,000 / $10,000,000) x 100 = 10%
Market share is a key metric for competitive analysis, indicating a company’s dominance or niche within an industry.
Expense Ratios and Operational Efficiency
Managing expenses is paramount for profitability. Percentage-based ratios provide a clear picture of how efficiently a business is operating.
-
Operating Expense Ratio: This ratio shows how much it costs a company to operate relative to its sales revenue.
Operating Expense Ratio = (Total Operating Expenses / Revenue) x 100
A lower ratio indicates greater operational efficiency. Businesses use this to benchmark against competitors and identify areas to reduce costs without impacting revenue generation. -
Debt-to-Equity Ratio: While not a direct percentage calculation of a part of a whole in the same way, this common financial ratio (often expressed as a percentage or decimal) compares a company’s total debt to its shareholder equity. It indicates the proportion of equity and debt used to finance a company’s assets. A high percentage suggests the company is largely financed by debt, which can imply higher risk.
These percentage-based metrics enable businesses to set targets, monitor performance against those targets, and make data-driven decisions to optimize their financial structure and operational effectiveness.
Common Pitfalls and Advanced Applications of Percentages
While the core percentage calculation is straightforward, its application in real-world finance often comes with nuances. Understanding these can prevent misinterpretations and unlock more sophisticated analyses.
Avoiding Misinterpretations: Percentage Points vs. Percent Change
A common area of confusion in finance is the distinction between “percentage points” and “percent change.” This difference can significantly alter the interpretation of financial news and data.
-
Percent Change: This refers to the relative change between two numbers, calculated using the standard
((New Value - Old Value) / Old Value) x 100formula. For example, if an interest rate increases from 4% to 5%, the percent change is((5 - 4) / 4) x 100 = (1 / 4) x 100 = 25%. This means the rate itself increased by 25%. -
Percentage Points: This refers to the absolute difference between two percentages. Using the same example, if an interest rate increases from 4% to 5%, it has increased by 1 percentage point (5% – 4% = 1%).
Misunderstanding this difference can lead to drastically different conclusions. A news headline stating “Interest rates increased by 25%” sounds far more dramatic than “Interest rates increased by 1 percentage point,” even if both refer to the same underlying change (e.g., from 4% to 5%). Always clarify which metric is being used to avoid misinterpreting financial shifts.
Using Financial Tools for Complex Percentage Calculations
While manual calculation is essential for understanding the fundamentals, modern financial life often involves more complex scenarios where dedicated tools become invaluable.
-
Spreadsheets (Excel, Google Sheets): These are perhaps the most versatile tools for percentage calculations. They allow you to set up formulas once and apply them across large datasets, making tasks like budgeting, investment tracking, and business financial analysis highly efficient. You can easily calculate percentages of income for various expense categories, project ROI with different scenarios, or analyze sales growth over multiple periods. Functions like
=(B2/A2)*100or simply formatting cells as percentages handle the math automatically. -
Financial Calculators: Dedicated financial calculators (physical or online) are designed to handle complex calculations involving interest, loans, annuities, and future value, all of which are deeply rooted in percentage mechanics. They simplify the process of determining loan payments, investment growth, or the present value of future cash flows.
-
Accounting Software: Business accounting software (e.g., QuickBooks, Xero) automatically generates financial reports, including profit and loss statements and balance sheets, where key performance indicators are often presented as percentages. This automation allows businesses to monitor their profit margins, expense ratios, and other vital metrics in real-time without manual calculation.
Leveraging these tools allows you to scale your financial analysis, move beyond simple percentages, and perform sophisticated projections, risk assessments, and scenario planning, all of which are critical for advanced financial management in both personal and business contexts.
Conclusion
The ability to accurately “get the percentage of a number” is far more than a basic mathematical skill; it is a cornerstone of financial literacy and empowerment in the Money niche. From dissecting your personal budget to evaluating investment opportunities and navigating the complexities of business finance, percentages provide the clarity and context necessary for informed decision-making.
By mastering the foundational formula—(Part / Whole) x 100—and understanding its nuanced applications, you gain an invaluable tool for analyzing financial data, comparing different options, and setting realistic goals. Whether it’s discerning the true cost of a loan through APR, measuring the profitability of an enterprise via net profit margins, or simply understanding how much of your income goes towards housing, percentages translate raw figures into actionable insights.
In a world increasingly driven by data, the power to interpret and utilize percentages effectively positions you to take greater control over your financial destiny. Embrace this fundamental concept, apply it consistently, and watch as your financial understanding deepens, leading to smarter choices and more robust financial health.
aViewFromTheCave is a participant in the Amazon Services LLC Associates Program, an affiliate advertising program designed to provide a means for sites to earn advertising fees by advertising and linking to Amazon.com. Amazon, the Amazon logo, AmazonSupply, and the AmazonSupply logo are trademarks of Amazon.com, Inc. or its affiliates. As an Amazon Associate we earn affiliate commissions from qualifying purchases.