
In the vast and often intricate world of finance, few mathematical concepts are as universally critical and frequently applied as percentages. From the mundane daily calculations of discounts and tips to the sophisticated analyses of investment returns, profit margins, and economic indicators, understanding “how to get the percentage of two numbers” isn’t merely an academic exercise—it’s an indispensable skill for informed financial decision-making.
This guide will demystify the core mechanics of percentage calculation, rooting each explanation firmly in its practical financial application. Whether you’re managing your personal budget, evaluating a potential investment, or scrutinizing business performance, a solid grasp of percentages will empower you to navigate the financial landscape with greater confidence and insight. We’ll explore the foundational principles, delve into diverse real-world financial scenarios, highlight the utility of modern financial tools, and ultimately equip you to interpret these powerful numbers accurately and strategically.

The Foundation: Grasping Percentage Basics for Financial Acumen
Before we dive into complex financial applications, it’s crucial to establish a clear understanding of what a percentage represents and the universal formula that underpins all calculations. This foundational knowledge is your first step towards financial literacy.
What Exactly is a Percentage?
At its simplest, a percentage is a way of expressing a number as a fraction of 100 (per cent means “per hundred”). It’s a standardized way to represent a part of a whole, making comparisons easier and more intuitive. For instance, saying “50 percent of your income goes to rent” is more immediately understandable than “0.5 of your income goes to rent” or “half of your income goes to rent,” especially when comparing against other expenses or incomes. It provides a common scale (out of 100) for various quantities.
The Universal Percentage Formula
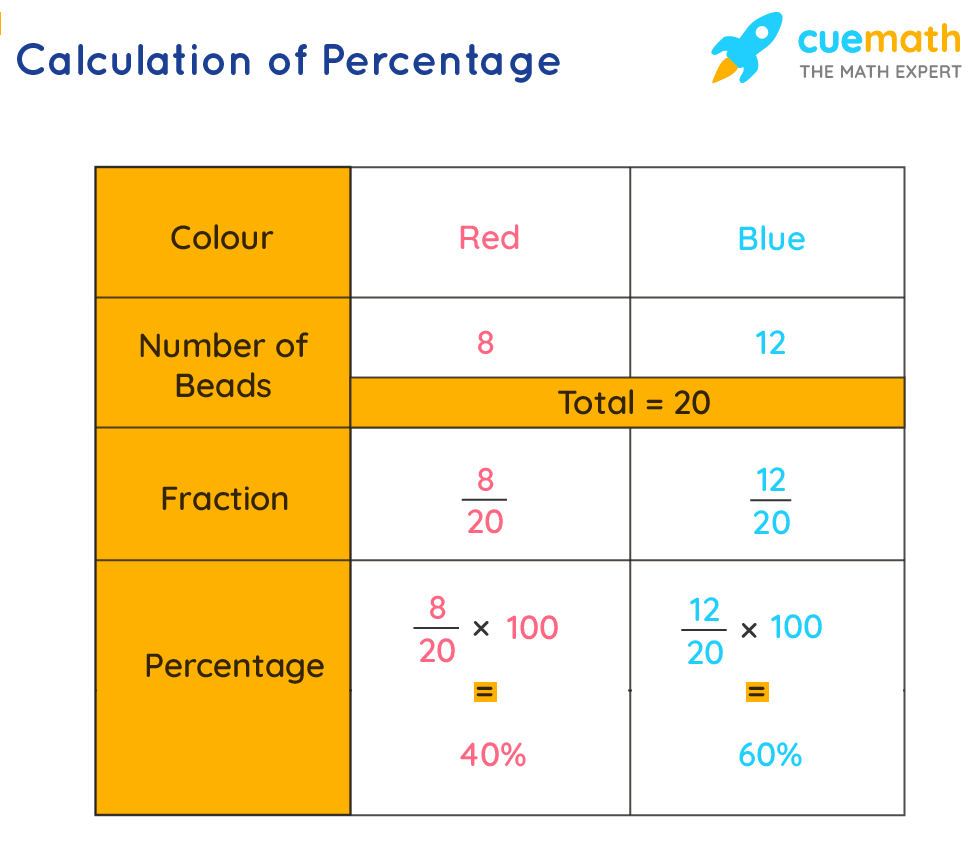
The core of calculating a percentage between two numbers revolves around a simple, yet powerful, formula. Regardless of the financial context, the principle remains constant:
Percentage = (Part / Whole) × 100
Let’s break down the components:
- Part: This is the specific amount or quantity you are interested in measuring or comparing. In financial terms, this could be your savings, a discount amount, a profit, or an expense.
- Whole: This represents the total amount or the base against which the ‘Part’ is being compared. Financially, this might be your total income, the original price of an item, the initial investment, or the total budget.
- × 100: Multiplying by 100 converts the decimal fraction (Part/Whole) into a percentage format, making it easier to read and understand.
For example, if you saved $200 from your $2000 monthly income, the ‘Part’ is $200 and the ‘Whole’ is $2000.
Percentage saved = ($200 / $2000) × 100 = 0.1 × 100 = 10%.
Why This Basic Formula is Your Financial Compass
This seemingly simple formula is the bedrock for nearly every financial metric you’ll encounter. It allows you to:
- Quantify Proportions: Understand what portion of your income goes to debt, or what percentage of a company’s sales are profit.
- Track Change: Measure growth in investments or reductions in expenses over time.
- Make Comparisons: Evaluate different investment opportunities or assess the impact of various financial decisions against a common benchmark.
- Forecast and Plan: Project future financial outcomes based on percentage-based assumptions.
Mastering this foundational calculation empowers you to not just read financial statements, but to truly understand and analyze them.
Everyday Money Matters: Applying Percentages to Personal Finance
Percentages are not just for financial experts; they are an integral part of managing your personal finances effectively. From shopping to budgeting to understanding debt, percentages empower you to make smarter daily decisions.
Unlocking Savings: Discounts and Sales Tax
One of the most common applications of percentages in daily life is when shopping.
- Discounts: A sale offering “25% off” means you save 25% of the original price. If an item costs $80 and has a 25% discount:
- Discount amount = $80 × 0.25 = $20
- New price = $80 – $20 = $60
- Sales Tax: Conversely, sales tax adds a percentage to the item’s price. If the sales tax is 8% on a $60 item:
- Tax amount = $60 × 0.08 = $4.80
- Total price = $60 + $4.80 = $64.80
Understanding these calculations ensures you know the real cost and actual savings.
Budgeting and Financial Planning: Allocating Your Income
Effective budgeting relies heavily on percentages. Many financial advisors recommend allocating income based on percentages (e.g., the 50/30/20 rule: 50% for needs, 30% for wants, 20% for savings/debt repayment).
If your net monthly income is $4,000:
- Needs (50%): $4,000 × 0.50 = $2,000
- Wants (30%): $4,000 × 0.30 = $1,200
- Savings/Debt (20%): $4,000 × 0.20 = $800
This method helps you visualize how your money is being distributed and identify areas for adjustment, empowering you to control your spending and savings.
Understanding Interest Rates and Loan Payments
Interest rates are perhaps the most significant percentage-based concept in personal finance.
- Savings Accounts: Earn a percentage (interest rate) on your deposited money.
- Loans and Credit Cards: You pay a percentage (APR – Annual Percentage Rate) on the money you borrow. Understanding the difference between simple interest and compound interest, and how an APR translates into monthly payments, is crucial for managing debt and maximizing savings. For example, a credit card with an 18% APR means you’re charged roughly 1.5% interest per month on your outstanding balance.
Tracking Financial Health: Income Growth and Expense Reduction
Percentages are invaluable for measuring financial progress over time.
- Income Growth: If your salary increased from $50,000 to $55,000:
- Change = $55,000 – $50,000 = $5,000
- Percentage Increase = ($5,000 / $50,000) × 100 = 10%
- Expense Reduction: If you cut your monthly grocery bill from $600 to $540:
- Change = $600 – $540 = $60
- Percentage Decrease = ($60 / $600) × 100 = 10%
These percentage changes provide clear indicators of your financial health and the effectiveness of your financial strategies.

Strategic Finance: Percentages in Business, Investing, and Economic Analysis
Beyond personal finance, percentages are the language of business, a critical tool for investors, and the metric by which economists gauge the health of nations.
Business Performance: Profit Margins and Growth Rates
Businesses live and breathe by percentages. They are essential for assessing profitability and growth.
- Gross Profit Margin: Measures the percentage of revenue left after deducting the cost of goods sold.
(Gross Profit / Revenue) × 100. A higher margin indicates better operational efficiency. - Net Profit Margin: Reveals the percentage of revenue remaining after all expenses (including taxes) are deducted.
(Net Profit / Revenue) × 100. This is the ultimate measure of a company’s profitability. - Growth Rates: Companies track year-over-year revenue growth, customer acquisition growth, and market share growth, all expressed as percentages. For example, if a company’s revenue increased from $1M to $1.2M in a year, its growth rate is
($0.2M / $1M) × 100 = 20%.
Investment Returns: Measuring Your Portfolio’s Success
Investors rely heavily on percentages to evaluate potential investments and track portfolio performance.
- Return on Investment (ROI): A fundamental metric showing the profitability of an investment.
((Current Value - Initial Investment) / Initial Investment) × 100. - Dividend Yield: The percentage of a company’s share price that it pays out in dividends annually.
- Compound Annual Growth Rate (CAGR): Used to smooth out volatile returns and provide an annualized growth rate over multiple periods. While more complex, it still fundamentally relies on percentage change calculations.
Understanding these metrics helps investors compare different assets and make informed decisions about where to allocate capital.
Economic Indicators: Inflation, Unemployment, and Market Share
Governments and economists use percentages to convey vital information about the economy.
- Inflation Rate: The percentage increase in the general price level of goods and services over a period, impacting purchasing power.
- Unemployment Rate: The percentage of the total labor force that is unemployed and actively seeking work.
- GDP Growth Rate: The percentage increase in a country’s Gross Domestic Product, indicating economic expansion or contraction.
These percentage-based indicators help policymakers, businesses, and individuals understand broader economic trends and their potential impact.
Beyond Manual Math: Utilizing Financial Tools for Precision
While understanding the manual calculation is crucial, modern financial life often involves larger datasets and more complex scenarios. Fortunately, a range of tools can simplify and automate percentage calculations, enhancing precision and efficiency.
Spreadsheet Power: Excel and Google Sheets for Complex Calculations
Spreadsheets are arguably the most ubiquitous and powerful tools for financial calculations. They allow users to input data, apply formulas, and instantly see results, making them ideal for budgeting, investment tracking, and business analysis.
- Basic Percentage Calculation: To find what percentage
B1is ofA1, you would enter=(B1/A1)*100in a cell. - Percentage Change: To calculate the percentage increase from an old value in
A1to a new value inB1, use=( (B1-A1) / A1 ) * 100. - Applying Percentages: To calculate a 20% increase on a value in
A1, use=A1 * 1.20or=A1 * (1 + 20%).
Their ability to handle multiple calculations, create dynamic models, and generate charts makes them indispensable for financial professionals and savvy individuals alike.
Online Calculators and Financial Apps
The digital age offers a plethora of online calculators and mobile apps designed to perform specific financial percentage calculations quickly and accurately.
- Loan Calculators: Determine monthly payments, total interest paid, and amortization schedules based on interest rates (percentages).
- Mortgage Calculators: Estimate payments and interest over the life of a home loan.
- Investment Return Calculators: Project future portfolio values based on expected percentage returns.
- Tip Calculators: Quickly figure out gratuity percentages.
These tools eliminate manual errors and provide instant insights for various financial decisions, from planning a large purchase to simply splitting a restaurant bill.
Mastering Percentage Interpretation: Avoiding Common Financial Missteps
Calculating percentages is one thing; interpreting them correctly, especially in a financial context, is another. Misunderstanding can lead to poor decisions.
The Critical Role of the Base Value
The “whole” or denominator in your percentage calculation (the base value) is paramount. A 10% increase sounds great, but 10% of $100 is far less impactful than 10% of $1,000,000. Always ask: “10% of what?”
- Example: A 20% return on an investment of $1,000 ($200 gain) is different from a 20% return on an investment of $100,000 ($20,000 gain). The percentage is the same, but the absolute financial impact varies wildly.
Percentage Points vs. Percentage Change
This distinction is crucial, especially when discussing interest rates, market share, or poll results.
- Percentage Change: Refers to the proportional change relative to the original value. (e.g., “The interest rate increased by 20%”). If the rate was 5%, a 20% increase means it’s now 5% * 1.20 = 6%.
- Percentage Points: Refers to the absolute difference between two percentages. (e.g., “The interest rate increased by 2 percentage points”). If the rate was 5%, a 2 percentage point increase means it’s now 5% + 2% = 7%.
Confusing these two can lead to significant misinterpretations of financial news and data.
Context is King: What Do the Numbers Really Mean?
A percentage, in isolation, tells only part of the story. Always consider the broader financial context.
- High Profit Margin: Is it sustainable? What are the industry averages?
- Low Investment Return: Is it during a market downturn? Is it consistent?
- Debt-to-Income Ratio: Is it high but offset by significant assets or job security?
Financial literacy means understanding the “why” and “how” behind the numbers, not just the numbers themselves.
Avoiding Misleading Statistics
Percentages can be powerful tools for persuasion, and sometimes for deception. Be wary of statistics that:
- Lack a Clear Base: “Our sales increased by 500%!” (From $10 to $60, or $1M to $6M?)
- Use Inappropriate Baselines: Comparing current performance to an abnormally low or high past period to exaggerate change.
- Conflate Percentage Points with Percentage Change: As discussed, this can vastly distort the perceived impact.
Developing a critical eye for percentage-based claims will protect you from making ill-advised financial decisions based on manipulated or poorly presented data.
Conclusion
Understanding “how to get the percentage of two numbers” is far more than a simple arithmetic exercise; it is a fundamental pillar of financial literacy. From navigating daily spending and saving to making strategic investment choices and comprehending global economic trends, percentages provide the quantitative framework for informed decision-making.
By grasping the core formula, applying it to diverse financial scenarios, leveraging modern calculation tools, and critically interpreting the results, you empower yourself to take control of your financial destiny. In a world awash with data, the ability to accurately calculate and understand percentages transforms raw numbers into actionable insights, making you a more savvy consumer, a wiser investor, and a more astute financial steward. Continuously honing this skill will be an invaluable asset throughout your financial journey.
aViewFromTheCave is a participant in the Amazon Services LLC Associates Program, an affiliate advertising program designed to provide a means for sites to earn advertising fees by advertising and linking to Amazon.com. Amazon, the Amazon logo, AmazonSupply, and the AmazonSupply logo are trademarks of Amazon.com, Inc. or its affiliates. As an Amazon Associate we earn affiliate commissions from qualifying purchases.