
In the digital age, data is the new currency, and the ability to interpret and manipulate numerical information is an invaluable skill. Among the myriad of numerical operations, calculating percentages stands out as one of the most fundamental and universally applicable. Whether you’re analyzing sales figures, tracking project completion rates, evaluating survey responses, or monitoring system performance, percentages provide a standardized and easily digestible way to express proportions, changes, and distributions. They transform raw numbers into meaningful insights, making complex data accessible and actionable.
For anyone working with data, mastering percentage calculations within spreadsheet software is not just an advantage—it’s a necessity. Tools like Microsoft Excel, Google Sheets, and Apple Numbers are the powerhouses behind modern data analysis, offering robust functionalities to perform these calculations with precision and efficiency. This guide will walk you through the essential concepts, practical applications, and advanced techniques for obtaining percentages in various digital “numbers” environments, ensuring your data analysis is always accurate, insightful, and impactful. We’ll delve into the mechanics of calculation, explore common scenarios, and provide best practices to elevate your data literacy.
Understanding the Fundamentals: What is a Percentage and Why It Matters in Data?
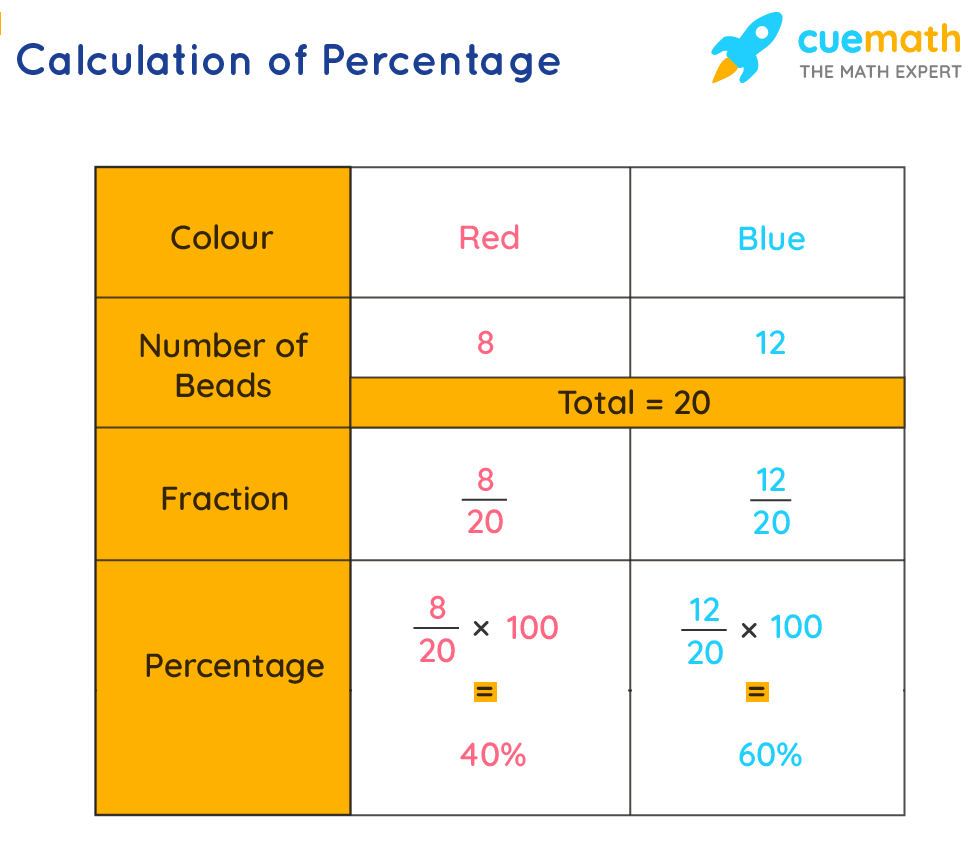
At its core, a percentage is a way of expressing a number as a fraction of 100. The word “percentage” is derived from the Latin “per centum,” meaning “by the hundred.” It’s denoted by the symbol “%” and is a dimensionless quantity, making it ideal for comparing different quantities or measuring relative change regardless of the original units. Understanding this basic concept is the bedrock upon which all more complex percentage calculations are built.
The Core Concept of Percentages
The fundamental formula for calculating a percentage is straightforward:
$$ text{Percentage} = frac{text{Part}}{text{Whole}} times 100% $$
Here, “Part” refers to the specific amount or quantity you are interested in, and “Whole” is the total amount or quantity against which the part is being compared. Multiplying by 100 converts the resulting decimal fraction into a percentage, making it easier to comprehend relative proportions. For example, if you sold 25 units out of a total stock of 100 units, your sales percentage would be (25/100) * 100% = 25%. This simple calculation provides a clear indicator of performance or distribution.
Real-World Applications Across Industries
While the formula is simple, its applications are vast and varied, touching almost every industry where data is collected and analyzed.
-
Business & Sales: Tracking market share, sales growth, profit margins, customer conversion rates, and discount calculations. A 15% increase in quarterly sales is a far more intuitive metric than stating sales grew from $200,000 to $230,000.
-
Technology & IT: Monitoring system uptime (e.g., “99.9% availability”), tracking project completion rates, analyzing software performance metrics, bug fix rates, and user adoption percentages for new features. For instance, knowing that 85% of users completed a specific onboarding flow helps product managers identify bottlenecks or successes.
-
Marketing & Analytics: Measuring campaign effectiveness (e.g., click-through rates, conversion rates), audience engagement, and website traffic statistics. A 3% click-through rate tells a clear story about an ad’s performance.
-
Research & Academia: Representing survey results, statistical significance, demographic distributions, and data trends. If 60% of respondents prefer a certain feature, that’s a powerful insight.
-
Project Management: Monitoring budget utilization, task completion percentages, and resource allocation. A project that is 75% complete provides a clear status update.
In each of these contexts, percentages serve as a powerful communication tool, simplifying complex numerical relationships into easily interpretable figures that drive decision-making.
Mastering Percentage Calculations in Popular Spreadsheet Software
The true power of “getting percentages in numbers” comes alive within spreadsheet applications. These tools provide dedicated functions and formatting options that streamline the calculation process, making it efficient and less prone to manual errors. While the underlying mathematical principle remains the same, the method of execution varies slightly across different platforms.
Microsoft Excel: Your Go-To for Data Mastery
Excel is arguably the most widely used spreadsheet program globally, renowned for its robust capabilities. Calculating percentages in Excel is intuitive:
-
Basic Percentage (Part of a Whole): If you have a “Part” in cell A2 and a “Whole” in cell B2, the formula in cell C2 would be
=A2/B2. To display this as a percentage, select cell C2 and click the “Percent Style” button (typically in the “Number” group of the “Home” tab) or useCtrl+Shift+%. Excel automatically multiplies the decimal by 100 and adds the ‘%’ symbol. -
Percentage Increase/Decrease: To calculate the percentage change from an “Old Value” (A2) to a “New Value” (B2), the formula is
=(B2-A2)/A2. Again, format the result as a percentage. A positive result indicates an increase, a negative a decrease. -
Percentage of a Total: To find what percentage one number is of a sum of numbers, you might use
=A2/SUM(A:A)or=A2/$B$2if the total is in B2. Using an absolute reference ($B$2) is crucial if you plan to drag the formula down to calculate percentages for other parts relative to the same total.
Google Sheets: Collaborative Cloud-Based Calculation
Google Sheets offers a very similar experience to Excel, with the added benefit of real-time collaboration and cloud storage. The formulas for percentages are virtually identical:
-
Basic Percentage:
=A2/B2. After entering the formula, select the cell and click the “Format as percent” icon (represented by ‘%’) in the toolbar, or navigate toFormat > Number > Percent. -
Percentage Increase/Decrease:
=(B2-A2)/A2. Format as a percentage. -
Percentage of a Total:
=A2/SUM(A:A)or=A2/$B$2. The use of absolute references ($) works the same way to lock a cell reference when dragging formulas.
The collaborative nature of Google Sheets makes it particularly useful for teams working on shared data analysis, ensuring everyone is looking at the same updated percentage figures.
Apple Numbers: Intuitive Design for Mac Users
Apple Numbers, part of the iWork suite, provides a more visually oriented and user-friendly interface, especially for those familiar with the Apple ecosystem. While its features are robust, the approach can feel slightly different.
-
Basic Percentage:
=A2/B2. Similar to Excel and Sheets, enter the formula. To format, select the cell, open the “Format” inspector on the right sidebar, go to the “Cell” tab, and choose “Percentage” from the “Data Format” dropdown. -
Percentage Increase/Decrease:
=(B2-A2)/A2. Format as a percentage using the inspector. -
Percentage of a Total:
=A2/SUM(A:A)or=A2/$B$2. Absolute references ($) work identically.
Numbers often uses tables within sheets, which can sometimes simplify referencing data within a specific table’s context.
Other Tools and Programming Contexts
Beyond dedicated spreadsheet software, percentages are frequently calculated in other data analysis environments:
-
Python (Pandas): For larger datasets, Python with the Pandas library is a powerful choice. If you have a DataFrame
dfwith columns ‘Part’ and ‘Whole’, you can calculate a new ‘Percentage’ column usingdf['Percentage'] = (df['Part'] / df['Whole']) * 100. You might then use.round(2)to format. -
R: Similar to Python, R’s data manipulation packages like
dplyrfacilitate percentage calculations. For example,mutate(Percentage = (Part / Whole) * 100). -
SQL: When querying databases, percentages can be calculated directly in your
SELECTstatements, e.g.,SELECT (part_column * 100.0 / whole_column) AS percentage FROM your_table;. It’s crucial to cast one of the numbers to a float (e.g.,100.0) to ensure floating-point division rather than integer division.
These programming environments are invaluable when dealing with massive datasets, automating reports, or integrating calculations into larger applications, extending the concept of “numbers” far beyond the traditional spreadsheet.
Essential Percentage Formulas and Their Practical Use Cases
Understanding the core tools is one thing; knowing the specific formulas for various scenarios is another. Here, we break down common percentage calculations you’ll encounter regularly.
Basic Percentage: Part of a Whole
This is the most fundamental calculation, as discussed earlier.
Formula: =(Part/Whole) (then format as percentage in spreadsheets)
Use Cases:
-
Compliance Rates: If 85 out of 100 employees completed mandatory training, the completion rate is 85%.
-
Resource Utilization: If a server uses 60GB of 200GB storage, it’s 30% utilized.
-
Survey Responses: If 300 out of 500 customers answered ‘yes’ to a question, 60% agreed.

Percentage Increase/Decrease
This formula measures the relative change between two values over time or across different categories.
Formula: =(New_Value - Old_Value) / Old_Value (then format as percentage)
Use Cases:
-
Sales Growth: Your sales increased from $10,000 last month to $12,000 this month.
=(12000-10000)/10000 = 0.2or 20% increase. -
Budget Variance: A project originally budgeted for $50,000 ended up costing $55,000.
=(55000-50000)/50000 = 0.1or 10% over budget. -
Performance Improvement: Website load time decreased from 5 seconds to 4 seconds.
=(4-5)/5 = -0.2or a 20% decrease.
Percentage Change Over Time (Compound Growth)
While simple percentage increase/decrease works for two points, sometimes you need to understand cumulative change, especially for financial or growth metrics.
Formula for Compound Annual Growth Rate (CAGR): =((End_Value/Start_Value)^(1/Number_of_Periods))-1
Use Cases:
-
Software Revenue Growth: Tracking the average annual growth rate of a SaaS product’s recurring revenue over several years.
-
Investment Returns: Calculating the annualized return on an investment over a multi-year period.
-
User Base Expansion: Determining the average percentage increase in active users for an application each year.
Calculating Percentage Distribution/Share
This involves determining the proportion each component contributes to a total.
Formula: =(Individual_Item_Value / Total_Sum_of_Items) (then format as percentage)
Use Cases:
-
Market Share: If Company A has $50M in sales and the total market is $200M, Company A has 25% market share.
-
Departmental Budget Allocation: If the IT department’s budget is $150,000 and the total company budget is $1,000,000, IT accounts for 15% of the budget.
-
Product Category Contribution: Determining what percentage of total sales comes from a specific product line.
These essential formulas equip you with the toolkit to tackle a wide array of data analysis challenges efficiently within your chosen numerical environment.
Beyond Basic Formulas: Advanced Tips for Percentage Analysis
While basic formulas are crucial, mastering percentages in spreadsheets involves more than just calculation. Leveraging advanced features can significantly enhance your data presentation and analytical capabilities.
Formatting Cells for Percentage Display
Always format cells containing percentage calculations to display as percentages. This not only adds the ‘%’ symbol but also automatically handles the multiplication by 100 for you. In most spreadsheets, simply select the cell(s) and click the ‘%’ button on the toolbar or access the number format options (e.g., Ctrl+Shift+% in Excel). Proper formatting ensures clarity and prevents misinterpretation of decimal values.
Using Absolute References for Consistent Calculations
When calculating percentages of a total from a list of items, you’ll often refer to a single “total” cell. To prevent this reference from changing when you drag the formula to other cells, use absolute references. This is done by adding dollar signs ($) before the column letter and row number (e.g., $B$10). This locks the reference to that specific cell, ensuring all parts are correctly compared against the same whole.
Conditional Formatting with Percentages
Conditional formatting is a powerful tool for visually highlighting data based on its value. You can use it with percentages to:
-
Spot Trends: Color-code cells based on percentage thresholds (e.g., red for percentages below 50%, green for above 90%).
-
Identify Outliers: Quickly see unusually high or low percentage values.
-
Track Progress: Use data bars to visually represent percentage completion towards a goal.
-
Highlight Variances: Use icon sets or color scales to indicate positive or negative percentage changes.
This visual feedback makes it easier to grasp insights at a glance without meticulously scrutinizing every number.
Creating Visualizations: Charts and Graphs for Percentage Data
Percentages are inherently quantitative, making them perfect for graphical representation. Charts and graphs can communicate percentage insights far more effectively than raw numbers alone:
-
Pie Charts/Donut Charts: Ideal for showing parts of a whole (e.g., market share, budget allocation, demographic distribution), where all slices add up to 100%.
-
Bar Charts/Column Charts: Excellent for comparing percentages across different categories or over time (e.g., percentage completion rates for different projects, month-over-month growth).
-
Line Charts: Best for illustrating trends of percentage change over a continuous period (e.g., percentage increase in website traffic over a year).
Leveraging these visualization tools transforms your percentage data into compelling narratives that are easily understood by diverse audiences, from technical teams to executive stakeholders.
Common Pitfalls and Best Practices for Accuracy
Even with powerful software, errors can creep into percentage calculations if best practices aren’t followed. Maintaining accuracy is paramount for reliable data analysis and decision-making.
Double-Checking Your Data Sources
The most common source of error isn’t the formula, but the input data. Ensure your “Part” and “Whole” values are correct, come from reliable sources, and are aligned. Mistakes in data entry or extracting incorrect ranges can lead to entirely misleading percentages. Always perform a quick sanity check: does the calculated percentage make intuitive sense given the raw numbers?
Understanding Data Types and Precision
Spreadsheets typically handle decimal precision well, but it’s important to be aware of how numbers are stored and displayed. While 0.333333 might display as 33%, the underlying value retains more precision. For critical calculations, be mindful of rounding. If you need exact percentages rounded to a specific decimal place, use the ROUND() function (e.g., =ROUND(A2/B2, 2) before formatting as percentage) to control precision explicitly. In programming languages, pay attention to integer vs. float division.
Avoiding Circular References and Formula Errors
A circular reference occurs when a formula directly or indirectly refers to the cell containing the formula itself, creating an infinite loop. This often happens when a percentage calculation tries to use its own result as part of its input. Spreadsheets usually warn you about circular references. Always ensure your “Part” and “Whole” are distinct and do not depend on the cell where the percentage result will be. Other common formula errors include dividing by zero (#DIV/0!), which occurs if your “Whole” value is zero. You can use error-handling functions like IFERROR() in Excel/Sheets (e.g., =IFERROR(A2/B2,0)) to gracefully manage such situations.
Documenting Your Formulas for Clarity
For complex spreadsheets or those shared with others, documenting your formulas is a best practice. Add comments to cells (e.g., “This calculates the percentage of total sales for Q1”) or maintain a separate sheet explaining the logic behind key calculations. This improves transparency, aids in troubleshooting, and ensures continuity if another team member takes over the analysis. Good documentation is part of a robust data governance strategy.
By adhering to these best practices, you can ensure that your percentage calculations are not only accurate but also robust, reliable, and easily understandable, solidifying your reputation as a meticulous data professional.

Conclusion
Calculating percentages in “numbers” environments, primarily spreadsheet software like Excel, Google Sheets, and Apple Numbers, is an indispensable skill in today’s data-driven world. It transforms raw data into understandable proportions, growth rates, and distributions, offering critical insights across virtually all industries and technical domains. From basic part-to-whole ratios to complex percentage changes over time, mastering these calculations and leveraging the advanced features of your chosen software empowers you to analyze data with precision, present findings with clarity, and make informed decisions.
By understanding the fundamental concepts, utilizing the right formulas, harnessing visualization tools, and adhering to best practices, you can move beyond mere data entry to become a proficient data analyst. The ability to effectively “get percentage in numbers” is more than just a technical trick; it’s a foundational element of data literacy that drives innovation, optimizes performance, and provides a clear lens through which to view the numerical landscape. Embrace these techniques, and unlock the full potential of your data.
aViewFromTheCave is a participant in the Amazon Services LLC Associates Program, an affiliate advertising program designed to provide a means for sites to earn advertising fees by advertising and linking to Amazon.com. Amazon, the Amazon logo, AmazonSupply, and the AmazonSupply logo are trademarks of Amazon.com, Inc. or its affiliates. As an Amazon Associate we earn affiliate commissions from qualifying purchases.