
In the world of finance, numbers tell a story, and percentages are the crucial narrative device that brings that story to life. Whether you’re a seasoned investor, a budding entrepreneur, or simply managing your household budget, understanding how to derive a percentage from two numbers is a fundamental skill that empowers informed decision-making. It’s not just about arithmetic; it’s about gaining clarity, measuring performance, and spotting opportunities or risks that might otherwise remain hidden in raw data.
This guide will demystify the process of calculating percentages, providing you with a clear methodology and illustrating its profound relevance across various financial applications. By the end, you’ll not only know how to perform this calculation but also why it’s an indispensable tool in your financial toolkit.

The Foundational Math Behind Percentages for Financial Clarity
At its core, a percentage represents a portion of a whole, expressed as a fraction of 100. It’s a standardized way to compare quantities and understand relative changes, making it invaluable when dealing with diverse financial figures.
Understanding the Simple Yet Powerful Formula: (Part / Whole) × 100
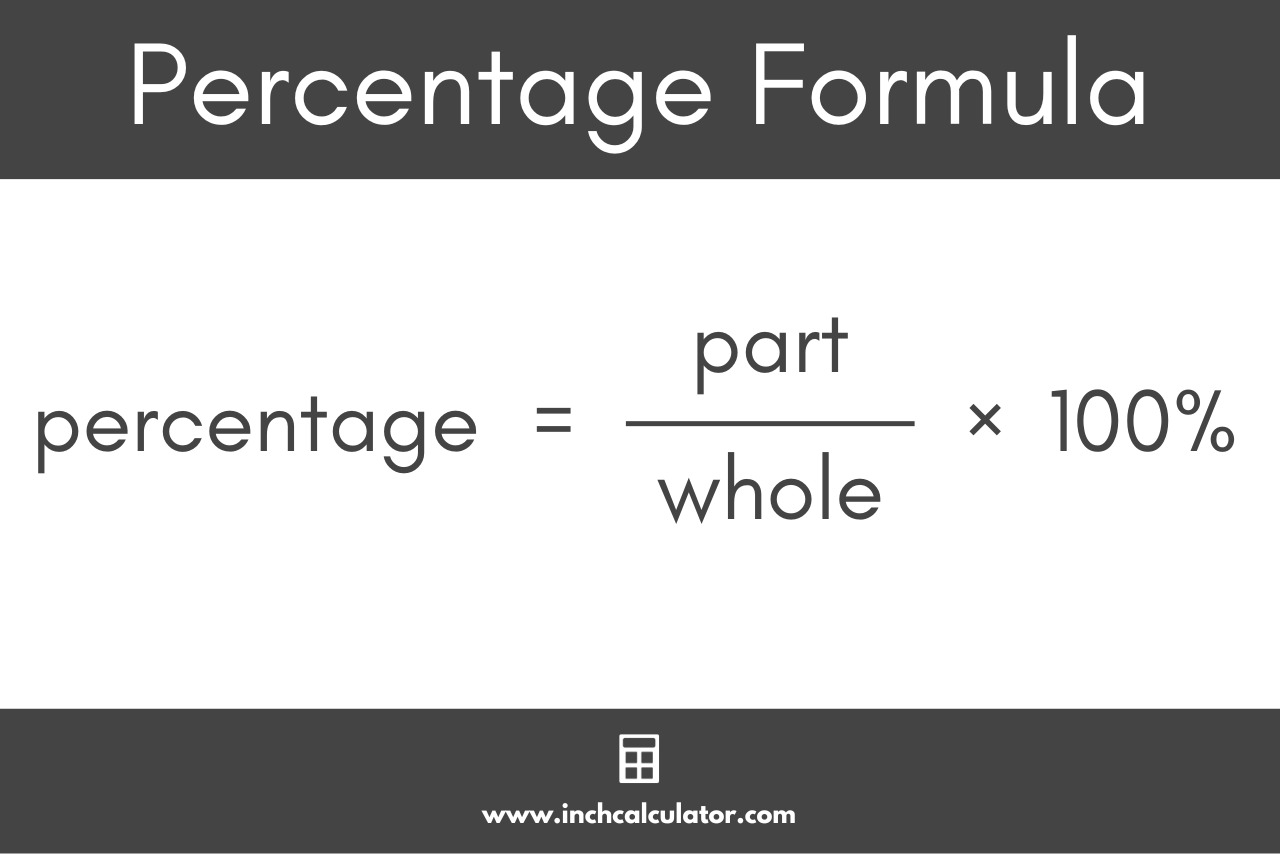
The formula for calculating a percentage is remarkably straightforward:
Percentage = (Part / Whole) × 100
Let’s break down these components:
- Part: This is the specific amount or portion you want to express as a percentage. It could be a discount amount, the profit earned, the interest paid, or a specific expense.
- Whole: This is the total amount or the reference point against which the “part” is being compared. This might be the original price, total revenue, the principal loan amount, or your total monthly income.
- × 100: Multiplying by 100 converts the decimal fraction into a percentage, making it easier to understand and compare.
Consider an example: You spend $30 on groceries from a total budget of $500.
Here, the “Part” is $30, and the “Whole” is $500.
Percentage = ($30 / $500) × 100 = 0.06 × 100 = 6%.
This tells you that your grocery expenditure represents 6% of your budget. Simple, yet powerful for budgeting.
Step-by-Step Calculation Examples in Financial Contexts
Let’s walk through a few more financially relevant scenarios to solidify your understanding.
Example 1: Calculating a Discount Rate
You see a product originally priced at $250, now on sale for $200. You want to know the percentage discount.
- Find the “Part” (the discount amount): Original Price – Sale Price = $250 – $200 = $50.
- Identify the “Whole” (the original price): $250.
- Apply the formula: ($50 / $250) × 100 = 0.20 × 100 = 20%.
The product is discounted by 20%.
Example 2: Determining Investment Return
You invested $1,000 in a stock, and it grew to $1,150. What is your percentage return on investment (ROI)?
- Find the “Part” (the profit): Current Value – Initial Investment = $1,150 – $1,000 = $150.
- Identify the “Whole” (the initial investment): $1,000.
- Apply the formula: ($150 / $1,000) × 100 = 0.15 × 100 = 15%.
Your investment yielded a 15% return.
Common Pitfalls and How to Avoid Them
While the formula is simple, misidentifying the “Part” or the “Whole” is a common error that can lead to skewed financial analysis.
- Confusing the Base (Whole): Always ensure your “Whole” is the correct reference point. For discounts, it’s the original price, not the sale price. For growth, it’s the initial value, not the final value.
- Incorrectly Calculating the “Part”: Ensure you’re calculating the specific amount you want to express as a percentage. If you want the percentage change, the “Part” is the difference between the two numbers, not one of the numbers themselves.
- Forgetting to Multiply by 100: This will leave you with a decimal, which is often harder to interpret quickly as a percentage. While technically correct (0.20 is 20%), expressing it as “20%” is the conventional and clearer format.
Why Percentages Matter: Financial Applications Across the Board
The ability to calculate percentages isn’t merely an academic exercise; it’s a cornerstone of financial literacy that impacts nearly every aspect of managing money.
Tracking Budget Deviations and Savings Goals
Budgeting is fundamentally about managing proportions. Percentages allow you to see how much of your income is allocated to housing, food, entertainment, and, critically, savings.
- Expense Ratios: If your rent is $1,000 and your monthly income is $4,000, your housing expense is ($1,000 / $4,000) × 100 = 25% of your income. This helps you adhere to rules like the 50/30/20 budget (50% needs, 30% wants, 20% savings).
- Savings Rate: If you save $800 from a $4,000 income, your savings rate is ($800 / $4,000) × 100 = 20%. Tracking this percentage over time reveals your progress toward financial independence.
Analyzing Loan Interest and Credit Card Rates
Interest rates are arguably the most common and impactful use of percentages in personal finance.
- Annual Percentage Rate (APR): This tells you the annual cost of borrowing money. Understanding how a 15% APR on a credit card differs from a 5% mortgage rate is crucial for managing debt.
- Interest Paid: If you have a $10,000 loan at 5% interest, you know you’ll pay $500 in interest ($10,000 × 0.05) in the first year (simple interest example). Calculating the percentage of your payment that goes towards interest versus principal helps you see the true cost of borrowing.
Understanding Discounts, Sales, and Markups
Every time you shop, percentages are at play.
- Smart Shopping: A “25% off” sale immediately translates to a specific saving if you know the original price. You can quickly calculate the final price or compare different discount offers.
- Retail Markups: For small business owners, understanding percentage markups (e.g., selling a product for $15 that cost $10 is a 50% markup on cost) is vital for setting profitable prices.
Percentages for Smart Investing and Wealth Building
Beyond everyday finances, percentages are the language of investment performance and strategic wealth management.
Calculating Investment Returns (ROI)
Return on Investment (ROI) is a critical metric for evaluating the profitability of an investment.
- Gains and Losses: If an investment of $5,000 grows to $5,600, your percentage gain is (($5,600 – $5,000) / $5,000) × 100 = 12%. Conversely, a loss would be expressed as a negative percentage.
- Comparing Performance: Percentages allow you to compare the performance of different investments, regardless of their initial cost. A 10% return on a $1,000 investment ($100 gain) is proportionally the same as a 10% return on a $100,000 investment ($10,000 gain).
Understanding Portfolio Allocation
A diversified investment portfolio spreads risk across various asset classes (stocks, bonds, real estate, etc.). Percentages define this allocation.
- Asset Mix: Knowing that 60% of your portfolio is in stocks, 30% in bonds, and 10% in real estate helps you maintain your desired risk profile and rebalance when necessary. For instance, if stocks perform exceptionally well, their percentage might grow, requiring you to sell some stocks and buy bonds to restore your target allocation.
The Impact of Inflation and Compound Interest
Two powerful forces in finance—inflation and compound interest—are best understood through percentages.
- Inflation’s Erosion: If inflation is 3% per year, your purchasing power diminishes by 3% annually if your income doesn’t keep pace. Understanding this percentage helps you make decisions about salary negotiations or where to store your savings.
- Compound Growth: The “miracle” of compound interest is a percentage game. Earning 7% interest annually on your investments means your principal grows by 7% each year, and that 7% is then applied to the new, larger principal the following year, leading to exponential growth.
Leveraging Percentages in Business and Income Generation
For entrepreneurs, side hustlers, or anyone involved in business operations, percentages are indispensable for measuring success and making strategic decisions.
Determining Profit Margins and Break-Even Points
Businesses thrive on profitability, and percentages are the standard metric.
- Gross Profit Margin: This tells you the percentage of revenue left after deducting the cost of goods sold. If a product sells for $100 and costs $40 to make, the gross profit is $60, and the gross profit margin is ($60 / $100) × 100 = 60%. This helps assess pricing strategies and cost efficiency.
- Net Profit Margin: This is the ultimate measure of profitability, indicating the percentage of revenue left after all expenses are deducted. A healthy net profit margin is a sign of a well-run business.
- Break-Even Analysis: Understanding what percentage of your capacity or sales you need to achieve just to cover costs is vital for business planning.
Analyzing Sales Growth and Market Share
Businesses constantly monitor their growth and competitive standing using percentages.
- Sales Growth: If sales increased from $100,000 last quarter to $110,000 this quarter, that’s a (($110,000 – $100,000) / $100,000) × 100 = 10% growth rate. This metric is key for investors and internal strategy.
- Market Share: If your company’s revenue is $1 million in a total market of $10 million, your market share is ($1 million / $10 million) × 100 = 10%. Tracking this percentage shows your competitive position and how it changes over time.
Calculating Commissions and Royalty Payments
Many income streams, particularly in sales or creative fields, are based on percentages.
- Sales Commissions: A salesperson earning 5% commission on $20,000 in sales knows they’ll receive $1,000 ($20,000 × 0.05).
- Royalties: Authors, musicians, and artists often receive a percentage of sales or revenue from their work (e.g., 10% royalty on book sales). Accurately calculating these percentages ensures fair compensation.
Financial Tools and Technology for Percentage Calculations
While the underlying math is simple, modern financial tools make percentage calculations even easier and more efficient, especially when dealing with large datasets or complex scenarios.
Using Spreadsheets (Excel, Google Sheets) for Financial Analysis
Spreadsheets are arguably the most powerful tool for financial professionals and individuals alike.
- Automated Calculations: You can input your “Part” and “Whole” into different cells and have a formula automatically calculate the percentage. For example, if cell A1 contains the “Part” and B1 contains the “Whole”, the formula
= (A1/B1)*100in cell C1 will give you the percentage. - Dynamic Analysis: Spreadsheets allow you to quickly adjust figures and see the immediate impact on percentages, making scenario planning (e.g., “What if my sales increase by 15%?”) incredibly easy.
- Charting and Visualization: Percentages are often best understood visually through pie charts (for allocation) or bar charts (for growth comparisons), which spreadsheets generate effortlessly.
Online Calculators and Financial Apps
For quick, on-the-go calculations, numerous online percentage calculators and financial apps are available.
- Specialized Calculators: Websites often offer specific calculators for mortgage interest, loan payments, investment returns, or tip calculations, all of which rely on percentage mechanics.
- Budgeting Apps: Many personal finance apps automatically calculate expense percentages, savings rates, and debt-to-income ratios, providing instant insights without manual calculations.
When to Use a Simple Calculator vs. Advanced Software
- Simple Calculator: Ideal for one-off, basic percentage calculations like a single discount or a quick profit margin check.
- Spreadsheet Software: Indispensable for ongoing financial tracking, budgeting, investment analysis, business forecasting, and when you need to perform many percentage calculations or analyze trends over time.
- Specialized Financial Apps: Excellent for specific financial tasks (e.g., tax calculation, retirement planning) where pre-built templates and financial logic simplify complex percentage-based scenarios.

The Power of Percentage Fluency in Financial Success
Mastering how to get a percentage out of two numbers is far more than a mathematical trick; it’s a foundational pillar of financial literacy. From dissecting your personal budget and evaluating investment opportunities to understanding loan terms and assessing business performance, percentages provide the context and clarity necessary for informed decision-making.
By internalizing this simple formula and understanding its myriad applications across the financial landscape, you equip yourself with an invaluable skill. You move beyond just seeing raw numbers to comprehending their relative significance, growth, decline, and impact. In a world increasingly driven by data, the ability to fluently speak the language of percentages is not just an advantage—it’s a prerequisite for achieving and maintaining financial success. Embrace this fundamental concept, and unlock a deeper understanding of your financial world.
aViewFromTheCave is a participant in the Amazon Services LLC Associates Program, an affiliate advertising program designed to provide a means for sites to earn advertising fees by advertising and linking to Amazon.com. Amazon, the Amazon logo, AmazonSupply, and the AmazonSupply logo are trademarks of Amazon.com, Inc. or its affiliates. As an Amazon Associate we earn affiliate commissions from qualifying purchases.