
In the world of finance, numbers tell a story. They reveal growth, decline, proportion, and progress. Among the most fundamental yet powerful tools for deciphering these stories is the ability to calculate percentages. Specifically, understanding how to find the percentage of a number between two other numbers is a skill that transcends basic arithmetic, becoming a cornerstone of sound financial decision-making, astute investing, and meticulous budgeting.
While the phrase “percentage of a number between two numbers” might initially sound abstract, its practical applications are vast and varied within personal finance, investing, and business. Are you trying to determine your investment’s growth relative to its initial purchase price and a target sell price? Do you want to know what portion of your income falls within a specific spending category compared to your overall budget? Or perhaps you’re assessing the completion rate of a financial goal within a defined range? This calculation empowers you to quantify relationships, track progress, and make informed choices, moving beyond raw figures to grasp their true significance.

This article will demystify this essential financial concept, breaking down its various interpretations and providing clear, actionable steps for calculation. We’ll explore its critical role across diverse financial scenarios, offer practical examples, and equip you with the knowledge to leverage this skill for greater financial clarity and control.
Understanding the Core Concept: What Are We Really Calculating?
Before diving into formulas and applications, it’s crucial to establish a clear understanding of what “percentage of a number between two numbers” entails in a financial context. The interpretation can vary slightly depending on the specific financial question being asked. Generally, it refers to one of three common scenarios: percentage change, percentage proportion, or percentage completion within a defined range.
The Basics of Percentage: Parts per Hundred
At its heart, a percentage is simply a way of expressing a number as a fraction of 100. The word “percent” literally means “per hundred.” So, 25% means 25 out of 100, or 25/100, which is 0.25 in decimal form. This fundamental understanding is critical because all percentage calculations revolve around converting a fraction or ratio into a base-100 representation. In finance, this allows us to standardize comparisons, making it easier to evaluate performance, risk, and value across different scales. Whether you’re comparing the return on two different investments or the proportion of your income spent on housing versus transport, expressing these as percentages provides a universally understandable metric.
Interpreting “Between Two Numbers” in Finance
The phrase “between two numbers” often implies a relationship or a relative position. In finance, this usually manifests in specific ways:
- Percentage Change (Growth or Decline): This is perhaps the most common interpretation. Here, the “two numbers” are a starting value (V1) and an ending value (V2). You’re calculating the percentage change from V1 to V2. This is vital for understanding investment returns, inflation rates, or business revenue growth.
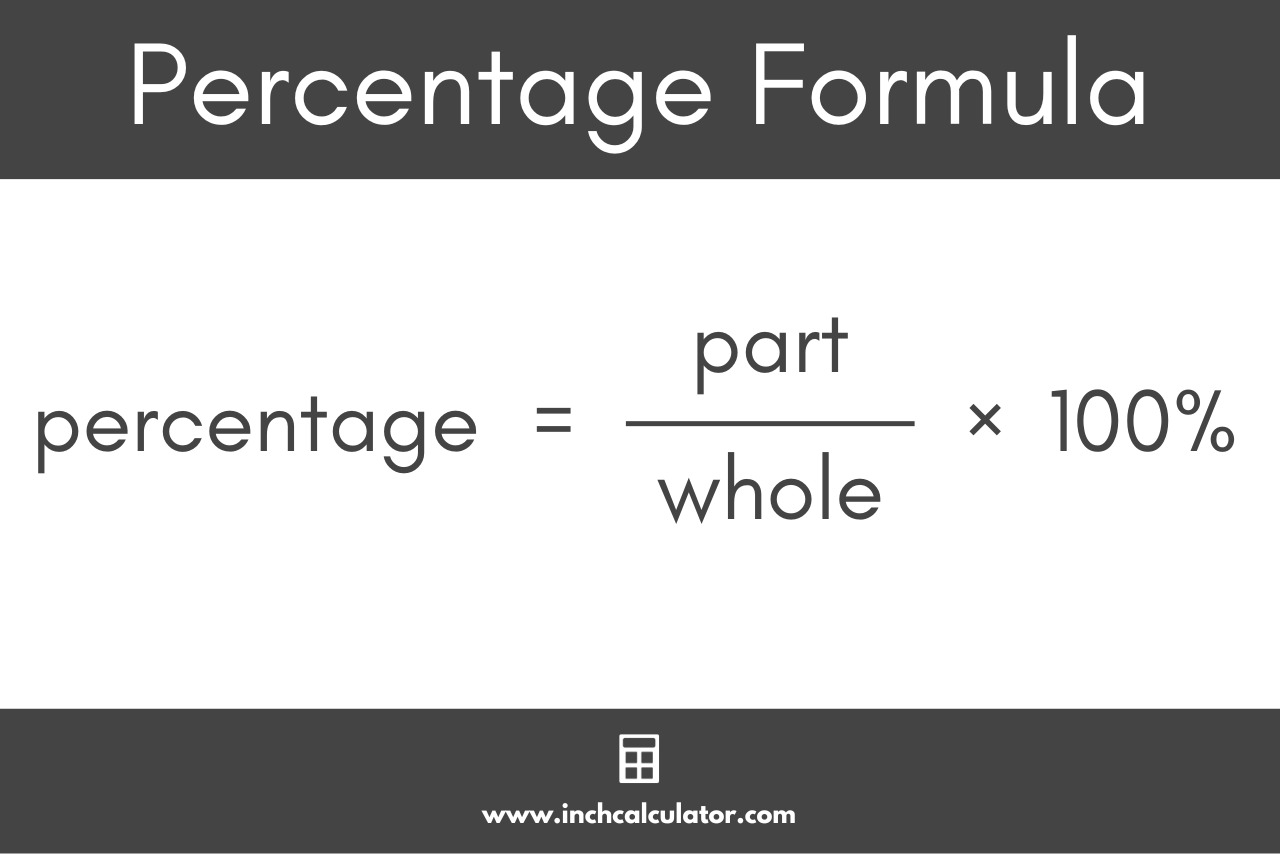
- Percentage Proportion within a Whole: In this scenario, one of the “two numbers” defines a “whole” or a total, and the other is a “part” of that whole. You are finding what percentage the “part” represents of the “whole.” For instance, what percentage of your total income (the whole) is your housing expense (the part)?
- Percentage Completion/Progress within a Range: Here, “between two numbers” signifies a defined spectrum (e.g., a financial goal from $0 to $10,000, or a budget range from minimum to maximum). You’re calculating where a current number falls within that defined range as a percentage. This is useful for tracking progress towards a savings target or measuring how much of a project budget has been utilized.
Understanding these distinctions is the first step toward applying the correct calculation method and extracting meaningful financial insights.
Practical Applications in Personal Finance and Investing
The ability to calculate percentages in these contexts is not merely an academic exercise; it’s a practical skill with tangible benefits for managing and growing your money.
Calculating Investment Returns and Growth
For investors, percentages are the language of performance.
- Stock Growth/Decline: If you bought a stock for $50 and it’s now worth $65, what’s your percentage gain? This is a percentage change calculation. Knowing this allows you to assess the profitability of your investments.
- Mutual Fund Performance: Financial reports often state that a fund returned X% over a year. Understanding how this percentage is derived from the fund’s net asset value (NAV) changes helps you interpret its performance critically.
- Portfolio Allocation: What percentage of your overall investment portfolio is allocated to stocks, bonds, or real estate? This helps you manage risk and diversification, ensuring your portfolio aligns with your financial goals and risk tolerance. For example, if your total portfolio is $100,000 and you have $30,000 in a specific tech stock, that’s 30% of your portfolio, informing your rebalancing decisions.
Understanding Loan Interest and Debt Ratios
Debt is a significant part of many financial lives, and percentages illuminate its true cost and impact.
- Interest Rates: Mortgage rates, credit card APRs, and personal loan interest are all expressed as percentages. Understanding how these percentages translate into actual dollar costs over time is crucial for debt management and comparison shopping for loans.
- Debt-to-Income Ratio (DTI): Lenders use DTI to assess your ability to manage monthly payments and repay debts. It’s calculated as your total monthly debt payments divided by your gross monthly income, expressed as a percentage. A lower DTI percentage indicates a healthier financial standing. For example, if your monthly debt payments (rent, car loan, credit card minimums) total $1,500 and your gross monthly income is $5,000, your DTI is 30% ($1,500 / $5,000 * 100).
- Credit Utilization: This is the percentage of your total available credit that you are currently using. A low utilization percentage (typically below 30%) is good for your credit score. If you have a $10,000 credit limit and an outstanding balance of $2,000, your utilization is 20%.
Budgeting and Expense Tracking
Effective budgeting relies heavily on percentage analysis, enabling you to allocate resources wisely and identify areas for adjustment.
- Income Allocation: The popular 50/30/20 rule (50% needs, 30% wants, 20% savings/debt repayment) is a prime example of percentage-based budgeting. You divide your after-tax income into these percentage categories.
- Category Spending: What percentage of your monthly income goes towards housing, food, transportation, or entertainment? Tracking these percentages reveals where your money is truly going and helps you identify overspending. If your income is $4,000 and you spend $1,200 on rent, that’s 30% of your income. Comparing this to a target percentage or industry benchmarks provides valuable insights.
- Savings Rate: This is the percentage of your income that you save. A higher savings rate accelerates your journey toward financial independence.
Discounts, Markups, and Sales Tax
From everyday shopping to business transactions, percentages govern pricing.
- Discounts: When an item is “20% off,” you need to calculate the actual dollar savings and the final price. This simple calculation prevents overpaying and ensures you understand the true value of a deal.
- Sales Tax: Sales tax is a percentage added to the price of goods and services. Knowing how to calculate it accurately helps you budget for purchases and understand the total cost.
- Markups: Businesses use markups (a percentage added to the cost of a product) to determine sale prices and profit margins. Understanding these percentages can give you insight into pricing strategies and value propositions.
Step-by-Step Guide to Calculating Percentages (with Examples)
Let’s break down the common methods for calculating percentages, aligning with the “between two numbers” context in finance.
Method 1: Percentage Change (Growth or Decline)
This method answers the question: “By what percentage has a value increased or decreased from an initial point to a final point?”
Formula: ((Final Value - Initial Value) / Initial Value) * 100
Example 1: Investment Growth
You bought shares of a company for $1,000 (Initial Value). After a year, they are worth $1,250 (Final Value). What is the percentage increase in your investment?
- Find the difference: $1,250 – $1,000 = $250
- Divide by the initial value: $250 / $1,000 = 0.25
- Multiply by 100 to get the percentage: 0.25 * 100 = 25%
Your investment grew by 25%.
Example 2: Expense Reduction
Your monthly utility bill was $150 last month (Initial Value), and this month it’s $120 (Final Value). What is the percentage decrease?
- Find the difference: $120 – $150 = -$30
- Divide by the initial value: -$30 / $150 = -0.20
- Multiply by 100: -0.20 * 100 = -20%
Your utility bill decreased by 20%.
Method 2: Percentage of a Part to a Whole (Proportion)

This method answers: “What percentage does a specific part represent of a larger whole?”
Formula: (Part / Whole) * 100
Example 1: Budget Allocation
Your monthly net income (Whole) is $4,500. You spend $1,350 (Part) on housing. What percentage of your income goes to housing?
- Divide the part by the whole: $1,350 / $4,500 = 0.30
- Multiply by 100: 0.30 * 100 = 30%
30% of your income goes to housing.
Example 2: Portfolio Diversification
Your total investment portfolio (Whole) is $80,000. You have $24,000 (Part) invested in a bond fund. What percentage of your portfolio is in the bond fund?
- Divide the part by the whole: $24,000 / $80,000 = 0.30
- Multiply by 100: 0.30 * 100 = 30%
30% of your portfolio is allocated to the bond fund.
Method 3: Percentage Completion/Progress within a Range
This method answers: “What percentage of a defined range (from a starting point to an ending goal) has been achieved by a current value?” This directly addresses the “number between two numbers” framing.
Formula: ((Current Value - Start Value) / (End Value - Start Value)) * 100
Example 1: Savings Goal Progress
You have a savings goal to accumulate $10,000 (End Value). You started with $0 (Start Value) and have currently saved $3,500 (Current Value). What percentage of your goal have you reached?
- Calculate the range size: $10,000 – $0 = $10,000
- Calculate progress within the range: $3,500 – $0 = $3,500
- Divide progress by range size: $3,500 / $10,000 = 0.35
- Multiply by 100: 0.35 * 100 = 35%
You have achieved 35% of your savings goal.
Example 2: Project Budget Utilization
A project has an allocated budget (End Value) of $50,000. It started with $0 (Start Value), and $20,000 (Current Value) has been spent so far. What percentage of the budget has been utilized?
- Calculate the total budget range: $50,000 – $0 = $50,000
- Calculate the amount spent relative to start: $20,000 – $0 = $20,000
- Divide amount spent by total budget: $20,000 / $50,000 = 0.40
- Multiply by 100: 0.40 * 100 = 40%
40% of the project budget has been utilized.
Common Pitfalls and How to Avoid Them
Even with straightforward formulas, errors in percentage calculations can lead to significant financial misinterpretations.
Choosing the Correct Base Number
This is perhaps the most common mistake. In percentage change, always divide by the initial or original value, not the final value or the difference. In proportion, always divide by the whole or total. Using the wrong base number fundamentally changes the meaning of the percentage. For instance, an investment growing from $100 to $120 is a 20% increase ($20/$100). If you mistakenly divided by the final value ($20/$120), you’d get 16.67%, which is incorrect for expressing the growth from the starting point.
Misinterpreting “Between”: Relative vs. Absolute
Understand whether you need a percentage change (relative to a starting point), a proportion (relative to a total), or progress within a defined range. For example, a mutual fund may show an absolute return of $1,000, but its relative return (percentage) is crucial for comparing it to other investments. A 10% gain on $10,000 is different from a 10% gain on $100,000, even though “10%” sounds the same. Always consider the context and the specific question you’re trying to answer.
Rounding Errors and Precision
In finance, small rounding errors can accumulate, especially in large transactions or over long periods (like compound interest). While rounding to two decimal places is generally acceptable for percentages, understand when higher precision is necessary, particularly in professional financial analysis or when dealing with significant sums. For example, interest rates often use several decimal places to reflect precise calculations.
Confusing Absolute vs. Relative Change
A common error is confusing absolute dollar changes with relative percentage changes. If your income increases by $100, that’s an absolute change. But if your income was $2,000, a $100 increase is a 5% relative change. If your income was $10,000, a $100 increase is only a 1% relative change. Both numbers are useful, but they convey different information. Financial decisions often depend more on relative changes, as they contextualize the magnitude of the change.
Leveraging Digital Tools for Percentage Calculations
While understanding the manual calculations is vital, digital tools significantly streamline the process, reduce errors, and allow for more complex analysis.
Spreadsheets (Excel, Google Sheets)
Spreadsheets are indispensable for financial calculations. They allow you to set up formulas once and apply them to vast datasets, making budgeting, investment tracking, and financial modeling incredibly efficient.
- Built-in Functions: Spreadsheets have functions that make percentage calculations straightforward. For instance, to calculate percentage change in Excel/Google Sheets, if your initial value is in cell A2 and your final value is in B2, the formula
=(B2-A2)/A2will give you the decimal change, which you can then format as a percentage. - Dynamic Analysis: You can easily change initial values or targets and instantly see how percentages shift, enabling powerful “what-if” scenario planning for your finances.
- Visualizations: Spreadsheets also allow you to create charts and graphs that visually represent percentage allocations or changes over time, making financial data easier to interpret.
Online Calculators and Financial Apps
The internet abounds with specialized calculators for virtually every financial percentage need.
- Mortgage Calculators: These compute the percentage of your payment going to principal vs. interest, and the overall interest rate.
- Investment Return Calculators: Input your initial investment, contributions, and final value to get your annualized percentage return.
- Budgeting Apps: Many personal finance apps automatically categorize your spending and display it as percentages of your income or budget categories, providing instant insights.
These tools are convenient for quick calculations and understanding the impact of various financial decisions without manual computations.
Understanding Financial Software
Professional financial software, used by financial advisors and businesses, integrates sophisticated percentage calculations automatically. These tools handle complex scenarios like compound annual growth rates (CAGR), internal rates of return (IRR), and discounted cash flow (DCF) analysis, which all rely on fundamental percentage principles. Even if you’re not using these high-end tools, understanding the underlying percentage mechanics helps you interpret their outputs and converse intelligently with financial professionals.
Conclusion
Mastering the art of finding the percentage of a number between two numbers is not just about mathematical proficiency; it’s about gaining a deeper command over your financial life. Whether you are tracking the growth of your investments, meticulously planning your budget, dissecting the cost of debt, or evaluating a new financial goal, percentages provide the context and clarity necessary for informed decision-making.
By understanding the subtle distinctions between percentage change, proportion, and progress within a range, and by diligently applying the correct formulas, you unlock the ability to truly read the financial stories hidden within your numbers. Leverage the power of digital tools like spreadsheets and online calculators to streamline these processes, but always ground your understanding in the core principles. In a world awash with financial data, the ability to interpret these figures as meaningful percentages empowers you to build wealth, manage debt, and achieve your financial aspirations with confidence and insight.
aViewFromTheCave is a participant in the Amazon Services LLC Associates Program, an affiliate advertising program designed to provide a means for sites to earn advertising fees by advertising and linking to Amazon.com. Amazon, the Amazon logo, AmazonSupply, and the AmazonSupply logo are trademarks of Amazon.com, Inc. or its affiliates. As an Amazon Associate we earn affiliate commissions from qualifying purchases.