
In the intricate world of finance, numbers tell a story. But raw numbers alone often lack the context needed for meaningful interpretation. This is where percentages step in, transforming absolute figures into relatable proportions and offering a universal language for comparison and analysis. From understanding the interest on a loan to calculating investment returns, budgeting your income, or deciphering business profit margins, the ability to find the percentage of two numbers is not merely an academic exercise; it’s a cornerstone of financial literacy and empowerment.
This guide will demystify the art of percentage calculation, rooting it firmly within the context of personal and business finance. We’ll explore the foundational formulas, delve into practical applications across various financial scenarios, and equip you with the insights needed to make informed decisions that impact your financial well-being.

Understanding the Essence of Percentages in Finance
At its heart, a percentage is a way of expressing a number as a fraction of 100. The term “percent” literally means “per one hundred.” This standardized approach allows us to compare different quantities in a consistent and easily understandable manner, regardless of their original scale. In finance, this power of comparison is invaluable.
What is a Percentage and Why Does it Matter?
Imagine you’re comparing the performance of two different investments. One returned $500 on an initial investment of $5,000, while another returned $700 on an initial investment of $10,000. Which performed better? Without percentages, it’s not immediately clear. The second investment yielded more absolute dollars, but it also required a larger initial capital.
By converting these figures into percentages, the picture becomes clear:
- Investment 1: ($500 / $5,000) * 100 = 10% return
- Investment 2: ($700 / $10,000) * 100 = 7% return
Suddenly, the first investment, despite yielding fewer absolute dollars, delivered a superior percentage return. This simple example highlights why percentages are indispensable in finance: they provide context, enable fair comparisons, and reveal the true proportional impact of financial events, whether it’s growth, decline, or allocation.
The Foundational Formula: Part Over Whole
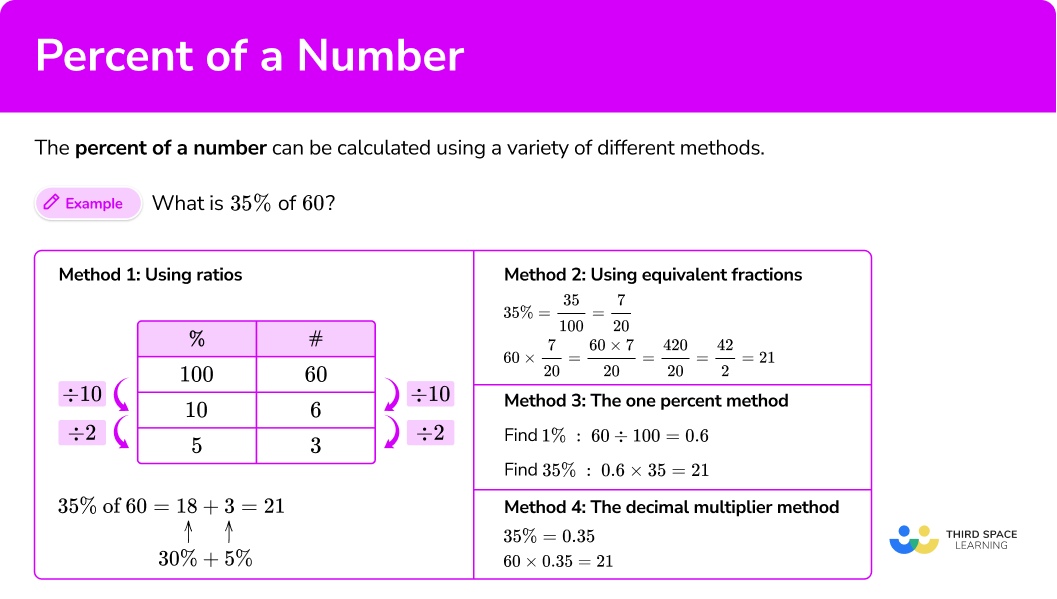
The basic principle behind finding the percentage of two numbers is straightforward: you’re determining what proportion one number (the “part”) represents of another number (the “whole” or “total”). The universal formula is:
$$ text{Percentage} = left( frac{text{Part}}{text{Whole}} right) times 100 $$
Let’s break down the components:
- Part: This is the specific amount or portion you are interested in.
- Whole: This is the total amount or the reference value against which the “part” is being compared.
- Multiply by 100: This step converts the resulting decimal or fraction into a percentage, making it easy to read and understand (e.g., 0.25 becomes 25%).
Example: If you spent $300 on groceries from a total monthly income of $3,000, what percentage of your income went to groceries?
- Part = $300 (groceries)
- Whole = $3,000 (total income)
- Percentage = ($300 / $3,000) * 100 = 0.10 * 100 = 10%
Thus, 10% of your income was allocated to groceries.
Mastering this fundamental formula is the gateway to unlocking deeper financial insights and calculations.
Practical Applications: Calculating Basic Financial Percentages
The basic percentage formula finds ubiquitous application in everyday financial scenarios, helping individuals and businesses make sense of costs, revenues, and obligations.
Discounts, Markups, and Sales Tax
Discounts: When you see a “20% off” sign, you’re looking at a percentage discount. To calculate the actual savings and final price, you’d apply the percentage to the original price.
Example: A shirt originally costs $50 and is discounted by 20%.
- Discount amount = 20% of $50 = (20/100) * $50 = $10
- Final price = $50 – $10 = $40
Markups: Businesses use markups to determine their selling price based on their cost, ensuring profitability.
Example: A retailer buys a product for $25 and applies a 40% markup.
- Markup amount = 40% of $25 = (40/100) * $25 = $10
- Selling price = $25 + $10 = $35
Sales Tax: Sales tax is a percentage added to the price of goods and services.
Example: An item costs $100, and the sales tax is 7%.
- Tax amount = 7% of $100 = (7/100) * $100 = $7
- Total cost = $100 + $7 = $107
Tipping and Service Charges: Calculating Fair Compensation
In service industries, tipping is a common practice, often calculated as a percentage of the total bill.
Example: Your restaurant bill is $65, and you want to leave a 15% tip.
- Tip amount = 15% of $65 = (15/100) * $65 = $9.75
- Total paid = $65 + $9.75 = $74.75
Similarly, some establishments include a service charge, which is a fixed percentage, ensuring fair compensation for staff.
Understanding Interest Rates on Loans and Savings
Interest rates are perhaps one of the most significant financial percentages, impacting everything from mortgages and credit cards to savings accounts and investments. They represent the cost of borrowing or the return on saving money, expressed as a percentage of the principal amount.
Example: Loan Interest: You borrow $1,000 at an annual interest rate of 5%.
- Annual interest = 5% of $1,000 = (5/100) * $1,000 = $50
This means you would owe an additional $50 in interest for that year.
Example: Savings Account Interest: You have $5,000 in a savings account earning 0.5% annual interest.
- Annual interest earned = 0.5% of $5,000 = (0.5/100) * $5,000 = $25
Your money grows by $25 over the year.
Understanding how to calculate these basic percentages allows you to accurately assess the true cost of credit and the real growth of your savings.
Analyzing Change: Percentage Increase and Decrease
Beyond calculating simple proportions, percentages are powerful tools for measuring change over time. Whether it’s the growth of an investment, the inflation rate, or a change in your salary, percentage increase and decrease provide a clear, standardized way to quantify these shifts.
Measuring Growth: Investment Returns and Salary Increases
When evaluating financial performance or planning for the future, understanding growth rates is essential.
Investment Returns:
To calculate the percentage increase in an investment, you need the initial value (old value) and the current value (new value).
Formula for Percentage Increase:
$$ text{Percentage Increase} = left( frac{text{New Value} – text{Old Value}}{text{Old Value}} right) times 100 $$
Example: You bought shares for $1,000, and they are now worth $1,250.
- New Value = $1,250
- Old Value = $1,000
- Percentage Increase = (($1,250 – $1,000) / $1,000) * 100 = ($250 / $1,000) * 100 = 0.25 * 100 = 25%
Your investment grew by 25%.
Salary Increases:
Example: Your annual salary increased from $50,000 to $53,000.
- Percentage Increase = (($53,000 – $50,000) / $50,000) * 100 = ($3,000 / $50,000) * 100 = 0.06 * 100 = 6%
Your salary increased by 6%.
Assessing Decline: Depreciation, Market Dips, and Budget Cuts
Just as percentages measure growth, they also effectively quantify decline, which is equally crucial for financial analysis and risk management.
Formula for Percentage Decrease:
$$ text{Percentage Decrease} = left( frac{text{Old Value} – text{New Value}}{text{Old Value}} right) times 100 $$
(Note: The numerator is Old Value minus New Value to ensure a positive result for decrease, indicating the magnitude of the reduction).
Example: Market Dip: An asset you own was valued at $800 but is now worth $640 due to a market correction.
- Old Value = $800
- New Value = $640
- Percentage Decrease = (($800 – $640) / $800) * 100 = ($160 / $800) * 100 = 0.20 * 100 = 20%
Your asset’s value decreased by 20%.
Example: Budget Cuts: A department’s budget was $150,000 and was cut to $135,000.
- Percentage Decrease = (($150,000 – $135,000) / $150,000) * 100 = ($15,000 / $150,000) * 100 = 0.10 * 100 = 10%
The budget was cut by 10%.
The Formula for Percentage Change: Tracking Financial Evolution
For situations where you simply want to express any change (increase or decrease) as a percentage without needing to specify the direction in the formula itself, you can use a more general “percentage change” formula, which will yield a positive result for an increase and a negative result for a decrease.
$$ text{Percentage Change} = left( frac{text{New Value} – text{Old Value}}{text{Old Value}} right) times 100 $$
If the result is positive, it’s an increase; if negative, it’s a decrease. This single formula streamlines analysis when comparing various financial metrics that might fluctuate in either direction.
Percentages in Strategic Financial Planning
Beyond individual transactions, percentages form the backbone of strategic financial planning for both personal wealth management and business operations. They enable goal setting, performance evaluation, and risk mitigation.
Budgeting and Expense Allocation: The 50/30/20 Rule and Beyond
Budgeting is fundamentally about allocating percentages of your income to different categories. A popular guideline is the “50/30/20 rule”:
- 50% for Needs: Housing, utilities, groceries, transportation, insurance.
- 30% for Wants: Dining out, entertainment, hobbies, vacations.
- 20% for Savings & Debt Repayment: Emergency fund, retirement, investments, paying off high-interest debt.
By using percentages, you can create a flexible budget that adapts to your income level. If your income increases, the absolute dollar amounts for each category increase proportionally, but the percentage allocation remains consistent with your financial priorities. This makes budgeting scalable and sustainable.
Investment Portfolio Diversification and Risk Management
For investors, percentages are critical for portfolio allocation – deciding what proportion of your capital to invest in different asset classes (e.g., stocks, bonds, real estate). Diversification strategies often recommend specific percentage breakdowns to manage risk. For example, a common rule of thumb might suggest your bond allocation should be roughly your age in percentage (e.g., 40% bonds for a 40-year-old), with the remainder in stocks.
Understanding the percentage composition of your portfolio allows you to:
- Assess risk: A higher percentage in volatile assets generally means higher risk.
- Rebalance: If one asset class grows significantly, its percentage in your portfolio might exceed your target, prompting you to sell some and reinvest to restore your desired percentages.
- Track performance: Easily compare the percentage returns of different assets or fund managers.
Decoding Financial Statements: Profit Margins and Performance Metrics
In business finance, percentages are vital for analyzing the health and performance of a company. Key metrics expressed as percentages include:
- Gross Profit Margin: (Gross Profit / Revenue) * 100. This shows the percentage of revenue left after deducting the cost of goods sold. A higher percentage indicates better efficiency in production.
- Net Profit Margin: (Net Profit / Revenue) * 100. This indicates the percentage of revenue remaining after all expenses, including taxes, have been deducted. It’s a key indicator of overall profitability.
- Operating Margin: (Operating Income / Revenue) * 100. Shows the profitability of a company’s core operations.
- Return on Investment (ROI): ((Gain from Investment – Cost of Investment) / Cost of Investment) * 100. This universal metric applies to virtually any investment, indicating its efficiency.
These percentage-based metrics allow business owners, investors, and analysts to benchmark a company’s performance against industry averages, competitors, and its own historical data, providing deep insights into operational efficiency, cost control, and overall financial strength.
Common Pitfalls and Empowering Your Financial Calculations
While the underlying math for percentages is straightforward, misinterpretations and errors often arise from a lack of clarity regarding the “whole” or the context of the calculation.
Identifying the Correct “Whole” in Complex Scenarios
One of the most common mistakes is incorrectly identifying the “whole” or the base number against which the percentage is being calculated.
Example: If an item increased in price from $100 to $120, that’s a 20% increase ($20/$100). If it then decreases by 20%, what is the final price?
- A common error is to assume it goes back to $100.
- However, the 20% decrease is applied to the new price of $120 (the new “whole”).
- 20% of $120 = $24
- Final price = $120 – $24 = $96.
This highlights the importance of always being clear about the base from which a percentage is being derived, especially when dealing with sequential percentage changes.
Leveraging Tools: Calculators, Spreadsheets, and Online Resources
While understanding the manual calculation is essential, you don’t always need to do it by hand. Modern financial life benefits greatly from leveraging tools:
- Basic Calculators: Most calculators have a dedicated percentage button (%). Learn how your calculator’s percentage function works, as its operation can vary slightly.
- Spreadsheets (Excel, Google Sheets): These are incredibly powerful for financial calculations. You can input formulas (e.g.,
= (A2/B2)*100) to quickly calculate percentages for large datasets, track budgets, and project financial scenarios. - Online Percentage Calculators: Numerous websites offer free, easy-to-use percentage calculators for various scenarios (e.g., “what is X percent of Y,” “X is what percent of Y,” “percentage increase/decrease”).
- Financial Apps: Many budgeting, investing, and banking apps integrate percentage calculations directly, helping you visualize your financial situation.
These tools should be seen as enablers, not substitutes for understanding. Knowing how to find the percentage of two numbers means you can verify the results and understand the implications, even when a machine does the heavy lifting.

Cultivating Financial Literacy Through Percentage Mastery
Ultimately, mastering percentages is more than just learning a formula; it’s about developing a critical financial mindset. It allows you to:
- Question financial claims: Is that “incredible return” truly impressive after accounting for inflation or fees?
- Evaluate opportunities: Which loan offer is genuinely cheaper? Which investment is truly yielding more?
- Plan effectively: How much do I need to save each month to reach my goals? What percentage of my income can I afford for discretionary spending?
- Understand economic news: Inflation rates, GDP growth, unemployment figures—all are presented as percentages, impacting your financial future.
By diligently practicing and applying these concepts, you transform raw numbers into actionable insights, moving from merely observing your finances to actively controlling and optimizing them. The ability to find the percentage of two numbers is not just a mathematical skill; it’s a vital tool for navigating the complexities of the financial world with confidence and intelligence.
aViewFromTheCave is a participant in the Amazon Services LLC Associates Program, an affiliate advertising program designed to provide a means for sites to earn advertising fees by advertising and linking to Amazon.com. Amazon, the Amazon logo, AmazonSupply, and the AmazonSupply logo are trademarks of Amazon.com, Inc. or its affiliates. As an Amazon Associate we earn affiliate commissions from qualifying purchases.