In the intricate world of finance, numbers tell a story – but percentages provide the crucial context. Whether you’re a seasoned investor evaluating portfolio performance, a small business owner analyzing profit margins, or an individual crafting a household budget, the ability to find a percentage between two numbers is not just a mathematical trick; it’s a fundamental skill that underpins sound financial decision-making. Percentages transform raw figures into relatable metrics, allowing for comparisons, growth assessments, and a clear understanding of proportional relationships.
This comprehensive guide will demystify the process of calculating percentages, moving beyond simple arithmetic to explore its profound implications across personal finance, investing, and business operations. We’ll break down the core methodologies, illustrate their real-world applications, and empower you to leverage this essential skill for greater financial clarity and control.

Understanding the Foundation: What is a Percentage and Why It Matters in Finance?
At its heart, a percentage is simply a way to express a part of a whole as a fraction of 100. The term “percent” literally means “per hundred” or “out of 100.” Instead of saying “half of,” we say “50%”; instead of “one-quarter of,” we say “25%.” This standardization to a base of 100 makes comparing different quantities straightforward, regardless of their original magnitudes.
The Concept of Proportion and Relative Value
In finance, absolute numbers can often be misleading. A profit of $10,000 might sound good, but if it’s from a $1,000,000 investment, it’s far less impressive than a $10,000 profit from a $50,000 investment. Percentages provide relative value, allowing us to understand the proportion of a change or a component relative to its total. This proportional understanding is vital for:
- Comparing performance: Which investment yielded a better return?
- Assessing impact: How much did that discount actually save me?
- Setting goals: What percentage of my income should I save?
- Analyzing trends: Is revenue growing at a sustainable rate?
Without percentages, financial analysis would be a cumbersome task of comparing raw figures, often leading to skewed interpretations and poor strategic choices.
Everyday Financial Scenarios Where Percentages Reign
From the moment you check your bank balance to making a major investment, percentages are silently at work, shaping your financial reality:
- Interest Rates: Whether on savings accounts, loans, or credit cards, interest is almost always expressed as an annual percentage rate (APR).
- Discounts and Sales: Black Friday deals, clearance sales – all expressed as a percentage off the original price.
- Taxes: Income tax, sales tax, property tax – these are percentage-based calculations on your earnings or purchases.
- Budgeting: Allocating a percentage of your income to housing, food, savings, and entertainment is a common and effective budgeting strategy.
- Investment Returns: The success of your investments is measured by the percentage return on your initial capital.
- Inflation: The eroding power of inflation is measured as a percentage increase in the cost of goods and services.
These examples underscore that mastering percentage calculations is not an academic exercise but a practical necessity for navigating the modern financial landscape.
The Core Calculation: Step-by-Step Method for Finding Percentages
While the applications of percentages are vast, the underlying calculations are surprisingly simple. There are a few fundamental scenarios you’ll encounter, each with a straightforward formula.
Basic Percentage Calculation: Part Over Whole
This is the most common use case: finding what percentage one number (the “part”) is of another number (the “whole”).
Formula: (Part / Whole) * 100
Example: You spent $300 on groceries this month, and your total monthly budget is $2,000. What percentage of your budget went to groceries?
- Identify the Part: $300 (groceries)
- Identify the Whole: $2,000 (total budget)
- Divide Part by Whole: $300 / $2,000 = 0.15
- Multiply by 100: 0.15 * 100 = 15%
Result: 15% of your budget went to groceries. This simple calculation immediately gives you insight into your spending habits relative to your overall financial plan.
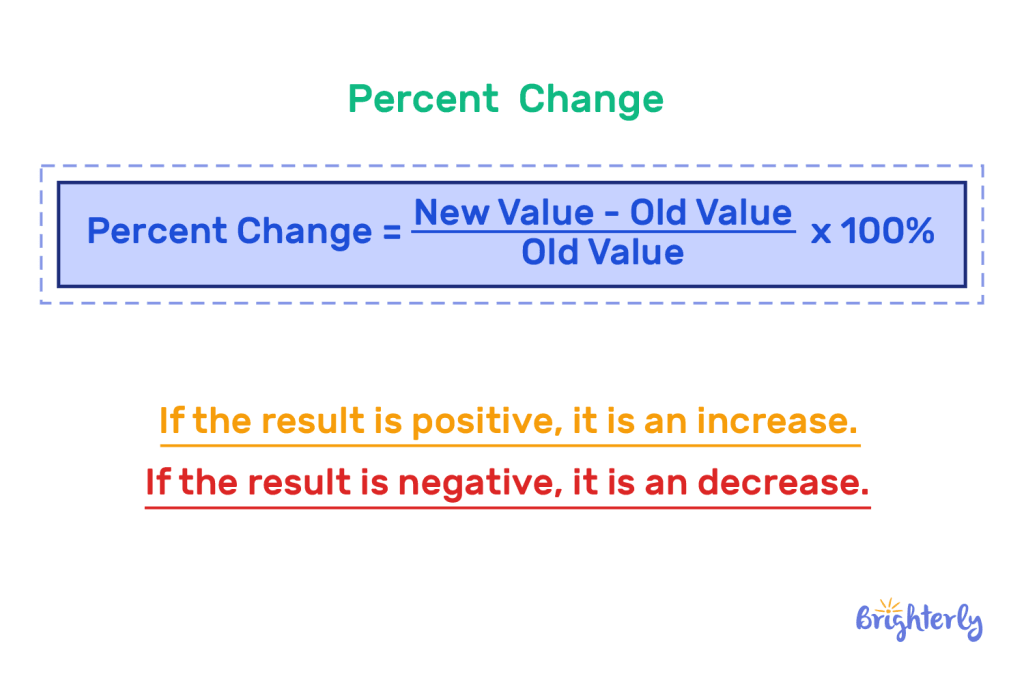
Percentage Change: Measuring Growth and Decline
When tracking financial metrics over time, you often need to understand the percentage increase or decrease. This is crucial for evaluating growth, performance, or price fluctuations.
Formula: ((New Value - Old Value) / Old Value) * 100
Example (Percentage Increase): Your stock investment was worth $5,000 last year and is now worth $6,500. What is the percentage increase?
- Identify Old Value: $5,000
- Identify New Value: $6,500
- Calculate the Difference: $6,500 – $5,000 = $1,500
- Divide by Old Value: $1,500 / $5,000 = 0.30
- Multiply by 100: 0.30 * 100 = 30%
Result: Your investment saw a 30% increase.
Example (Percentage Decrease): Your car’s value dropped from $20,000 last year to $16,000 this year. What is the percentage decrease?
- Identify Old Value: $20,000
- Identify New Value: $16,000
- Calculate the Difference: $16,000 – $20,000 = -$4,000 (Note the negative sign indicating a decrease)
- Divide by Old Value: -$4,000 / $20,000 = -0.20
- Multiply by 100: -0.20 * 100 = -20%
Result: Your car’s value decreased by 20%. The negative sign often implies “decrease” or “reduction” in financial contexts.
Finding a Number When a Percentage is Known (Reverse Calculation)
Sometimes you know the percentage and the “whole” and need to find the “part,” or you know the percentage and the “part” and need to find the “whole.”
Scenario 1: Finding the Part (e.g., calculating a discount amount)
Formula: (Percentage / 100) * Whole
Example: You see a laptop priced at $1,200 with a 25% discount. How much is the discount in dollars?
- Identify Percentage: 25%
- Identify Whole: $1,200
- Convert Percentage to Decimal: 25 / 100 = 0.25
- Multiply by Whole: 0.25 * $1,200 = $300
Result: The discount is $300. You’d pay $1,200 – $300 = $900.
Scenario 2: Finding the Whole (e.g., calculating original price before tax)
Formula: Part / (Percentage / 100)
Example: You paid $50 in sales tax, which is 8% of the item’s original price. What was the original price of the item?
- Identify Part: $50 (sales tax)
- Identify Percentage: 8%
- Convert Percentage to Decimal: 8 / 100 = 0.08
- Divide Part by Decimal: $50 / 0.08 = $625
Result: The original price of the item was $625.
Real-World Financial Applications: Beyond Basic Arithmetic
The true power of percentages emerges when applied to complex financial scenarios. They are the language of financial reporting, market analysis, and strategic planning.
Personal Finance: Budgeting, Savings, and Debt Management
For individuals, percentages are indispensable tools for managing money effectively:
- Budget Allocation: The 50/30/20 rule (50% needs, 30% wants, 20% savings/debt) is a prime example of percentage-based budgeting. By calculating the percentage of your income for each category, you gain a clear picture of your financial health.
- Savings Goals: If you want to save $10,000 in a year and your current income allows for a 15% savings rate, you can easily calculate how much you need to earn or cut expenses.
- Debt-to-Income Ratio (DTI): Lenders use DTI (total monthly debt payments as a percentage of gross monthly income) to assess your ability to manage debt. A lower percentage indicates less risk.
- Retirement Planning: Understanding contribution percentages to 401(k)s or IRAs, and projected returns, is critical for long-term wealth building.
Investing: ROI, Yields, and Portfolio Performance
In the world of investments, percentages are the primary metric for success and risk assessment:
- Return on Investment (ROI): Measures the profitability of an investment relative to its cost.
ROI = ((Current Value - Cost of Investment) / Cost of Investment) * 100. A high ROI is the ultimate goal. - Dividend Yield: For income-generating stocks, the dividend yield (annual dividends per share as a percentage of the stock’s price) indicates the income generated relative to the stock’s cost.
- Portfolio Diversification: Investors allocate percentages of their portfolio to different asset classes (e.g., 60% stocks, 30% bonds, 10% cash) to manage risk and optimize returns.
- Market Share Growth: When evaluating companies, their percentage growth in market share indicates their competitive position and expansion.
Business Finance: Profit Margins, Discounts, and Sales Growth
Businesses rely heavily on percentages for operational analysis, pricing strategies, and performance reporting:
- Gross Profit Margin:
((Revenue - Cost of Goods Sold) / Revenue) * 100. This percentage shows how much profit a company makes from each sale after accounting for direct costs. - Net Profit Margin:
((Net Income / Revenue) * 100). This more comprehensive margin reflects the percentage of revenue left after all expenses, including taxes. - Discount Strategies: Businesses use percentage-based discounts to clear inventory, attract customers, or run promotions. Calculating the impact of these discounts on overall revenue requires percentage mastery.
- Sales Growth Rate:
((Current Period Sales - Prior Period Sales) / Prior Period Sales) * 100. This metric is crucial for understanding business expansion and forecasting future performance. - Expense Ratios: Analyzing expenses as a percentage of revenue helps businesses identify areas for cost reduction and operational efficiency.
Leveraging Financial Tools for Accuracy and Efficiency
While manual calculation is essential for understanding the underlying principles, modern financial management benefits immensely from digital tools that automate and simplify percentage calculations.
The Power of Spreadsheets (Excel, Google Sheets)
Spreadsheet software like Microsoft Excel or Google Sheets are indispensable financial tools. They allow you to:
- Automate Calculations: Input formulas once, and the spreadsheet automatically updates results as numbers change.
- Organize Data: Track multiple financial metrics, budgets, or investment portfolios in one place.
- Visualize Trends: Create charts and graphs to visualize percentage growth, allocation, or change over time, offering deeper insights.
- Scenario Planning: Easily adjust variables to see the percentage impact of different financial decisions (e.g., what if I save 25% instead of 15%?).
Familiarity with basic spreadsheet functions for percentages (e.g., (A2/B2)*100 for basic percentage, or ((B2-A2)/A2)*100 for percentage change) is a powerful asset.
Online Calculators and Financial Apps
For quick, on-the-go calculations, online percentage calculators and dedicated financial apps are incredibly convenient. Many banking apps, budgeting tools, and investment platforms include built-in calculators for:
- Loan amortization: Calculating monthly payments and interest percentages.
- Mortgage payments: Understanding the breakdown of principal and interest.
- Tip calculators: Quickly determining a percentage tip.
- Budgeting apps: Automatically categorizing expenses and showing percentage allocation.
While useful, always ensure you understand the underlying calculation being performed by these tools to avoid blindly trusting potentially incorrect results or misinterpreting the output.
Avoiding Common Percentage Pitfalls
Even with tools, misinterpretations can occur. Be mindful of:
- “Percentage points” vs. “Percentage change”: If an interest rate goes from 5% to 7%, that’s a 2 percentage point increase, but a 40% percentage increase ( (7-5)/5 * 100). The distinction is crucial.
- Base value: Always be clear about the “whole” or “old value” you are using as the base for your calculation. An incorrect base will lead to an incorrect percentage.
- Averages of percentages: You generally cannot simply average percentages directly if the bases are different. For instance, if one investment grew 10% on $100 and another grew 50% on $10, the overall growth isn’t (10%+50%)/2. You must calculate the overall dollar change and then the overall percentage change based on the total initial investment.

Conclusion
The ability to find a percentage between two numbers is far more than a basic math lesson; it is a critical skill for financial literacy and empowerment. From understanding your personal budget and evaluating investment performance to analyzing business profitability and navigating complex economic indicators, percentages provide clarity, context, and the power to make informed decisions. By mastering the core formulas and applying them thoughtfully to real-world financial scenarios, you unlock a deeper understanding of money and gain greater control over your financial future. Embrace percentages, and transform raw numbers into meaningful insights that drive success.
aViewFromTheCave is a participant in the Amazon Services LLC Associates Program, an affiliate advertising program designed to provide a means for sites to earn advertising fees by advertising and linking to Amazon.com. Amazon, the Amazon logo, AmazonSupply, and the AmazonSupply logo are trademarks of Amazon.com, Inc. or its affiliates. As an Amazon Associate we earn affiliate commissions from qualifying purchases.