In the world of finance, numbers are the language of progress, but not all movements are upward. Whether you are an individual investor tracking a portfolio dip, a business owner measuring cost-cutting success, or a consumer analyzing the impact of inflation on your purchasing power, understanding how to find percent decrease is an essential skill. While the mathematical formula is straightforward, its implications in personal and corporate finance are profound. Percent decrease serves as a vital metric for assessing risk, evaluating performance, and making informed strategic decisions.

Understanding the Mechanics: The Percent Decrease Formula
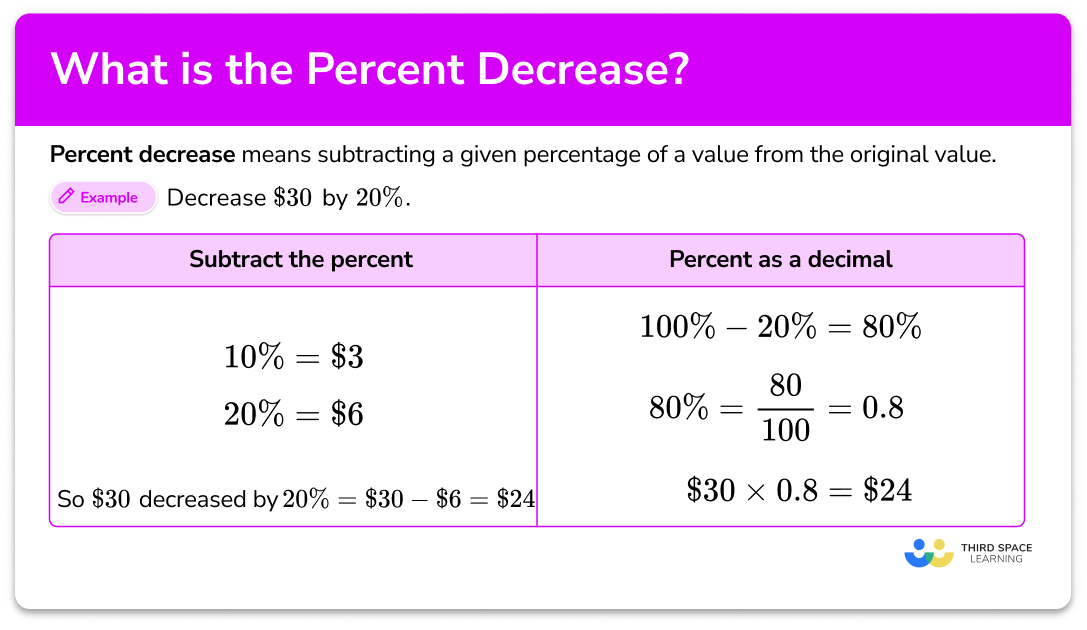
Before diving into complex financial scenarios, one must master the fundamental calculation. Percent decrease measures the relationship between an original value and a lower new value, expressed as a portion of the original amount.
The Standard Formula
To find the percent decrease, you follow a three-step mathematical process:
- Subtract the new value from the original value to find the “absolute decrease.”
- Divide that absolute decrease by the original value.
- Multiply the resulting decimal by 100 to convert it into a percentage.
Mathematically, it looks like this:
((Original Value – New Value) / Original Value) × 100 = Percent Decrease
A Practical Example in Budgeting
Imagine a household that spent $1,200 on utilities in January. After implementing energy-saving measures, the bill dropped to $900 in February. To find the percent decrease:
- Absolute Decrease: $1,200 – $900 = $300.
- Division: $300 / $1,200 = 0.25.
- Percentage: 0.25 × 100 = 25%.
In this scenario, the household achieved a 25% reduction in utility costs. In a financial context, this percentage is far more descriptive than the raw dollar amount because it allows for a standardized comparison across different categories or time periods.
Percent Decrease in Investing: Analyzing Market Volatility
For investors, the percent decrease—often referred to as a “drawdown” or “loss”—is a primary indicator of risk and volatility. Understanding how to calculate and interpret these drops is critical for maintaining a balanced portfolio and managing emotional responses to market fluctuations.
Evaluating Stock Performance
When a stock price falls, the percent decrease tells an investor how much of their principal value has been eroded. For instance, if a high-growth tech stock falls from $250 per share to $190, the percent decrease is 24%. While a $60 drop might seem significant, its impact is relative to the starting price. A $60 drop on a $1,000 stock is only 6%, whereas on a $100 stock, it is a staggering 60%. Percentages provide the necessary context to gauge the severity of a market correction.
Portfolio Rebalancing and Risk Management
Financial advisors use percent decrease to trigger specific actions, such as “stop-loss” orders or rebalancing. If an asset class (like international equities) experiences a 10% decrease, it may fall below its target allocation in a diversified portfolio. By calculating this decrease, an investor knows exactly how much capital must be shifted from outperforming assets to underperforming ones to maintain a desired risk profile. This disciplined approach—buying low after a percent decrease—is a cornerstone of long-term wealth accumulation.
Understanding Drawdowns
In the context of hedge funds and professional trading, a “maximum drawdown” is the peak-to-trough percent decrease during a specific period. It measures the “pain” an investor would have felt if they bought at the absolute high and sold at the absolute low. Analyzing historical percent decreases helps investors choose assets that align with their risk tolerance; a conservative investor may avoid assets that historically show frequent 30% decreases, even if the long-term returns are high.
Business Finance: Using Percent Decrease to Drive Efficiency
In a corporate environment, a percent decrease isn’t always a negative sign. In fact, many Chief Financial Officers (CFOs) spend their entire careers looking for ways to maximize percent decreases in specific areas, such as overhead, waste, and debt.

Cost Reduction and Operational Efficiency
Companies often set “Percentage Reduction Targets” for their departments. If a manufacturing firm reduces its scrap rate (material wasted during production) from 8% to 5%, they have achieved a 37.5% decrease in waste. This calculation is vital for internal reporting. It proves to stakeholders that operational refinements are working, regardless of the company’s total scale.
Debt Management and Interest Expense
For a business carrying significant debt, reducing the interest rate through refinancing is a major financial win. If a company moves from a 7% interest rate to a 5% interest rate, they haven’t just saved 2 percentage points; they have achieved an approximate 28.6% decrease in their cost of capital. This percent decrease directly impacts the bottom line, freeing up cash flow for reinvestment or dividends.
Revenue Contraction and Market Share
Conversely, tracking percent decrease in revenue or market share is a “red flag” metric. A 5% decrease in year-over-year revenue might be manageable, but a 20% decrease suggests a fundamental shift in consumer behavior or increased competition. By converting raw sales data into percentages, executives can compare the performance of different regional branches, even if those branches have vastly different total sales volumes.
Personal Finance: Purchasing Power and Debt Reduction
At the individual level, the ability to calculate percent decrease helps in navigating the complexities of the modern economy, from understanding the “real” value of money to aggressively paying down liabilities.
The Impact of Inflation on Purchasing Power
While inflation is an increase in prices, it results in a percent decrease in the purchasing power of your currency. If inflation is 5%, your $100 buys what $95 would have bought previously. By calculating the percent decrease in what your savings can actually purchase, you can better understand why a “safe” 1% interest savings account might actually be losing you value in real terms. This realization often encourages individuals to move from cash into assets like stocks or real estate.
Debt Snowball and Motivation
When paying off credit cards or student loans, tracking the percent decrease of the principal balance can be a powerful psychological tool. Seeing a balance go from $10,000 to $8,000 is a 20% decrease. For many, seeing the “percentage remaining” shrink is more motivating than looking at the dollar amount alone. It provides a sense of momentum and a clear roadmap toward financial freedom.
Negotiating Salaries and Expenses
Understanding percent decrease is also a tactical advantage in negotiations. If a service provider raises your monthly fee, you can calculate the percent increase they are asking for and counter-offer by requesting a specific percent decrease based on competitor pricing. Being able to speak in percentages shows financial literacy and often leads to better outcomes in professional and personal negotiations.
The Asymmetry of Loss: Why Percent Decrease Matters More
One of the most critical lessons in finance is the mathematical asymmetry between percent decrease and percent increase. This is often referred to as the “Recovery Math,” and it is the reason why preventing large decreases is more important than chasing large increases.
The Math of Recovery
If you have $100 and you experience a 10% decrease, you have $90. To get back to $100, you need a 11.1% increase.
However, as the percent decrease grows, the required increase grows exponentially:
- A 20% decrease requires a 25% increase to break even.
- A 50% decrease requires a 100% increase to break even.
- A 90% decrease requires a 900% increase to break even.
Strategic Implications
This mathematical reality is why wealth managers focus so heavily on “downside protection.” A portfolio that never experiences a 50% decrease will often outperform a highly volatile portfolio over the long term, even if the volatile portfolio has higher “up” years. By understanding how to find and analyze percent decrease, you can identify high-risk investments that might require impossible recovery gains.
Conclusion: Mastery of the Metric
Finding the percent decrease is a simple arithmetic task, but its application is a sophisticated financial tool. In the context of money—whether it is personal, corporate, or market-driven—the percent decrease is a window into the health and efficiency of an economic entity.
By consistently applying the formula—(Original – New) / Original—investors can better navigate market cycles, business owners can tighten operations, and individuals can protect their wealth from the silent erosion of inflation. In the grand ledger of financial life, knowing how much you have lost, or how much you have saved, is the first step toward strategically gaining more. Mastery of this metric ensures that you are not just watching numbers change, but are actively interpreting the story they tell about your financial future.
aViewFromTheCave is a participant in the Amazon Services LLC Associates Program, an affiliate advertising program designed to provide a means for sites to earn advertising fees by advertising and linking to Amazon.com. Amazon, the Amazon logo, AmazonSupply, and the AmazonSupply logo are trademarks of Amazon.com, Inc. or its affiliates. As an Amazon Associate we earn affiliate commissions from qualifying purchases.