Understanding the true cost of living and the purchasing power of your money is paramount in navigating the complex world of personal finance, investing, and business strategy. At the heart of this understanding lies the concept of inflation, a silent but powerful force that erodes wealth over time. The primary tool economists, policymakers, and astute individuals use to measure this phenomenon is the Consumer Price Index (CPI). By mastering how to derive the inflation rate from the CPI, you gain invaluable insight into economic trends and equip yourself to make more informed financial decisions.
This article will demystify the CPI, explain its critical role in gauging inflation, and provide a clear, step-by-step guide to calculating the inflation rate. We will delve into the nuances of CPI data, discuss the broader implications of inflation, and offer practical advice on how to leverage this knowledge to safeguard and grow your financial well-being.
Understanding the Fundamentals: What are CPI and Inflation?
Before we dive into calculations, it’s essential to establish a firm grasp of the foundational concepts: the Consumer Price Index and inflation itself. These two terms are inextricably linked, with the former serving as the metric for the latter.
The Consumer Price Index (CPI): A Household Basket Snapshot
The Consumer Price Index (CPI) is a measure of the average change over time in the prices paid by urban consumers for a market basket of consumer goods and services. Compiled and published monthly by the Bureau of Labor Statistics (BLS) in the United States, or similar statistical agencies in other countries, the CPI is often referred to as a “cost of living” index.
Imagine a typical household’s shopping basket filled with everything from groceries, gasoline, and housing costs to healthcare services, apparel, and entertainment. The BLS surveys thousands of households and retail establishments nationwide to track the prices of these goods and services. Each item in the basket is weighted according to its importance in the average consumer’s budget. For instance, housing costs typically hold a much larger weight than, say, the price of a movie ticket.
The CPI is not expressed in dollar amounts but as an index number, with a specific base period set to 100. This base period allows for easy comparison of price changes over time. If the CPI rises from 100 to 110, it indicates that the cost of that basket of goods has increased by 10%. There are various CPI measures, such as CPI-U (for all urban consumers) and CPI-W (for urban wage earners and clerical workers), and even more granular regional and product-specific indices. The CPI-U is the most commonly cited and widely recognized measure.
Inflation: The Erosion of Purchasing Power
Inflation, in its simplest definition, is the rate at which the general level of prices for goods and services is rising, and consequently, the purchasing power of currency is falling. When inflation is high, your dollar buys less today than it did yesterday. Conversely, when inflation is low or even negative (deflation), your dollar buys more.
Inflation is a natural part of most modern economies, often targeted by central banks to be at a stable, low rate (e.g., around 2% annually) as it is seen as conducive to economic growth. However, uncontrolled or hyperinflation can be devastating, eroding savings, destabilizing markets, and causing widespread economic hardship. Understanding and tracking inflation is crucial for:
- Consumers: To adjust spending, saving, and borrowing habits.
- Businesses: To set prices, wages, and make investment decisions.
- Investors: To evaluate returns, allocate assets, and protect portfolios.
- Policymakers: To formulate monetary policy (e.g., interest rate adjustments) and fiscal policy.
The Core Formula: Calculating Inflation Rate from CPI
The beauty of the CPI lies in its straightforward application for calculating inflation. Once you have access to CPI data, determining the inflation rate is a simple percentage change calculation.
The Simple Calculation: Year-over-Year Percentage Change
The most common way to calculate the inflation rate is to determine the percentage change in the CPI over a specific period, typically year-over-year. This provides a clear picture of how much prices have risen in the past 12 months.
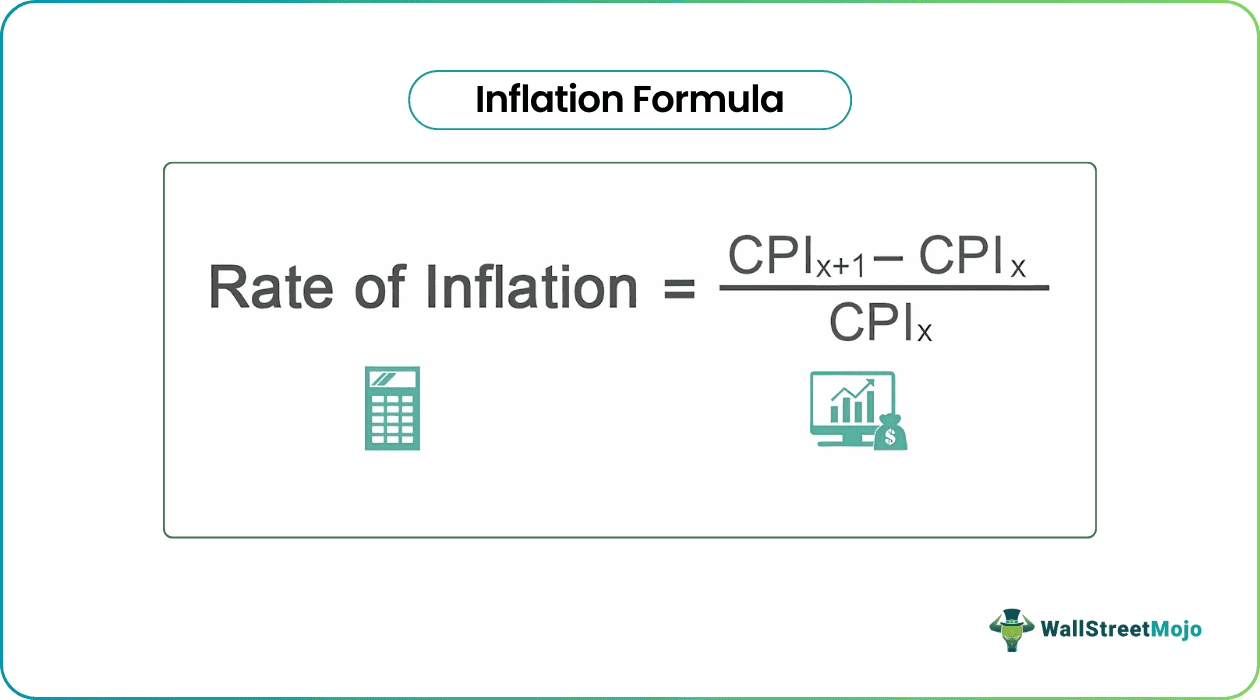
The formula is as follows:
Inflation Rate = [ (CPI in Current Period – CPI in Previous Period) / CPI in Previous Period ] * 100
Where:
- CPI in Current Period: The latest Consumer Price Index reading (e.g., for January 2024).
- CPI in Previous Period: The Consumer Price Index reading from the equivalent period a year earlier (e.g., January 2023).
Practical Steps: Sourcing CPI Data
To perform this calculation, you first need reliable CPI data. The primary source for U.S. CPI data is the Bureau of Labor Statistics (BLS) website (www.bls.gov). Here’s how to typically access it:
- Navigate to the BLS Website: Go to bls.gov.
- Find CPI Data: Look for sections related to “Prices & Spending” or “Consumer Price Index.”
- Select the Series: You’ll usually find tables with various CPI series. The most commonly used is “CPI for All Urban Consumers (CPI-U), U.S. City Average, All Items.” The series ID often starts with “CUUR0000SA0.”
- Retrieve Historical Data: The BLS provides extensive historical data, allowing you to select specific months and years. You can often generate custom tables or download data into spreadsheets.
Other reputable financial news outlets and economic data providers also republish BLS data, but always cross-reference with the official source for critical analysis.
Example Calculation: Putting Theory into Practice
Let’s walk through a hypothetical example to illustrate the calculation.
Scenario:
- CPI for All Urban Consumers (CPI-U), U.S. City Average, All Items for January 2024: 308.450
- CPI for All Urban Consumers (CPI-U), U.S. City Average, All Items for January 2023: 299.170
Calculation:
-
Subtract the previous CPI from the current CPI:
308.450 – 299.170 = 9.280 -
Divide the difference by the previous CPI:
9.280 / 299.170 ≈ 0.03102 -
Multiply by 100 to get the percentage:
0.03102 * 100 = 3.102%
Therefore, the year-over-year inflation rate from January 2023 to January 2024 is approximately 3.10%. This means that, on average, the basket of goods and services that cost $100 in January 2023 would cost roughly $103.10 in January 2024.
Nuances and Interpretations: Beyond the Basic Number
While the year-over-year CPI inflation rate is a powerful metric, a deeper understanding requires acknowledging the various nuances and interpretations associated with it. Not all inflation figures are created equal, and understanding their differences can provide a more accurate picture of economic health.

Different CPI Measures: All-Urban Consumers vs. Chained CPI
As mentioned, the CPI-U (for All Urban Consumers) is the most widely reported. However, the BLS also publishes other measures:
- CPI-W (Urban Wage Earners and Clerical Workers): This index covers a smaller population group than CPI-U, specifically those in clerical or wage-earning occupations. It’s often used for adjusting Social Security benefits and other government payments.
- Chained CPI (C-CPI-U): This measure attempts to account for consumer substitution. When the price of one good rises significantly, consumers often substitute it with a cheaper alternative (e.g., buying chicken instead of beef). The C-CPI-U, by factoring in these substitution effects, tends to show a slightly lower inflation rate over time compared to the traditional CPI-U, which uses a fixed basket of goods for a longer period. While technically more accurate in reflecting consumer behavior, it’s less commonly used for general public reporting.
For most personal finance applications, the CPI-U remains the standard reference.
Core Inflation vs. Headline Inflation
When financial news reports inflation, you’ll often hear references to “headline inflation” and “core inflation.”
- Headline Inflation: This is the overall inflation rate, encompassing the price changes of all goods and services in the CPI basket, including volatile categories like food and energy. The calculation we performed above yields the headline inflation rate.
- Core Inflation: This measure excludes the volatile food and energy components from the CPI. Food and energy prices are highly susceptible to short-term fluctuations due to factors like weather events, geopolitical tensions, and supply chain disruptions. By stripping these out, core inflation provides a clearer view of underlying, longer-term inflationary trends that are less prone to transient shocks. Central banks often pay close attention to core inflation when making monetary policy decisions, as it’s considered a better indicator of sustained price pressures.
Understanding both is crucial: headline inflation shows the immediate impact on your wallet, while core inflation hints at the more persistent inflationary pressures in the economy.
Limitations and Considerations of CPI as an Inflation Gauge
While indispensable, the CPI is not without its limitations:
- Substitution Bias: As noted with the C-CPI-U, the standard CPI-U can suffer from substitution bias because it uses a fixed basket of goods for a period. It may overstate the true cost of living increase if consumers are actively substituting away from more expensive items.
- Quality Bias: The CPI struggles to fully account for improvements in the quality of goods and services. A new smartphone might cost more than its predecessor, but it also offers significantly more features and capabilities. Simply comparing prices might overstate inflation if the increase is partly due to enhanced quality.
- New Goods Bias: It takes time for newly introduced products and services to be incorporated into the CPI basket, potentially missing initial price changes.
- Regional Variation: The “U.S. City Average” CPI may not accurately reflect the cost of living or inflation experience in specific regions or cities, where housing, transportation, and other costs can vary significantly.
- Individual Experience: The “average” market basket may not perfectly reflect your personal spending habits. If you spend disproportionately more on items experiencing high inflation (e.g., healthcare) and less on items with lower inflation (e.g., electronics), your personal inflation rate might differ from the reported CPI.
Despite these limitations, the CPI remains the best and most widely accepted proxy for measuring consumer price inflation, providing a consistent and robust framework for economic analysis.
Why This Matters: The Impact of Inflation on Your Money
The inflation rate isn’t just an abstract economic statistic; it has tangible and far-reaching effects on every aspect of your financial life. Ignoring it is akin to navigating without a compass.
Personal Finance: Budgeting and Savings
For individuals and households, inflation directly impacts purchasing power. If your wages or income do not keep pace with inflation, your real income (what your money can actually buy) decreases, even if your nominal income (the dollar amount) stays the same.
- Budgeting: Understanding current and projected inflation helps you anticipate rising costs for essentials like groceries, utilities, and housing. This allows for more realistic budgeting and adjustments to spending habits to maintain your desired lifestyle.
- Savings: Inflation erodes the value of cash and traditional savings accounts. If your savings account offers a 1% interest rate and inflation is 3%, your money is effectively losing 2% of its purchasing power each year. This underscores the importance of seeking savings and investment vehicles that at least match, if not exceed, the inflation rate.
- Debt: For borrowers, inflation can sometimes be a mixed bag. Fixed-rate debt (like a mortgage) becomes easier to pay off with inflated future dollars, as the real value of the debt decreases. However, high inflation can lead to higher interest rates on new loans, making borrowing more expensive.
Investing Strategies: Protecting Your Wealth
Investors must constantly consider inflation when constructing and managing their portfolios.
- Real Returns: The true return on an investment is its nominal return minus the inflation rate. A stock that gains 8% in a year when inflation is 3% provides a real return of 5%. If inflation is 6%, the real return is only 2%.
- Asset Allocation: Certain assets tend to perform better during inflationary periods than others. Historically, real assets like real estate, commodities (e.g., gold, oil), and inflation-protected securities (TIPS – Treasury Inflation-Protected Securities) can offer some hedge against rising prices. Equities can also perform well if companies can pass on higher costs to consumers. Fixed-income investments like bonds can be particularly vulnerable to inflation, as their fixed interest payments lose purchasing power.
- Long-Term Planning: For long-term goals like retirement, accounting for inflation is critical. The amount of money you think you’ll need in retirement decades from now must be adjusted significantly upwards to account for the erosion of purchasing power.
Economic Implications: Policy and Market Reactions
Beyond individual finances, inflation data heavily influences macroeconomic policy and market dynamics.
- Monetary Policy: Central banks, like the Federal Reserve in the U.S., closely monitor inflation to guide their monetary policy decisions. If inflation rises too high, central banks may raise interest rates to cool down the economy and curb price increases. Conversely, if inflation is too low, they might lower rates to stimulate economic activity.
- Wage Negotiations: Inflation data plays a significant role in wage negotiations and cost-of-living adjustments (COLAs) for salaries, pensions, and government benefits.
- Market Volatility: Unexpected spikes or drops in inflation can lead to significant volatility in stock, bond, and currency markets as investors react to potential shifts in economic policy and corporate earnings.
Leveraging Inflation Data: Informed Financial Decisions
Now that you understand what CPI is, how to calculate inflation from it, and its profound impacts, the final step is to actively use this knowledge to your advantage. Financial literacy is about application, not just accumulation of facts.
Monitoring Trends and Forecasts
Regularly check the latest CPI reports and inflation forecasts from reputable sources (BLS, Federal Reserve, major financial institutions). Don’t just look at the headline number; delve into the components to understand what’s driving the changes. Are food prices surging? Is housing cooling down? Are energy costs volatile? This granular information can inform your personal spending and investment outlook.
Adapting Financial Plans
Your financial plan should not be static. It needs to be a living document that adapts to economic realities, particularly inflation.
- Revisit Your Budget: If inflation is consistently above your income growth, you may need to adjust discretionary spending or look for ways to increase income.
- Review Your Investments: Assess whether your portfolio is adequately diversified to withstand inflationary pressures. Consider assets that traditionally perform well during such times. Ensure your expected returns are real returns, after accounting for inflation.
- Adjust Retirement Goals: Recalculate your future financial needs for retirement, factoring in an assumed average inflation rate over the coming decades. This will help ensure you’re saving enough.
- Evaluate Debt Strategy: In a high-inflation environment, paying down high-interest variable-rate debt becomes even more critical, as interest costs can rise.

Resources for Staying Informed
Beyond the BLS, many resources can help you stay informed:
- Federal Reserve Publications: The Fed provides research and commentary on inflation.
- Reputable Financial News Outlets: Major financial news organizations offer in-depth analysis of inflation reports.
- Economic Research Firms: Many firms publish detailed reports and forecasts on inflation and its drivers.
- Financial Advisors: A good financial advisor can help you interpret inflation data and tailor your financial strategy accordingly.
In conclusion, the ability to find and interpret the inflation rate from the Consumer Price Index is a fundamental skill for anyone serious about managing their money effectively. It moves you from being a passive observer of economic tides to an active participant, capable of making strategic adjustments that protect and enhance your financial future. By staying informed, understanding the numbers, and proactively adapting your financial strategies, you can navigate the complexities of inflation and build lasting wealth.
aViewFromTheCave is a participant in the Amazon Services LLC Associates Program, an affiliate advertising program designed to provide a means for sites to earn advertising fees by advertising and linking to Amazon.com. Amazon, the Amazon logo, AmazonSupply, and the AmazonSupply logo are trademarks of Amazon.com, Inc. or its affiliates. As an Amazon Associate we earn affiliate commissions from qualifying purchases.