In the realm of finance, numbers are the language of progress. Whether you are tracking the growth of a retirement portfolio, analyzing a company’s quarterly revenue, or managing a household budget, understanding how to calculate and interpret the percent change between two numbers is a fundamental skill. While raw numbers provide scale, percentages provide context. They allow investors and business leaders to compare performance across different timeframes, industries, and asset classes on a level playing field.
Calculating a percent change is more than a simple mathematical exercise; it is a diagnostic tool that reveals the velocity of wealth accumulation or the severity of a financial loss. In this comprehensive guide, we will explore the mechanics of finding percent change, its critical applications in investment strategy, and how to use this metric to make more informed financial decisions.

The Mathematical Foundation of Financial Growth
Before diving into complex market analysis, one must master the basic formula. The percent change represents the relative difference between an old value and a new value, expressed as a fraction of the original amount.
The Standard Percent Change Formula
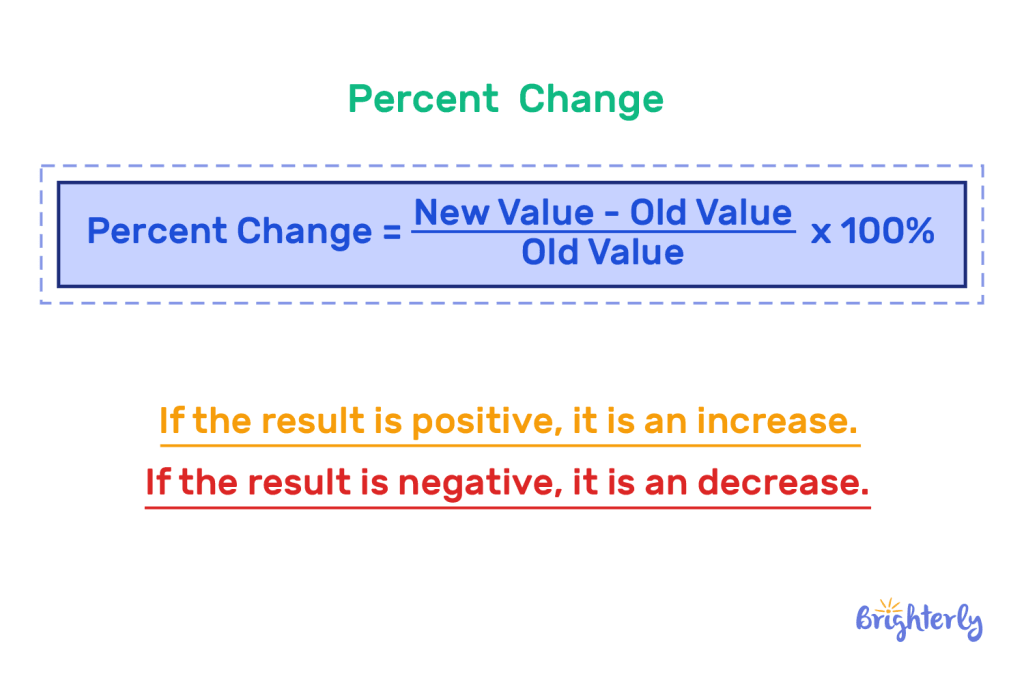
The formula for finding the percent change between two numbers is straightforward:
((New Value – Old Value) / |Old Value|) × 100
To find the change, you first subtract the original number (the “Old Value”) from the current number (the “New Value”). This result is the “absolute change.” You then divide that absolute change by the original number. Finally, multiply by 100 to convert the decimal into a percentage.
For example, if you invested $1,000 in a stock and its value grew to $1,250, the calculation would be:
- $1,250 – $1,000 = $250 (Absolute Change)
- $250 / $1,000 = 0.25
- 0.25 × 100 = 25%
Distinguishing Between Increase and Decrease
A positive result indicates a percentage increase, signaling growth or profit. Conversely, a negative result indicates a percentage decrease, signaling a loss or a reduction in costs. In personal finance, we generally strive for positive percent changes in asset values and negative percent changes in high-interest debt or monthly expenses.
Understanding the “base” of your calculation is crucial. Because the divisor is always the original number, the same absolute dollar change can result in vastly different percentages depending on where you started. A $100 increase on a $1,000 investment is a 10% gain, but a $100 increase on a $10,000 investment is a mere 1% gain.
Evaluating Investment Performance and Portfolio Health
For the modern investor, the percent change is the primary metric used to evaluate the success of an asset allocation strategy. Price movements in isolation mean very little; it is the percentage move relative to the initial capital risk that defines success.
Calculating Returns on Individual Assets
When monitoring a brokerage account, the “Total Return” is often expressed as a percent change. This includes not just the price appreciation of the stock or bond, but also any dividends or interest earned. By calculating the percent change over specific periods—such as year-to-date (YTD) or over a five-year rolling window—investors can determine if their chosen assets are outperforming benchmarks like the S&P 500.
The Mathematics of Recovery: Asymmetric Volatility
One of the most critical lessons in money management is understanding that percentage losses and gains are not symmetrical. If an investment drops by 50%, it does not require a 50% gain to get back to the break-even point; it requires a 100% gain.
Consider a $10,000 investment that loses 50% of its value. You are left with $5,000. To return to $10,000, that $5,000 must grow by $5,000—which is a 100% increase. This mathematical reality is why professional money managers focus heavily on “downside protection.” Understanding the percent change required for recovery helps investors set more realistic stop-loss orders and manage risk more effectively.
Business Finance: Using Percent Change for Scaling and Efficiency
In a corporate or small business setting, percent change is the pulse of the organization. It is used to measure Key Performance Indicators (KPIs), track seasonal trends, and justify budget allocations.
Analyzing Revenue Growth and Profit Margins
A business that reports $1 million in revenue sounds successful, but that figure lacks meaning without a comparison to the previous year. If the previous year’s revenue was $800,000, the company has experienced a 25% year-over-year (YoY) growth. This percentage allows stakeholders to gauge whether the company is scaling at a healthy rate.
Furthermore, businesses use percent change to monitor “Margin Compression.” If revenue increases by 10% but the cost of goods sold (COGS) increases by 15%, the business is becoming less efficient despite making more sales. Calculating the percent change in expenses relative to the percent change in income is vital for maintaining long-term profitability.
Expense Reduction and Budgetary Control
For entrepreneurs looking to “lean out” their operations, percent change is used to track the success of cost-cutting measures. If a firm switches software providers and reduces its monthly overhead from $5,000 to $3,500, they have achieved a 30% reduction in that specific expense category. Tracking these percentages across various departments helps management identify which initiatives are yielding the highest return on investment (ROI).
The Macro Perspective: Inflation and Purchasing Power
In personal finance, it is not enough to know how much your money has grown in nominal terms; you must also understand how its value has changed relative to the economy. This is where the percent change in the Consumer Price Index (CPI)—commonly known as inflation—comes into play.
Real vs. Nominal Rates of Return
If your savings account offers a 4% annual interest rate (a 4% positive change in your balance), but the inflation rate for that year is 5%, your “real” percent change is actually -1%. In this scenario, even though you have more dollars than you started with, your purchasing power has decreased.
Successful financial planning requires calculating the percent change of your net worth adjusted for inflation. This ensures that your wealth is not just growing in number, but in its ability to fund your lifestyle and future goals.
Tracking Market Volatility
Economists use percent change to measure market volatility. A “correction” is typically defined as a 10% decrease from recent highs, while a “bear market” is a 20% decrease. By understanding these percentage thresholds, investors can avoid emotional decision-making during market swings, recognizing that these fluctuations are measurable, historical patterns rather than random occurrences.
Practical Tools for Automating Financial Calculations
While the manual formula is essential for conceptual understanding, modern financial management relies on tools to track these changes across thousands of data points.
Leveraging Spreadsheets for Financial Tracking
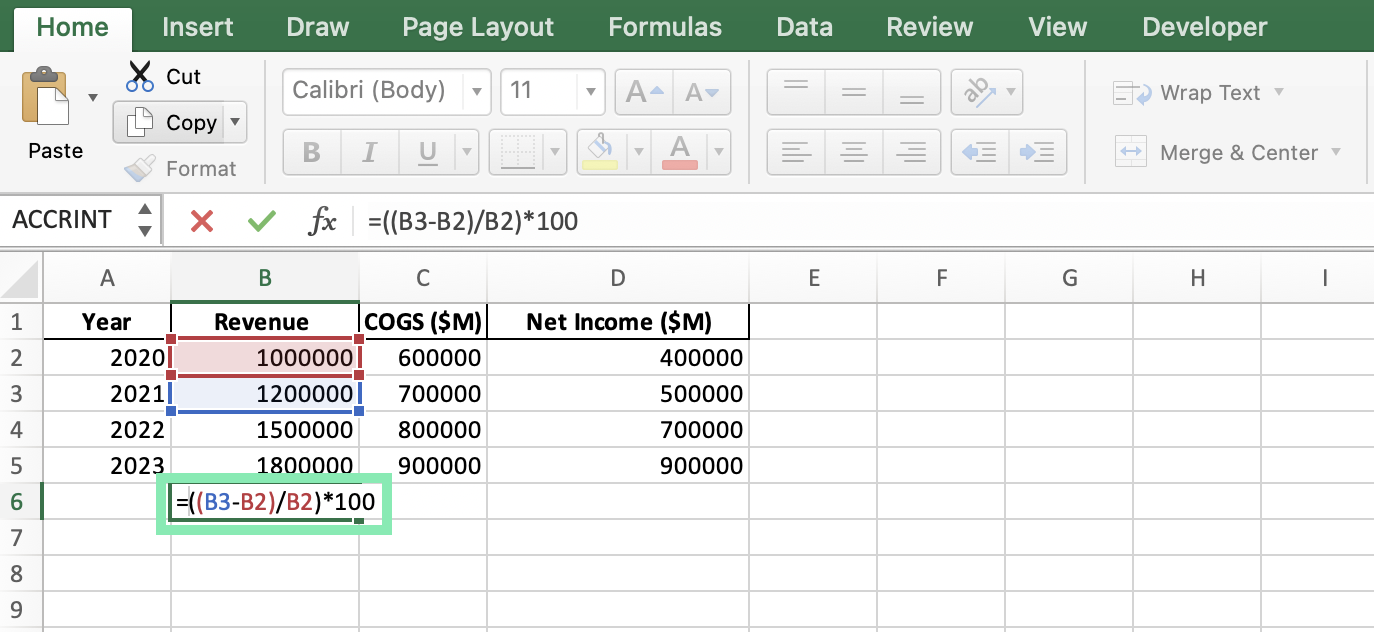
Microsoft Excel and Google Sheets are the gold standards for financial analysis. To calculate percent change in a spreadsheet, you can use a simple cell reference formula. If your old value is in cell A1 and your new value is in cell B1, the formula would be:
=(B1-A1)/A1
By formatting the result cell as a “Percentage,” the software automatically handles the multiplication by 100. This allows for the creation of dynamic dashboards that track portfolio changes in real-time as market prices update.
Utilizing Fintech Apps and Calculators
From specialized ROI calculators to comprehensive wealth management platforms like Personal Capital or Mint, technology has made percent change calculations instantaneous. These tools often provide “attribution analysis,” showing you exactly which percentage of your wealth growth came from contributions versus market appreciation.
However, a professional financier never relies solely on the tool; they understand the math behind the dashboard. Being able to mentally estimate a percent change allows you to vet the data you are being presented with, ensuring that an app’s “performance” metrics aren’t being skewed by recent deposits or withdrawals.
Conclusion: The Power of Relative Growth
Mastering the calculation of percent change is a transformative step in one’s financial journey. It moves an individual from a passive observer of “numbers going up or down” to an active analyst of financial health. By applying this simple yet powerful formula to investments, business expenses, and inflationary trends, you gain a clearer picture of your true economic standing.
In the world of money, clarity is the precursor to wealth. Whether you are aiming to increase your personal savings rate by 5% this year or seeking to identify a 20% undervalued stock, the ability to find and interpret the percent change between two numbers is your most reliable compass. Always remember: it is not just about how much the numbers change, but how that change compares to where you began.
aViewFromTheCave is a participant in the Amazon Services LLC Associates Program, an affiliate advertising program designed to provide a means for sites to earn advertising fees by advertising and linking to Amazon.com. Amazon, the Amazon logo, AmazonSupply, and the AmazonSupply logo are trademarks of Amazon.com, Inc. or its affiliates. As an Amazon Associate we earn affiliate commissions from qualifying purchases.