
In an increasingly data-driven world, the ability to translate visual information into actionable mathematical models is an indispensable skill. A graph, whether representing experimental data, economic trends, or engineering phenomena, is a rich tapestry of information waiting to be deciphered. Extracting the underlying function from a graph is not merely a theoretical exercise; it’s a practical endeavor that bridges the gap between observation and prediction, enabling us to understand systems, forecast future states, and make informed decisions. This guide delves into the methodologies and technological tools that empower us to transition from a visual representation to a precise, functional equation, strictly within the realm of technology and its applications.

Understanding the Fundamentals: Why Extract Functions from Graphs?
The journey from a static image to a dynamic mathematical expression begins with a clear understanding of its purpose. Graphs offer an intuitive visual summary, but a function provides a portable, precise, and predictive model. The “why” behind this extraction process is deeply rooted in the need for deeper analysis, simulation, and automation, all facilitated by modern technology.
The Bridge Between Visuals and Predictive Models
A graph shows us “what is.” A function allows us to ask “what if?” and “what will be?” By converting graphical data into an algebraic function, we move beyond mere observation to create a predictive model. This model can then be used to interpolate (estimate values between known data points), extrapolate (predict values beyond the observed range), and understand the intrinsic relationships between variables. In essence, it transforms a static visual into a dynamic engine for understanding and forecasting, a fundamental capability in numerous tech-driven fields.
Applications Across Scientific and Engineering Disciplines
The utility of deriving functions from graphs permeates nearly every scientific and engineering discipline. In physics, it helps in formulating laws from experimental data, like finding the inverse square law from gravitational force measurements. In chemistry, reaction rates and equilibrium constants can be determined. Engineers use this technique to model system behaviors, design control systems, or predict material fatigue. Biologists might model population growth or disease spread. Each of these applications relies heavily on computational tools for data acquisition, analysis, and validation, making it inherently a tech-centric process. For instance, simulating complex systems or designing AI algorithms often requires an accurate mathematical representation of real-world phenomena derived from observed graphs.
The Role of Data Visualization in Function Derivation
Before any sophisticated algorithms are applied, effective data visualization plays a crucial role. A well-constructed graph can immediately reveal patterns: linearity, periodicity, exponential growth, or logarithmic decay. Modern data visualization tools, ranging from simple spreadsheet programs to advanced analytics platforms, allow for interactive exploration, zooming, panning, and overlaying different datasets. This visual intuition guides the selection of potential function types (e.g., polynomial, exponential, trigonometric) before embarking on more rigorous computational fitting methods. It’s the first technological step in pattern recognition, informing the subsequent, more complex analytical phases.
Manual & Semi-Automated Techniques: Early Steps in Function Extraction
While advanced software dominates the field today, the foundational understanding often starts with more direct, manual, or semi-automated approaches. These methods build intuition and are still valuable for simpler cases or as a preliminary step before engaging complex computational tools.
Identifying Key Features: Shape, Intercepts, Symmetry
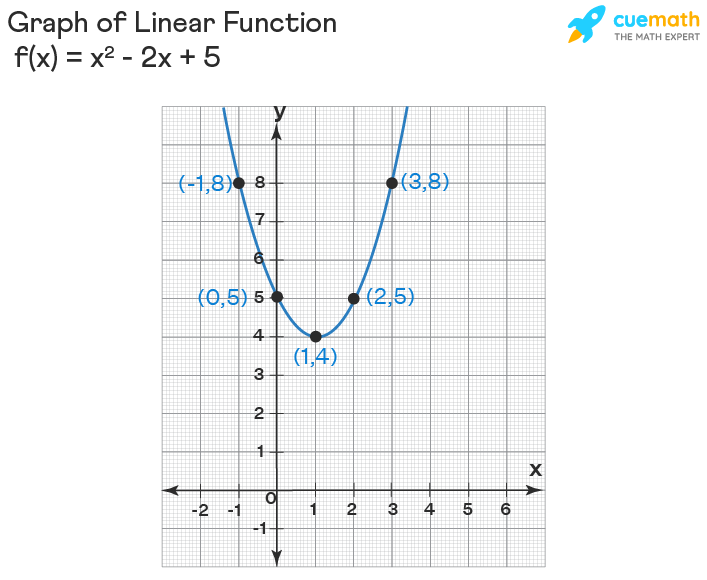
The initial step in any function derivation is a meticulous visual inspection of the graph. What is its overall shape? Is it a straight line, a parabola, an S-curve, or something oscillating? Where does it cross the axes (intercepts)? Does it exhibit any symmetry (e.g., odd, even, rotational)? Are there any asymptotes or points of discontinuity? These features provide critical clues about the family of functions the graph might belong to. For example, a parabolic shape immediately suggests a quadratic function, while a decaying curve approaching an asymptote might indicate an exponential or rational function. This observational phase is often enhanced by digital tools that allow for precise measurements and grid overlays on the graph.
Leveraging Graphing Calculators and Spreadsheet Software
Before the advent of powerful statistical packages, graphing calculators and spreadsheet software (like Microsoft Excel or Google Sheets) were and still are indispensable tools for semi-automated function finding. Graphing calculators allow users to plot data points, visualize the trend, and then use built-in regression functions (linear, quadratic, exponential, etc.) to find the best-fit equation. Spreadsheet software offers similar capabilities, often with more robust statistical functions and better visualization options. Users can input data, create scatter plots, and then add trendlines with displayed equations (R-squared value included), providing a quick and accessible way to derive simple functions. These tools democratized basic data analysis and remain a first line of defense for many, serving as an accessible entry point into computational data modeling.
The Art of Visual Curve Fitting and Estimation
Sometimes, a precise mathematical model isn’t immediately obvious, or the data is too noisy for a direct regression. In such cases, the “art” of visual curve fitting comes into play. This involves sketching or digitally drawing a smooth curve that best represents the general trend of the data, then estimating its parameters. For example, if you visually identify a linear trend, you might estimate its slope and y-intercept. For more complex curves, you might identify turning points, inflection points, or asymptotes to narrow down the potential function types. While less precise than computational methods, this intuitive estimation, often aided by digital drawing tools, can provide a valuable starting point or a quick mental model before proceeding to more rigorous algorithms.
Leveraging Software for Precision: Advanced Tools for Curve Fitting
For accuracy, reliability, and handling complex datasets, dedicated software is paramount. These tools move beyond simple trendlines to offer sophisticated algorithms for curve fitting, statistical analysis, and model validation. Their computational power allows for the rapid testing of various function types and the optimization of parameters, making them central to any tech-driven approach to function extraction.
Statistical Software Packages (e.g., R, SAS, SPSS)
Statistical software packages are designed for in-depth data analysis, including a comprehensive suite of regression and curve-fitting capabilities. R, an open-source language and environment for statistical computing and graphics, boasts an unparalleled ecosystem of packages (like ggplot2 for visualization and stats for modeling) that allow users to fit virtually any type of function, from simple linear models to generalized additive models and non-linear regression. SAS and SPSS are commercial alternatives, widely used in academia and industry, offering user-friendly interfaces alongside powerful statistical engines for complex data modeling. These platforms enable users to not only find a function but also to rigorously test its statistical significance, assess goodness-of-fit, and handle confounding variables, providing a robust framework for scientific inquiry.
Mathematical Computing Environments (e.g., MATLAB, Mathematica, Python with SciPy/NumPy)
For engineers, scientists, and researchers requiring high-performance computing and symbolic manipulation, mathematical computing environments are the go-to choice. MATLAB (Matrix Laboratory) excels in numerical computation, signal processing, and control system design. Its curve fitting toolbox is particularly robust, allowing users to interactively fit curves and surfaces to data using various models and algorithms. Mathematica offers unparalleled symbolic computation capabilities, allowing for the analytical derivation and manipulation of functions, in addition to numerical fitting.
Python, with its extensive libraries, has emerged as a powerhouse for data science and numerical analysis. NumPy provides efficient array operations, SciPy extends this with modules for optimization, interpolation, and curve fitting (e.g., scipy.optimize.curve_fit), and Matplotlib or Seaborn offer sophisticated plotting capabilities. This combination provides an open-source, flexible, and extremely powerful environment for extracting functions from data, favored for its versatility and community support across tech development, machine learning, and scientific research.
Specialized Graphing and Data Analysis Software (e.g., OriginLab, GraphPad Prism)
Beyond general-purpose platforms, specialized software caters to specific scientific and engineering needs. OriginLab (OriginPro) is a leading scientific graphing and data analysis software known for its intuitive interface, extensive curve fitting capabilities (including non-linear fitting with numerous built-in functions and user-defined models), and publication-quality graphing. It’s particularly popular in experimental sciences for its ability to handle large datasets and complex analysis workflows. GraphPad Prism is another specialized tool, widely used in biological and medical research, offering robust statistical analysis and curve fitting for dose-response curves, kinetic data, and survival analysis, among others. These tools are optimized for specific types of data encountered in laboratory settings, providing tailored functions and workflows that streamline the function-finding process for domain experts.
The Power of AI and Machine Learning: Automated Function Discovery
The frontier of function discovery is increasingly being shaped by Artificial Intelligence (AI) and Machine Learning (ML). These advanced computational paradigms offer unprecedented capabilities to automate the process, identify complex non-linear relationships, and even discover novel mathematical expressions directly from data, pushing the boundaries of what’s possible in tech-driven data analysis.
Regression Models: From Linear to Non-Linear
At its core, much of AI’s approach to finding functions from data is rooted in regression analysis. While traditional linear regression fits a straight line, ML extends this to highly complex non-linear models. Techniques like Polynomial Regression (fitting higher-order curves), Support Vector Regression (SVR), and Decision Tree Regressors can capture intricate patterns in data without explicit prior knowledge of the function’s form. Gradient Boosting Machines (e.g., XGBoost, LightGBM) and Random Forests are ensemble methods that combine multiple simple models to achieve high predictive accuracy, effectively learning complex functional mappings from input features to output values. These algorithms are typically implemented using ML libraries such as scikit-learn in Python, allowing for robust and scalable function identification.
Neural Networks and Symbolic Regression
Beyond traditional regression, Neural Networks (NNs) represent a paradigm shift. With their multi-layered architecture and non-linear activation functions, NNs (especially deep learning models) can approximate virtually any continuous function, making them incredibly powerful for modeling highly complex, non-linear relationships without explicit feature engineering. They “learn” the function directly from data through iterative optimization.
An even more advanced technique is Symbolic Regression. Unlike standard regression which fits parameters to a predefined function type, symbolic regression algorithms (often based on genetic programming or evolutionary algorithms) search the space of mathematical expressions to find the function that best fits the data. They can discover entirely new equations, which is invaluable when no known mathematical model exists. This capability represents a significant leap in automated scientific discovery, allowing AI to not just find the best fit for a given model, but to invent the model itself.
Challenges and Ethical Considerations in AI-Driven Function Extraction
Despite their power, AI and ML-driven function extraction come with challenges. Overfitting is a common issue, where a model learns the training data too well, including its noise, and performs poorly on new, unseen data. Techniques like cross-validation and regularization are crucial to mitigate this. Interpretability is another concern; while deep neural networks can achieve high accuracy, understanding why they make certain predictions or what function they’ve implicitly learned can be difficult, often leading to “black box” models.
Ethical considerations also arise, especially when AI-derived functions are used in critical applications. Biases in the training data can lead to biased or unfair functional models, perpetuating or even amplifying societal inequalities. Ensuring data quality, model transparency, and robust validation is paramount to leveraging AI responsibly for function discovery.
A Step-by-Step Tech-Centric Workflow for Function Identification
Successfully finding a function from a graph, especially with complex data, requires a systematic and tech-informed approach. This workflow integrates various tools and methodologies discussed, ensuring accuracy, robustness, and interpretability of the derived function.
Data Acquisition and Preprocessing from Digital Graphs
The first step is to obtain the numerical data. If the graph is digital (e.g., an image file), specialized software tools like WebPlotDigitizer or similar image analysis programs can be used to extract (digitize) the coordinates of data points. For graphs generated by scientific instruments, data is often directly available in digital formats (CSV, TXT, JSON), which can be imported into statistical software or programming environments.
Once acquired, the data requires preprocessing. This includes cleaning (handling missing values, outliers), scaling (normalization or standardization), and potentially smoothing noisy data. Libraries like Pandas in Python are invaluable for these data manipulation tasks, allowing for efficient loading, cleaning, and transformation of large datasets, preparing them for the modeling phase.
Model Selection and Parameter Estimation
With clean data in hand, the next critical step is model selection. Based on visual inspection (from initial data visualization) and domain knowledge, a candidate family of functions is chosen (e.g., linear, polynomial, exponential, trigonometric, logarithmic, or a custom non-linear model).
Using software like Python’s scipy.optimize.curve_fit, MATLAB’s Curve Fitting Toolbox, or the regression functions in R, the parameters of the chosen function are estimated. These algorithms typically employ iterative optimization techniques (e.g., least squares, maximum likelihood) to find the parameter values that minimize the difference between the observed data points and the values predicted by the function. Modern computing allows for rapid exploration of various model types and parameter spaces.

Validation and Interpretation of the Derived Function
Finding a function is only half the battle; validating its accuracy and interpreting its meaning are equally crucial. Validation involves assessing how well the derived function describes the original data and how well it generalizes to new data. Metrics like R-squared, Mean Squared Error (MSE), Root Mean Squared Error (RMSE), and AIC/BIC are commonly used to evaluate goodness-of-fit and model complexity. Cross-validation techniques are employed to ensure the model’s predictive power on unseen data. Residual plots (the differences between observed and predicted values) are invaluable for identifying systematic errors or patterns not captured by the model.
Finally, interpretation involves understanding the physical or logical meaning of the function’s parameters and its implications for the underlying system. A function is not just an equation; it’s a mathematical narrative of the data. This entire workflow, from data acquisition to interpretation, is iteratively refined using the powerful analytical and visualization capabilities provided by modern technology, ensuring that the derived function is not only accurate but also insightful and actionable.
aViewFromTheCave is a participant in the Amazon Services LLC Associates Program, an affiliate advertising program designed to provide a means for sites to earn advertising fees by advertising and linking to Amazon.com. Amazon, the Amazon logo, AmazonSupply, and the AmazonSupply logo are trademarks of Amazon.com, Inc. or its affiliates. As an Amazon Associate we earn affiliate commissions from qualifying purchases.