In the intricate world of finance, numbers tell a story. Whether you’re an individual meticulously managing your household budget, an investor tracking market fluctuations, or a business owner analyzing quarterly performance, understanding change is paramount. Specifically, the ability to accurately calculate and interpret percentage of decrease is not just a mathematical exercise; it’s a vital skill for informed decision-making, effective progress tracking, and identifying crucial trends. A percentage decrease offers a standardized, relative measure of how much a value has fallen, providing clarity that absolute numbers alone often cannot. It’s a powerful financial tool that helps in assessing losses, identifying cost-saving opportunities, and understanding the true impact of declining figures across personal and business financial landscapes.

The Fundamentals: What is Percentage Decrease and Why Does it Matter?
At its core, percentage decrease quantifies the relative reduction between an initial value and a subsequent, smaller value. It transforms raw numbers into a comparable metric, allowing for more insightful analysis than simply noting a numerical drop.
Defining Percentage Decrease
Percentage decrease represents the proportional fall in value from an original starting point to a new, lower point, expressed as a percentage of that original value. It answers the question: “By what percentage has something gone down?” For instance, if your investment portfolio drops from $10,000 to $8,000, the absolute decrease is $2,000. But what does $2,000 mean in context? The percentage decrease puts this figure into perspective, revealing the magnitude of the change relative to its starting size. This relative measure is crucial because a $2,000 drop feels very different on a $10,000 portfolio compared to a $100,000 portfolio.
The Core Formula Unveiled
Calculating the percentage of decrease is straightforward once you understand the formula. It involves three key steps:
- Find the absolute decrease: Subtract the new, lower value from the original value.
Absolute Decrease = Original Value - New Value - Divide by the original value: This gives you the decimal equivalent of the decrease.
Decimal Decrease = Absolute Decrease / Original Value - Multiply by 100: Convert the decimal to a percentage.
Percentage Decrease = (Decimal Decrease) * 100%
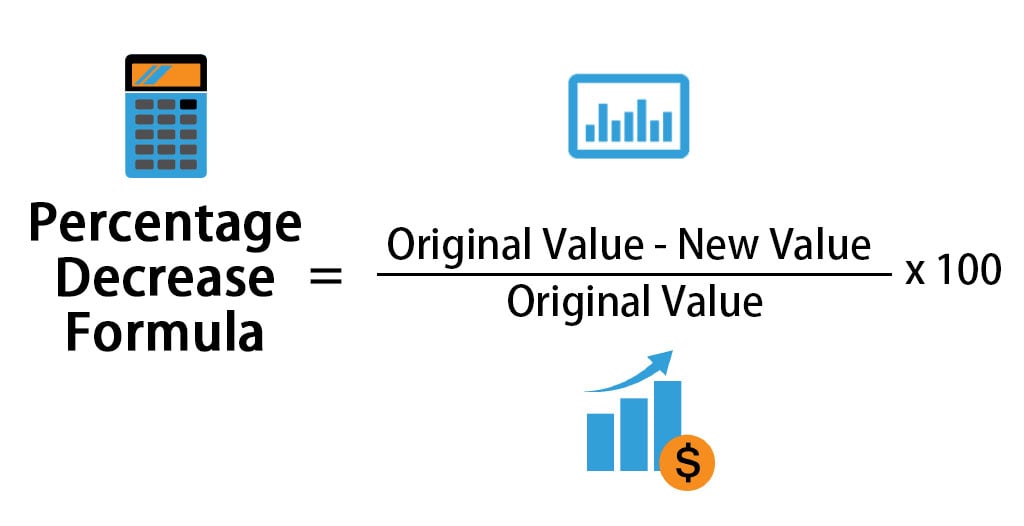
Combining these steps, the complete formula is:
Percentage Decrease = ((Original Value - New Value) / Original Value) * 100%
Let’s use an example: Your monthly utility bill went from $150 last month to $120 this month.
- Absolute Decrease = $150 – $120 = $30
- Percentage Decrease = ($30 / $150) * 100% = 0.20 * 100% = 20%
You successfully decreased your utility bill by 20%.
Beyond the Numbers: The Significance in Finance
The real power of percentage decrease lies in its utility for financial analysis. In personal finance, it helps you track progress in debt reduction, identify successful expense cuts, and understand the impact of investment downturns. For businesses, it’s indispensable for diagnosing revenue declines, measuring the effectiveness of cost-cutting initiatives, analyzing profit margin contractions, and assessing the efficiency of operations. This metric provides a universal language for comparing changes across different financial items, regardless of their absolute values, enabling clearer communication and more strategic planning.
Practical Applications in Personal Finance
For individuals striving for financial wellness, the percentage of decrease is an indispensable tool for monitoring progress, identifying areas for improvement, and maintaining motivation.
Reducing Debt: Tracking Your Progress
One of the most empowering applications of percentage decrease is in managing and reducing debt. Whether it’s credit card debt, student loans, or a mortgage, seeing your debt load decrease by a tangible percentage can be a huge motivator.
Example: You started the year with $5,000 in credit card debt and through diligent payments, you’ve reduced it to $3,500.
Percentage Decrease = (($5,000 - $3,500) / $5,000) * 100% = ($1,500 / $5,000) * 100% = 0.30 * 100% = 30%
You’ve successfully decreased your credit card debt by 30%! This specific metric helps you set realistic goals (e.g., “I want to reduce my highest-interest debt by 50% this year”) and celebrates milestones along your debt-free journey.
Mastering Your Expenses: Identifying Savings Opportunities
Budgeting involves more than just tracking what you spend; it’s about actively managing and, where possible, reducing expenses. Percentage decrease helps you gauge the effectiveness of your cost-cutting efforts.
Example: Last month you spent $400 on dining out. This month, you made a conscious effort to cook at home more and spent $250.
Percentage Decrease = (($400 - $250) / $400) * 100% = ($150 / $400) * 100% = 0.375 * 100% = 37.5%
You’ve decreased your dining out expenses by a remarkable 37.5%! This analytical approach can highlight which spending categories offer the biggest potential for savings and reinforce positive financial habits.
Investment Portfolio Analysis: Understanding Market Corrections and Losses
For investors, percentage decrease is crucial for understanding the impact of market downturns, called corrections or bear markets, and assessing the performance of individual assets.
Example: Your stock investment was worth $10,000 at its peak, but due to market volatility, it dropped to $7,500.
Percentage Decrease = (($10,000 - $7,500) / $10,000) * 100% = ($2,500 / $10,000) * 100% = 0.25 * 100% = 25%
Your investment has experienced a 25% drawdown. Understanding this percentage helps you contextualize the loss, make informed decisions about holding or selling, and compare it to broader market indices or other investments. It helps differentiate a minor dip from a significant decline.
Budgeting and Income Management
Percentage decrease also plays a role in overall budget management. If your income decreases, understanding the percentage fall helps you quickly adjust your budget to maintain financial stability. Similarly, if you’ve targeted a reduction in a specific discretionary spending category, this calculation confirms your success. It provides a clear, quantitative feedback loop for your financial behaviors.
Strategic Insights for Business Finance
In the business realm, percentage decrease is a critical metric for performance evaluation, strategic planning, and operational efficiency. It provides insights into areas of concern and highlights the impact of managerial decisions.
Revenue and Sales Declines: Diagnosing Business Health
A drop in revenue or sales is a red flag for any business. The percentage decrease provides a clearer picture of the severity of this decline.
Example: A company’s quarterly sales dropped from $500,000 last quarter to $425,000 this quarter.
Percentage Decrease = (($500,000 - $425,000) / $500,000) * 100% = ($75,000 / $500,000) * 100% = 0.15 * 100% = 15%
A 15% decrease in sales revenue is significant and warrants immediate investigation into market shifts, competitive pressures, product issues, or sales strategy effectiveness. Without the percentage, the $75,000 figure might seem less impactful to some, but the 15% relative drop underscores its importance.
Cost Reduction Initiatives: Measuring Efficiency
Businesses constantly seek to optimize costs. When new initiatives are implemented to reduce operational expenses, the percentage decrease quantifies their success.
Example: A manufacturing plant reduced its energy consumption costs from $20,000 per month to $17,000 per month after upgrading equipment.
Percentage Decrease = (($20,000 - $17,000) / $20,000) * 100% = ($3,000 / $20,000) * 100% = 0.15 * 100% = 15%
This 15% reduction in energy costs demonstrates the clear financial benefit of the equipment upgrade, justifying the investment and potentially informing future capital expenditure decisions.
Profit Margins and Bottom Line Performance
Profitability is the lifeblood of any business. When profit margins decrease, understanding the percentage of that decrease helps management pinpoint problems.
Example: A company’s gross profit margin dropped from 40% to 35% this quarter. While not a direct percentage decrease calculation of the margin itself in the same way, if we consider profit dollars:
If revenue was $1,000,000, and profit went from $400,000 to $350,000:
Percentage Decrease in Profit Dollars = (($400,000 - $350,000) / $400,000) * 100% = ($50,000 / $400,000) * 100% = 0.125 * 100% = 12.5%
This 12.5% decrease in actual profit dollars, reflecting a 5-percentage-point drop in margin, signals issues that could be related to increased cost of goods sold, pricing pressures, or inefficient operations.
Inventory Management and Waste Reduction
Reducing waste and optimizing inventory levels are crucial for business efficiency. Calculating the percentage decrease in spoilage, obsolescence, or carrying costs helps measure the success of these efforts. For example, if inventory write-offs decreased by 25% year-over-year, it indicates improved inventory management practices.
Common Pitfalls and Advanced Considerations
While the formula for percentage decrease is straightforward, its application requires careful consideration to avoid misinterpretations and ensure meaningful analysis.
The Importance of the Original Value (Base)
The “original value” or “base” in the formula is critically important. It must be the starting point from which the decrease is measured. Using the wrong base can lead to inaccurate and misleading percentages. For example, if a stock drops from $100 to $50 (a 50% decrease), and then goes up from $50 to $75, that’s a 50% increase ($25/$50). If you mistakenly use the new value as the base for the decrease, your calculations will be flawed. Always ensure your “original value” is the larger of the two figures you are comparing when calculating a decrease.
Context is King: What Does the Decrease Really Mean?
A percentage decrease is only as insightful as the context in which it is presented. A 5% decrease in revenue might be alarming for a mature, stable company but negligible for a rapidly growing startup. Conversely, a 50% decrease in a small, non-critical expense might be less impactful than a 2% decrease in a major, recurring cost. Always consider the absolute values involved, the industry benchmarks, historical performance, and the overall strategic goals when interpreting a percentage decrease. Compare like-for-like (e.g., year-over-year, quarter-over-quarter) to minimize seasonal or one-off distortions.
Distinguishing from Percentage Change
It’s important to understand that percentage decrease is a specific type of “percentage change.” Percentage change can encompass both increases and decreases. When specifically looking for a decrease, the described formula is used. When calculating general percentage change, the formula is ((New Value - Original Value) / Original Value) * 100%, where a negative result indicates a decrease. However, for clarity and focus on reduction, isolating “percentage decrease” as a distinct calculation is often preferred in financial reporting.
Using Financial Tools and Software
While manual calculation is good for understanding the concept, for larger datasets or regular analysis, leverage financial tools. Spreadsheets like Microsoft Excel or Google Sheets have built-in functionalities to automate these calculations. Simply input your original and new values, apply the formula, and drag it across rows or columns to analyze multiple data points efficiently. Many financial software programs also include dashboards that automatically track and display percentage changes in your accounts, investments, or business metrics.
Enhancing Your Financial Decision-Making
Mastering the percentage of decrease isn’t just about crunching numbers; it’s about empowering smarter financial choices, setting effective goals, and communicating financial realities with precision.
Setting Realistic Goals
Understanding percentage decrease allows you to set clear, measurable, and achievable financial goals. Instead of a vague goal like “I want to save money,” you can aim to “decrease my discretionary spending by 15% this quarter” or “reduce my highest-interest debt by 25% by year-end.” These specific, percentage-based targets provide a tangible benchmark for success and make your financial journey more manageable and motivating.
Performance Monitoring and Benchmarking
Regularly calculating and tracking percentage decreases in relevant financial categories enables consistent performance monitoring. For personal finance, this means reviewing your monthly expenses against previous months or years. For businesses, it involves comparing current period revenues, costs, and profits against historical data, industry averages, or competitor performance. This continuous benchmarking helps identify early warning signs, assess the effectiveness of strategies, and make timely adjustments.
Communicating Financial Performance
Whether you’re presenting a budget to your family, a financial report to stakeholders, or explaining investment performance to a client, using percentage decrease provides a universally understood and impactful way to communicate financial trends. It offers a standardized, relative metric that transcends the absolute scale of the figures, making complex financial information more accessible and actionable to diverse audiences. A 10% drop in profits is often more impactful to convey than simply stating a $100,000 drop without context.
In conclusion, the ability to figure percentage of decrease is far more than a basic math skill; it is a fundamental pillar of financial literacy and strategic decision-making. From navigating personal budgets and investment portfolios to optimizing business operations and fostering growth, this critical metric provides clarity, enables precise goal setting, and empowers individuals and organizations to understand and respond effectively to the dynamic fluctuations inherent in the financial world. Integrate this powerful skill into your financial toolkit, and you’ll unlock deeper insights and greater control over your financial destiny.
aViewFromTheCave is a participant in the Amazon Services LLC Associates Program, an affiliate advertising program designed to provide a means for sites to earn advertising fees by advertising and linking to Amazon.com. Amazon, the Amazon logo, AmazonSupply, and the AmazonSupply logo are trademarks of Amazon.com, Inc. or its affiliates. As an Amazon Associate we earn affiliate commissions from qualifying purchases.