
In the complex world of finance, numbers tell a story. But raw figures alone often lack the context needed for truly insightful decision-making. This is where the percentage difference steps in – a powerful analytical tool that allows individuals and businesses to compare two values and understand their relative disparity. Far beyond simple subtraction, calculating the percentage difference provides a standardized metric for evaluating growth, decline, efficiency, and comparative value across diverse financial scenarios. Whether you’re assessing investment returns, scrutinizing budgetary performance, or comparing product prices, mastering this calculation is a cornerstone of sound financial literacy and strategic planning.
Why Percentage Difference Matters in Finance
The ability to accurately determine the percentage difference between two numbers is not merely an academic exercise; it’s a critical skill for anyone navigating the financial landscape. Its utility spans personal finance, investment management, and corporate financial analysis, offering clarity where absolute numbers can be misleading.
Understanding Investment Performance
For investors, percentage difference is the language of returns and risks. It allows you to objectively compare the performance of different assets, portfolios, or investment strategies over various periods. For instance, knowing that stock A increased from $50 to $75 and stock B from $100 to $130 doesn’t immediately tell you which performed better proportionally. Calculating the percentage difference (50% for A vs. 30% for B) reveals the true relative gain, enabling more informed decisions about future allocations. This is vital for evaluating mutual funds, comparing year-over-year stock growth, or even tracking the appreciation of real estate.
Analyzing Budgetary Variances
In both personal and business finance, budgets serve as roadmaps for spending and revenue. However, reality often diverges from projections. Percentage difference becomes indispensable for quantifying these budgetary variances. If your marketing budget was $10,000 but actual spending was $12,000, understanding that this represents a 20% overspend (rather than just a $2,000 difference) provides a clear, actionable metric. It helps identify areas of financial discipline, pinpoint cost overruns, or celebrate cost savings, guiding future financial planning and resource allocation. For businesses, this analysis is crucial for cost control, profitability assessment, and strategic forecasting.
Evaluating Price Changes and Discounts
From a consumer perspective, percentage difference helps evaluate the true value of discounts and understand price fluctuations. A “$20 off” coupon on a $100 item is a 20% discount, but on a $200 item, it’s only 10%. Recognizing these relative values empowers smarter purchasing decisions. For businesses, analyzing price changes using percentage difference is fundamental for competitive pricing strategies, understanding market dynamics, and assessing the impact of inflation or deflation on product costs and selling prices. It helps determine the elasticity of demand and optimize revenue streams.
The Core Formula: Step-by-Step Calculation
The percentage difference formula is straightforward, yet its application demands a clear understanding of its components. Unlike percentage change, which focuses on a unidirectional movement from an old to a new value, percentage difference often implies a symmetric comparison where neither number is strictly “older” or “newer,” though in financial contexts, a reference point is typically established.
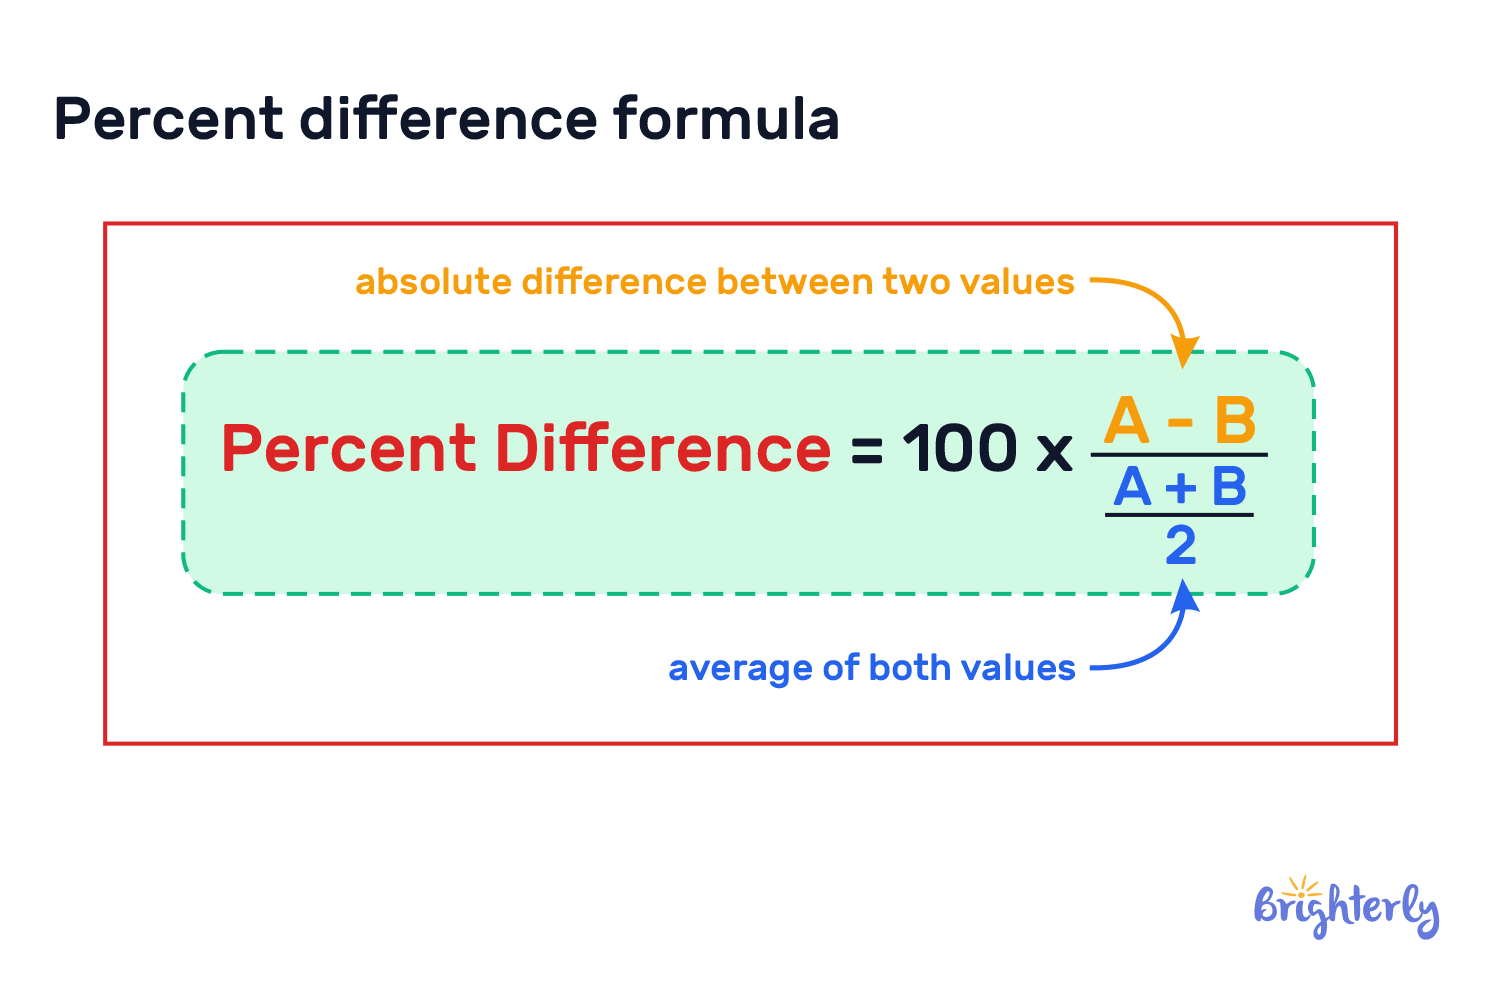
The general formula for percentage difference is:
Percentage Difference = (|Value 1 – Value 2| / ((Value 1 + Value 2) / 2)) * 100
However, in financial applications, it’s often more intuitive to use a slightly modified approach that aligns with percentage change but is applied for comparative purposes, identifying a clear “base” or “reference” value. If we assume we’re finding the difference relative to a specific base, the formula simplifies and becomes more applicable to financial analysis, where one number often serves as the benchmark.
A common way to calculate the relative difference, particularly when comparing two distinct values where one is implicitly or explicitly a “starting point” or “reference,” is:
Percentage Difference = ((Absolute Difference) / (Reference Value)) * 100
Let’s break down this financial-centric approach step-by-step:
Identifying Your Starting and Ending Values (or Two Values for Comparison)
First, clearly define the two numbers you wish to compare. In finance, these might be:
-
Original price vs. discounted price
-
Previous quarter’s revenue vs. current quarter’s revenue
-
Budgeted expense vs. actual expense
-
Initial investment vs. current investment value
-
Stock price on Monday vs. stock price on Friday
Let’s call them Value A and Value B.
Calculating the Absolute Difference
The next step is to find the absolute difference between Value A and Value B. “Absolute” means we ignore any negative signs, as we’re interested in the magnitude of the difference, not whether it’s an increase or decrease at this stage.
Absolute Difference = |Value A – Value B|
For example, if Value A is $100 and Value B is $120, the absolute difference is |$100 – $120| = |-20| = $20.
If Value A is $150 and Value B is $120, the absolute difference is |$150 – $120| = |30| = $30.
Dividing by the Reference Value
This is the crucial step where you determine the base against which you’re measuring the difference. In financial analysis, this “reference value” is typically the original, initial, or base number you are comparing from.
Ratio = Absolute Difference / Reference Value
-
Example 1 (Price Increase): If a stock went from $100 (Reference Value) to $120, the difference is $20. Ratio = $20 / $100 = 0.20.
-
Example 2 (Price Decrease): If a stock went from $150 (Reference Value) to $120, the difference is $30. Ratio = $30 / $150 = 0.20.
-
Example 3 (Budget Variance): If budgeted expenses were $5,000 (Reference Value) and actual expenses were $6,000, the difference is $1,000. Ratio = $1,000 / $5,000 = 0.20.
It’s important to select the correct reference value for the context. If you want to know how much B differs from A as a percentage of A, then A is your reference value. If you want to know how much A differs from B as a percentage of B, then B is your reference value. For symmetrical comparison where no clear “original” exists (e.g., comparing the size of two unrelated companies’ market caps), the average of the two numbers is often used as the denominator, as per the first formula mentioned above. However, for most financial performance analysis, there’s usually a clear “prior” or “target” value.
Converting to a Percentage
Finally, multiply the resulting ratio by 100 to express it as a percentage.
Percentage Difference = (Ratio) * 100
-
Following the examples above:
-
0.20 * 100 = 20%
-
0.20 * 100 = 20%
-
0.20 * 100 = 20%
-
This means the stock increased by 20% from $100, decreased by 20% from $150, and actual expenses were 20% over budget.
Distinguishing Percentage Difference from Percentage Change
While often used interchangeably in casual conversation, there’s a subtle but important distinction between “percentage difference” and “percentage change,” particularly when precision is paramount in financial analysis. The primary differentiator lies in the directionality and the base value used for calculation.
When to Use Percentage Difference (Symmetric Comparison)
The purest form of percentage difference, as defined by the formula (|Value 1 - Value 2| / ((Value 1 + Value 2) / 2)) * 100, is ideal for situations where there isn’t a clear “starting” or “ending” point, and you simply want to express the magnitude of the difference relative to their average. This symmetric approach ensures that the percentage difference between A and B is the same as between B and A.
-
Example: Comparing the market capitalization of two similar companies, Company X ($500M) and Company Y ($700M).
-
Absolute Difference = |$500M – $700M| = $200M
-
Average = ($500M + $700M) / 2 = $600M
-
Percentage Difference = ($200M / $600M) * 100 = 33.33%
This indicates that the two companies’ market caps differ by 33.33% relative to their average size.
-
When to Use Percentage Change (Unidirectional Movement)
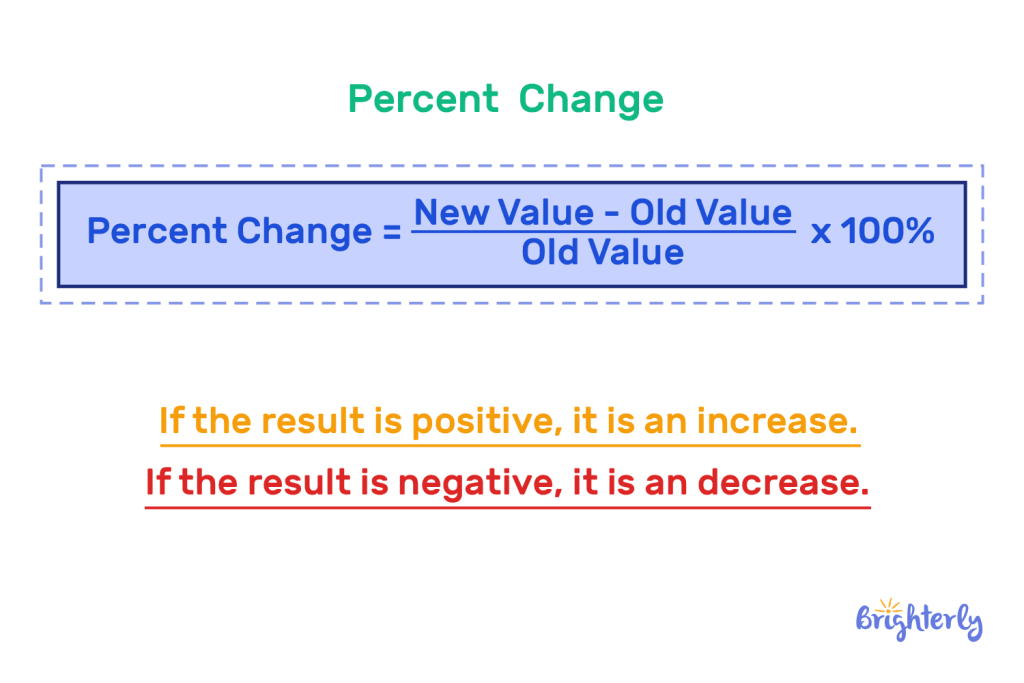
Percentage change, on the other hand, always measures a change from an initial value to a final value. It specifically addresses increases or decreases. The formula is:
Percentage Change = ((Final Value – Initial Value) / Initial Value) * 100
This formula yields a positive percentage for an increase and a negative percentage for a decrease. This is the most common form used in financial reporting for performance metrics.
Practical Examples in Financial Reporting
Consider these scenarios to highlight the distinction:
-
Investment Growth: Your portfolio increased from $10,000 to $12,000.
-
Percentage Change = (($12,000 – $10,000) / $10,000) * 100 = (2,000 / 10,000) * 100 = 20% increase.
-
If you were asked for the “percentage difference” between the two values (without specifying a base), using the symmetric formula might be 18.18%, which is less intuitive for growth. Therefore, “percentage change” is the preferred term here.
-
-
Sales Decline: A product’s sales dropped from 500 units to 400 units.
- Percentage Change = ((400 – 500) / 500) * 100 = (-100 / 500) * 100 = -20% decrease.
Again, “percentage change” clearly articulates the decline relative to the starting point.
In summary, while the mechanics of calculating a difference relative to a base are similar, “percentage change” explicitly indicates direction and is the standard for measuring performance, growth, or decline from a specific starting point in finance. “Percentage difference” can be used symmetrically when comparing two values without an inherent temporal sequence or designated baseline. For the purpose of this article, when discussing financial applications like investment returns or budget variances, we are largely referring to the methodology of calculating percentage change but broadly labeling it “percentage difference” as it’s the percentage disparity being calculated from a reference.
Real-World Financial Applications and Case Studies
The ability to calculate percentage difference (or change) is a versatile financial skill applicable across numerous scenarios, enabling sharper insights and better decision-making.
Investment Portfolio Growth (Example)
Let’s say your investment portfolio was valued at $50,000 at the start of the year and grew to $57,500 by year-end.
-
Initial Value: $50,000
-
Final Value: $57,500
-
Absolute Difference: $57,500 – $50,000 = $7,500
-
Percentage Growth = ($7,500 / $50,000) * 100 = 15%
This 15% tells you your portfolio yielded a respectable return, allowing you to compare it against benchmarks or other investment options.
Business Revenue Analysis (Example)
A business recorded $250,000 in revenue in Q1 and $300,000 in Q2.
-
Q1 Revenue (Reference): $250,000
-
Q2 Revenue: $300,000
-
Absolute Difference: $300,000 – $250,000 = $50,000
-
Percentage Increase = ($50,000 / $250,000) * 100 = 20%
A 20% quarter-over-quarter growth is a strong indicator of business health, informing marketing strategies and operational adjustments.
Personal Budget Tracking (Example)
You budgeted $800 for groceries last month, but your actual spending was $920.
-
Budgeted Amount (Reference): $800
-
Actual Spending: $920
-
Absolute Difference: $920 – $800 = $120
-
Percentage Over Budget = ($120 / $800) * 100 = 15%
Understanding that you were 15% over budget helps you adjust future spending or re-evaluate your budget allocations.
Comparing Loan Offers or Interest Rates (Example)
You are offered two loans: Loan A with a 5.0% interest rate and Loan B with a 4.5% interest rate. While the absolute difference is 0.5 percentage points, how much relatively cheaper is Loan B?
-
Loan A Rate (Reference): 5.0%
-
Loan B Rate: 4.5%
-
Absolute Difference: |4.5% – 5.0%| = 0.5% (or 0.005 as a decimal)
-
Percentage Difference = (0.005 / 0.05) * 100 = 10%
Loan B is effectively 10% cheaper in terms of its interest rate compared to Loan A, a significant difference that impacts total interest paid over the loan term.
Common Pitfalls and Best Practices
While calculating percentage difference seems simple, errors often arise from misunderstanding the base value or misinterpreting the result. Adhering to best practices ensures accuracy and meaningful insights.
Choosing the Correct Base Number
This is perhaps the most critical step. Always clearly define which number serves as your “reference” or “initial” value.
-
Error: If an investment drops from $100 to $50 (a 50% decrease), and then rises from $50 back to $100 (a 100% increase), using the wrong base for comparison (e.g., trying to average them symmetrically) can lead to confusion. The percentage change logic ($100 to $50 is -50%; $50 to $100 is +100%) is usually clearer for temporal sequences.
-
Best Practice: For performance metrics, the initial value or prior period’s value is almost always the base. For symmetrical comparison of two concurrent values, the average of the two can be the base. Be consistent and explicit in your chosen reference.
Handling Zero or Negative Values
The standard formula for percentage difference/change breaks down when the reference value (denominator) is zero. Division by zero is undefined.
-
Error: If a business’s revenue goes from $0 to $10,000, you cannot calculate a percentage increase using the standard formula.
-
Best Practice: In such cases, state the absolute change clearly and explain the context. For negative numbers, especially in profits (e.g., moving from a loss to a profit, or a larger loss to a smaller loss), careful interpretation is needed. Sometimes, expressing the difference as a percentage of the absolute value of the initial negative number, or simply stating the absolute change, is more appropriate.
Contextualizing Your Results
A percentage alone rarely tells the whole story.
-
Error: Stating a 100% increase in revenue for a startup that went from $1,000 to $2,000 sounds impressive, but the absolute change ($1,000) is small. Conversely, a 5% increase on a billion-dollar revenue stream is a massive absolute gain.
-
Best Practice: Always present the absolute values alongside the percentage difference. Explain the implications of the change within the broader financial context. Is the change significant for the scale of the operation? Is it sustainable?
Leveraging Financial Tools for Accuracy
While manual calculation is essential for understanding, for complex analyses or large datasets, financial tools are invaluable.
- Best Practice: Utilize spreadsheet software like Excel or Google Sheets (using formulas like
=(B2-A2)/A2for percentage change) or financial calculators. Many investment platforms and accounting software automatically provide percentage differences for performance metrics. This minimizes human error and speeds up analysis.

Conclusion
The ability to accurately figure the percentage difference between two numbers is a fundamental cornerstone of financial literacy and analytical prowess. From individual investors tracking portfolio gains to corporate finance teams dissecting budgetary variances, this calculation provides the essential context that transforms raw data into actionable insights. By understanding the core formula, carefully distinguishing between percentage difference and percentage change, applying it across real-world financial scenarios, and adhering to best practices, you empower yourself to make more informed decisions, identify critical trends, and ultimately navigate the intricate world of money with greater confidence and precision. Master this skill, and you unlock a deeper understanding of the financial narratives all around us.
aViewFromTheCave is a participant in the Amazon Services LLC Associates Program, an affiliate advertising program designed to provide a means for sites to earn advertising fees by advertising and linking to Amazon.com. Amazon, the Amazon logo, AmazonSupply, and the AmazonSupply logo are trademarks of Amazon.com, Inc. or its affiliates. As an Amazon Associate we earn affiliate commissions from qualifying purchases.