
Understanding the dynamics of prices is not just for economists; it’s a fundamental skill for anyone managing personal finances, investing, or running a business. A price index is a normalized average of price relatives for a given class of goods or services in a given region, during a specified interval of time. It’s a critical tool that allows us to gauge inflation, track purchasing power, and make informed financial decisions. Far from being an abstract economic concept, figuring out a price index provides tangible insights into how our money’s value changes over time. This article will demystify the process, from basic calculations to advanced interpretations, equipping you with the knowledge to apply this powerful financial metric.
Understanding the Essence of Price Indexes
At its core, a price index measures the proportional change in the average prices of a basket of goods and services over time. It quantifies how much more (or less) it costs to buy the same set of items from one period to another. This seemingly simple metric holds profound implications for individuals and the broader economy, acting as a barometer for inflation and deflation.
What is a Price Index?
A price index is a statistical measure that shows changes in the prices of goods and services over time. It is typically expressed as a percentage relative to a base period, which is set to 100. For instance, if a price index for a particular year is 110, it means that prices have, on average, increased by 10% since the base period. The value of a price index isn’t an absolute cost but rather a relative measure of price levels. It provides a convenient way to compare current prices to past prices without needing to track every single item individually. This aggregation and normalization make complex economic data manageable and interpretable for a wide audience.
Why Price Indexes Matter: The Impact on Your Money
The relevance of price indexes extends deeply into our financial lives. For personal finance, a rising price index signals inflation, eroding the purchasing power of our savings and fixed incomes. A salary increase of 3% might sound good, but if the price index (representing inflation) rose by 5%, your real purchasing power has actually decreased. Investors use price indexes to calculate real returns on investments, distinguishing between nominal gains and gains that truly outpace inflation. For businesses, price indexes are crucial for adjusting pricing strategies, negotiating contracts, and understanding the real costs of production. Without price indexes, it would be impossible to accurately assess economic growth, as nominal Gross Domestic Product (GDP) would reflect both price changes and actual production changes, obscuring the true picture.
Common Types of Price Indexes
While the underlying principle is similar, various price indexes serve different purposes by focusing on different baskets of goods and services. The most widely known is the Consumer Price Index (CPI), which measures the average change over time in the prices paid by urban consumers for a market basket of consumer goods and services. This is the primary gauge of inflation affecting households.
Another important index is the Producer Price Index (PPI), which measures the average change over time in the selling prices received by domestic producers for their output. PPIs track prices at the wholesale level and can often serve as an early indicator of future changes in the CPI. Other indexes include the Employment Cost Index (ECI) for wages and benefits, and specialized commodity price indexes. Each index offers a unique lens through which to view price changes in specific sectors of the economy, providing a comprehensive understanding of financial shifts.
The Core Mechanics: Calculating a Basic Price Index
Calculating a price index involves a systematic process of selecting items, defining periods, and applying a straightforward formula. While official government indexes use complex methodologies, understanding the basic calculation provides a solid foundation.
Defining the Base Period and Current Period
The first step in calculating any price index is to clearly define two periods: the base period and the current period. The base period serves as the reference point against which all subsequent price changes are measured. Its index value is always set to 100. The current period is the period for which you want to measure the price change relative to the base period. Consistency in defining these periods is crucial for meaningful comparisons. For example, if you want to see how the cost of living has changed over the last decade, you might select a specific month or year from ten years ago as your base period and the most recent month or year as your current period.
Selecting a Representative Basket of Goods and Services
A price index doesn’t track every single item available in the market. Instead, it relies on a representative basket of goods and services. This basket should reflect the typical consumption patterns or expenditures relevant to the purpose of the index. For a personal finance price index, this might include common items like groceries (milk, bread, eggs), transportation costs (gasoline, bus fare), housing (rent or mortgage payments), utilities, and common services (haircut, internet bill). The key is that the basket must be consistent between the base period and the current period to ensure a true apples-to-apples comparison of price changes. The weighting of items within this basket is also critical; for instance, housing costs typically take up a larger portion of a household budget than, say, coffee, and thus should be weighted more heavily in the calculation.
The Basic Formula: Price Index Calculation
The simplest form of a price index, often called a simple aggregate price index or Laspeyres index (when weights are derived from base period quantities), can be calculated using the following formula:
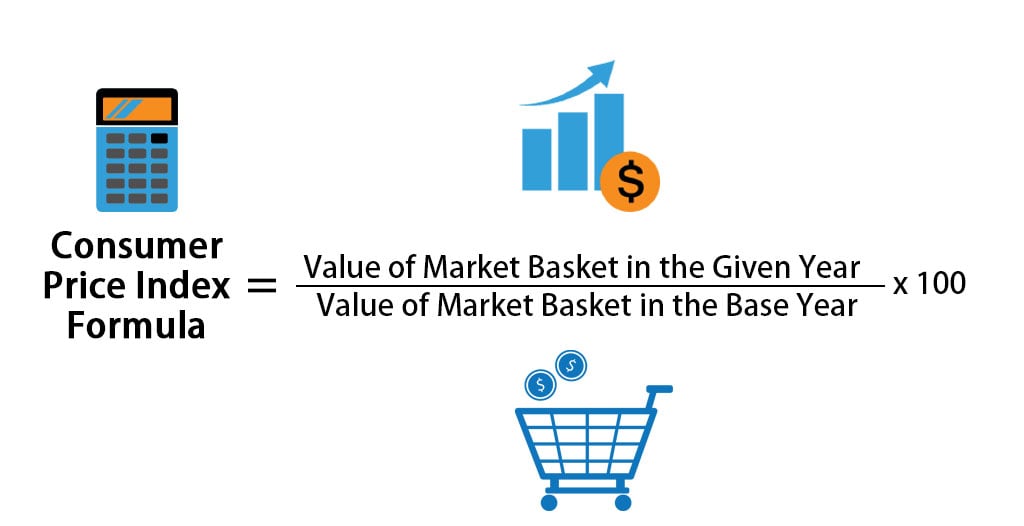
Price Index = (Cost of Basket in Current Period / Cost of Basket in Base Period) * 100
Where:
- Cost of Basket in Current Period: The sum of (price of each item in the current period * quantity of each item in the base period).
- Cost of Basket in Base Period: The sum of (price of each item in the base period * quantity of each item in the base period).
It’s important to use the quantities from the base period for both calculations. This is because we want to measure only the change in prices, holding the quantity and composition of the basket constant. If we used current period quantities, changes in consumption patterns would also influence the index, making it harder to isolate pure price inflation.
Step-by-Step Example Calculation
Let’s illustrate with a simplified example. Imagine your “basket” consists of three items: milk, bread, and coffee.
Base Period (Year 1):
- Milk: $3.00/gallon (you buy 2 gallons per month)
- Bread: $2.50/loaf (you buy 4 loaves per month)
- Coffee: $8.00/bag (you buy 1 bag per month)
Current Period (Year 2):
- Milk: $3.50/gallon
- Bread: $2.75/loaf
- Coffee: $9.50/bag
Step 1: Calculate the Cost of the Basket in the Base Period (Year 1) using Base Period Quantities.
- Milk: $3.00 * 2 = $6.00
- Bread: $2.50 * 4 = $10.00
- Coffee: $8.00 * 1 = $8.00
- Total Cost in Base Period = $6.00 + $10.00 + $8.00 = $24.00
Step 2: Calculate the Cost of the Basket in the Current Period (Year 2) using Base Period Quantities.
- Milk: $3.50 * 2 = $7.00
- Bread: $2.75 * 4 = $11.00
- Coffee: $9.50 * 1 = $9.50
- Total Cost in Current Period = $7.00 + $11.00 + $9.50 = $27.50
Step 3: Apply the Price Index Formula.
- Price Index = ($27.50 / $24.00) * 100
- Price Index = 1.1458 * 100
- Price Index = 114.58
This result means that, on average, the cost of your specific basket of goods has increased by 14.58% from Year 1 to Year 2.
Navigating the Nuances: Challenges and Adjustments
While the basic calculation is straightforward, real-world price index construction faces several challenges that require sophisticated adjustments to accurately reflect price changes and avoid bias. These nuances are crucial for understanding the limitations and strengths of official statistics.
Quality Bias and Product Evolution
One significant challenge is accounting for quality bias. Over time, goods and services often improve in quality, features, or performance. For example, a smartphone today is vastly more powerful and capable than a smartphone from five years ago, even if its nominal price is similar. Simply comparing the price of a “smartphone” in two periods without adjusting for these quality improvements would overstate inflation, as consumers are getting more for their money. Statisticians address this through methods like “hedonic regression,” which attempts to decompose a product’s price into the prices of its constituent characteristics, allowing for quality adjustments. Similarly, the introduction of entirely new products also poses a challenge, as they didn’t exist in the base period basket.
Substitution Bias: Consumer Behavior Changes
Consumers are rational; when the price of one good rises significantly, they often substitute it with a cheaper alternative. If the price of beef goes up, consumers might buy more chicken. A fixed-basket price index, like the simple Laspeyres index shown above, does not account for this substitution bias. By assuming consumers continue to buy the same quantities, it overstates the true cost of living increase because it doesn’t reflect the cost savings from consumers switching to less expensive options. To mitigate this, some indexes employ formulas that allow for substitution, such as the Fisher Ideal Index, or update the basket of goods more frequently to reflect changing consumption patterns.
Geographical and Demographic Variations
A single national price index, like the U.S. CPI, represents an average for a large population across diverse geographical areas. However, the cost of living can vary dramatically by region, city, or even neighborhood. Housing costs, for instance, are significantly higher in urban centers compared to rural areas. Similarly, different demographic groups (e.g., retirees, young families, single professionals) have different consumption patterns and face different price pressures. This means that a national average index might not accurately reflect the inflation experienced by a specific individual or household. For this reason, some countries or statistical agencies publish regional or demographic-specific price indexes to provide more localized and relevant insights.
The Role of Weighting in Complex Indexes
Our simple example used base-period quantities as weights. In reality, official price indexes employ sophisticated weighting schemes to ensure each item’s price change contributes proportionally to the overall index based on its relative importance in the total expenditure. For instance, housing costs might account for 30-40% of a typical household budget, so their price changes will have a much greater impact on the CPI than, say, the price of postage stamps. These weights are typically derived from extensive consumer expenditure surveys and are updated periodically to reflect evolving consumption patterns. The choice of weighting method (e.g., Laspeyres, Paasche, Fisher) impacts the index’s sensitivity to price and quantity changes, and is a critical consideration in constructing an accurate and unbiased measure.
Beyond the Basics: Advanced Applications and Interpretations
Understanding how to calculate a price index is just the beginning. Its true power lies in its application to various financial and economic analyses, offering profound insights for both personal and business decisions.
Adjusting for Inflation: Real vs. Nominal Values
One of the most crucial applications of a price index is to distinguish between nominal and real values. Nominal values are expressed in current dollars and reflect changes due to both quantity and price. Real values, however, are adjusted for inflation using a price index, revealing the true purchasing power. For example, if your salary increased from $50,000 to $55,000 (a 10% nominal increase) over a year, but the price index (inflation) rose by 7% during the same period, your real income increase is only 3% (approximately 10% – 7%).
The formula to convert a nominal value to a real value is:
Real Value = (Nominal Value / Price Index) * 100 (where the price index is for the current period, with the base period index set to 100 for conversion).
This adjustment is essential for comparing economic data over time, such as GDP, wages, profits, or investment returns, to understand genuine growth rather than just inflated figures.
Measuring Purchasing Power and Economic Health
Price indexes are direct measures of the purchasing power of money. A rising price index means your money buys less than it used to, indicating a decline in purchasing power. Conversely, a falling index (deflation) means your money buys more. This metric is vital for retirees on fixed incomes, whose purchasing power can be severely eroded by persistent inflation.
Beyond individual impact, the aggregate behavior of price indexes provides a snapshot of the economy’s health. Moderate, stable inflation (typically 2-3% per year as targeted by central banks) is often seen as healthy, signaling economic growth. High or volatile inflation can lead to economic instability, uncertainty, and reduced investment, while persistent deflation can signal a struggling economy, discouraging spending and investment due to expectations of falling prices.
Impact on Investments and Financial Planning
For investors, understanding price indexes is paramount for calculating real rates of return. If an investment yields a 5% nominal return, but inflation (as measured by the CPI) is 3%, the real return is only 2%. This distinction helps investors assess whether their portfolio is truly growing their wealth or merely keeping pace with rising costs. Financial planners use price indexes to project future expenses, especially for retirement planning, ensuring that clients’ savings will retain their purchasing power decades down the line. It influences asset allocation strategies, pushing investors towards assets that historically perform well in inflationary environments, such as real estate, commodities, or inflation-protected securities (e.g., TIPS).
Business Applications: Pricing Strategies and Contract Adjustments
Businesses rely heavily on price indexes for various strategic and operational decisions. They use PPI data to track changes in input costs (raw materials, energy, labor) and adjust their own pricing strategies to maintain profit margins. In long-term contracts, such as supply agreements, construction projects, or labor contracts, clauses are often included to automatically adjust prices based on changes in a specific price index (e.g., “cost-of-living adjustments” or COLA clauses linked to the CPI). This protects both parties from unexpected inflation or deflation, ensuring the real value of the contract remains stable over its duration. Furthermore, price indexes help businesses understand consumer spending trends and gauge the overall economic environment impacting their sales and market share.
Leveraging Price Index Data for Informed Financial Decisions
Having understood the “how” and “why” of price indexes, the final step is to effectively use this knowledge and readily available data to make smarter financial choices.
Where to Find Reliable Price Index Data
For individuals and businesses in the United States, the primary source for comprehensive and reliable price index data is the Bureau of Labor Statistics (BLS). The BLS publishes monthly data for the Consumer Price Index (CPI), Producer Price Index (PPI), and other relevant economic indicators. These statistics are meticulously collected, analyzed, and presented with detailed methodologies. Similar national statistical agencies exist in other countries (e.g., Eurostat for the European Union, Statistics Canada, ONS in the UK). Reputable financial news outlets, economic research firms, and central banks (like the Federal Reserve) also disseminate and interpret this data. Always ensure you are sourcing data from official or highly credible institutions to ensure accuracy.
How Individuals Can Use Price Indexes
- Budgeting and Saving: By tracking personal inflation against a general CPI, you can refine your budget. If your personal basket of goods (e.g., specific groceries, transportation) is inflating faster than the official CPI, you know you need to adjust your spending or find alternatives.
- Negotiating Salaries: When discussing salary increases, being aware of recent inflation rates (CPI) allows you to negotiate for raises that genuinely improve your purchasing power, rather than just keeping pace with rising costs.
- Retirement Planning: Use historical inflation data and future projections to realistically estimate the future cost of living, helping you determine how much you truly need to save for retirement.
- Investment Decisions: Evaluate the real returns of your investments. A positive real return means your wealth is growing beyond inflation. Consider inflation-protected assets if you anticipate high inflation.

How Businesses Can Use Price Indexes
- Pricing Strategy: Adjust product and service prices in response to changes in input costs (using PPI data) to maintain profitability.
- Contract Negotiation: Incorporate price index adjustment clauses into long-term contracts to manage risk associated with inflation or deflation.
- Financial Forecasting: Use price index trends to forecast future costs, revenues, and profit margins more accurately.
- Economic Analysis: Understand market trends, consumer behavior, and the overall economic climate to inform strategic business decisions, such as expansion, investment, or market entry.
- Performance Evaluation: Deflate nominal revenue or profit figures to get a clearer picture of real growth and operational efficiency over time.
In conclusion, the price index is far more than a dry economic statistic. It’s a vital financial tool that empowers us to understand the true value of our money, make intelligent investment choices, plan for the future with greater accuracy, and navigate the complex landscape of economic change. By mastering how to figure out a price index, and by regularly consulting reliable data, individuals and businesses can gain a significant edge in managing their financial well-being.
aViewFromTheCave is a participant in the Amazon Services LLC Associates Program, an affiliate advertising program designed to provide a means for sites to earn advertising fees by advertising and linking to Amazon.com. Amazon, the Amazon logo, AmazonSupply, and the AmazonSupply logo are trademarks of Amazon.com, Inc. or its affiliates. As an Amazon Associate we earn affiliate commissions from qualifying purchases.