
In the intricate world of finance, few mathematical concepts are as ubiquitous and essential as the percentage. From personal budgeting and understanding sales discounts to analyzing complex investment returns and business performance, the ability to accurately calculate and interpret percentages is a cornerstone of financial literacy. It’s not merely a numerical exercise; it’s a critical skill that empowers individuals and businesses to make informed decisions, identify opportunities, and mitigate risks. Without a firm grasp of percentages, navigating the financial landscape can feel like walking through a fog, making it challenging to truly understand the ‘why’ behind many financial figures.
This article aims to demystify percentages, breaking down the core concepts and illustrating their myriad applications within the realm of money. Whether you’re a consumer trying to decipher a discount, an investor evaluating portfolio performance, or a business owner assessing profit margins, mastering percentage calculations will significantly enhance your financial acumen. We will move beyond rote memorization of formulas to cultivate a deeper, more intuitive understanding of what percentages represent and how they tell a compelling story about financial health and opportunity.
The Core Concept: Understanding Percentages
At its heart, a percentage is a way of expressing a number as a fraction of 100. The word “percent” literally means “per hundred” or “out of one hundred.” It provides a standardized way to compare parts of different wholes, making complex data digestible and comparable. Instead of dealing with unwieldy fractions or decimals, percentages offer a universal language for proportional relationships.
What is a Percentage?
Imagine you have a pie divided into 100 slices. If you eat 25 slices, you’ve eaten 25 percent of the pie. If you’re told a store is offering 20% off, it means for every $100 of the original price, you save $20. This “out of 100” framework is crucial because it immediately provides context. It allows for quick comparisons without needing to know the original total amount first. A test score of 80% tells you immediately that the student answered 80 questions correctly out of every 100 questions, regardless of the total number of questions on the test. In finance, this standardization is incredibly powerful. When an interest rate is quoted as 5%, it means 5 units of interest for every 100 units of principal, providing a clear benchmark for cost or return.
Converting Between Decimals, Fractions, and Percentages
To effectively work with percentages, one must be adept at converting numbers between their fractional, decimal, and percentage forms. These conversions are the mathematical bedrock upon which all percentage calculations are built.
-
Decimal to Percentage: To convert a decimal to a percentage, simply multiply the decimal by 100 and add the percent symbol (%). For example, 0.25 becomes 0.25 * 100 = 25%. A more complex decimal like 0.075 becomes 7.5%.
-
Percentage to Decimal: To convert a percentage to a decimal, divide the percentage by 100 and remove the percent symbol. So, 50% becomes 50 / 100 = 0.50. Similarly, 125% becomes 125 / 100 = 1.25. This conversion is often necessary before performing calculations, as most calculators and spreadsheets work with decimals.
-
Fraction to Percentage: To convert a fraction to a percentage, first convert the fraction to a decimal by dividing the numerator by the denominator. Then, convert the resulting decimal to a percentage as described above. For instance, 1/4 becomes 1 ÷ 4 = 0.25, which then converts to 25%. If you have 3/8, it’s 3 ÷ 8 = 0.375, which is 37.5%.
-
Percentage to Fraction: To convert a percentage to a fraction, write the percentage as a fraction with 100 as the denominator, then simplify if possible. For example, 75% becomes 75/100, which simplifies to 3/4. 10% becomes 10/100, simplifying to 1/10.
Understanding these interconversions is fundamental because financial tools and reporting often present data in different forms. Being able to fluidly move between them ensures accuracy and comprehension.
The Basic Formula: Part / Whole * 100
At its core, figuring out a percentage relies on one fundamental formula:
Percentage = (Part / Whole) * 100
Let’s break down the components:
-
Part: This is the specific amount or quantity you are interested in. It’s the portion of the whole you want to express as a percentage.
-
Whole: This is the total amount, the baseline, or the original value against which the ‘part’ is being compared.
-
100: Multiplying by 100 converts the resulting decimal (which is the fraction of the whole) into a percentage.
Example: If you spent $30 on groceries from a total budget of $200, the ‘part’ is $30, and the ‘whole’ is $200.
Percentage spent = ($30 / $200) * 100 = 0.15 * 100 = 15%.
This means 15% of your budget was spent on groceries. This simple formula forms the basis for nearly every percentage calculation you’ll encounter in finance.
Practical Applications in Personal Finance
Percentages are not just abstract numbers; they are the bedrock of sound personal financial management. From everyday transactions to long-term planning, understanding how to apply percentage calculations directly impacts your wallet and financial well-being.
Calculating Discounts and Sales Tax
One of the most common daily applications of percentages is encountered during shopping.
-
Discounts: When an item is advertised as “20% off,” you’re essentially figuring out what 20% of the original price is, and then subtracting that amount.
-
To find the discount amount: Multiply the original price by the discount percentage (converted to a decimal).
- Example: A $50 shirt is 20% off. Discount = $50 * 0.20 = $10.
-
To find the final price: Subtract the discount amount from the original price, OR multiply the original price by (1 – discount percentage as a decimal).
-
Example (subtracting): Final price = $50 – $10 = $40.
-
Example (multiplying directly): Final price = $50 * (1 – 0.20) = $50 * 0.80 = $40.
-
-
-
Sales Tax: Similar to discounts, sales tax is a percentage added to the price of an item.
-
To find the tax amount: Multiply the item’s price by the sales tax percentage (as a decimal).
- Example: A $100 item with 7% sales tax. Tax = $100 * 0.07 = $7.
-
To find the total price: Add the tax amount to the item’s price, OR multiply the item’s price by (1 + sales tax percentage as a decimal).
-
Example (adding): Total price = $100 + $7 = $107.
-
Example (multiplying directly): Total price = $100 * (1 + 0.07) = $100 * 1.07 = $107.
-
-
Mastering these simple calculations can save you money and prevent surprises at the checkout.
Understanding Interest Rates
Interest rates are perhaps the most critical percentage in personal finance, affecting everything from savings accounts to mortgages.
-
Savings Accounts & Investments: When your bank account pays 1% interest, it means you’ll earn 1% of your principal balance over a specified period (usually annually).
- Example: If you have $1,000 in a savings account with a 1% annual interest rate, you’ll earn $1,000 * 0.01 = $10 in interest over the year (simple interest).
-
Loans & Credit Cards: Conversely, when you borrow money, the interest rate represents the cost of borrowing. A 15% interest rate on a loan means you’ll pay 15% of the outstanding principal in interest over a specified period.
- Example: A $5,000 loan with a 10% annual interest rate will cost you $5,000 * 0.10 = $500 in interest for that year, in addition to the principal repayment (again, simple interest for illustration).
Understanding how these percentages compound over time is even more powerful (discussed later).
Budgeting and Expense Tracking
Budgeting is fundamentally an exercise in percentages. It involves allocating a percentage of your income to various spending categories and savings goals.
-
Percentage of Income Spent: To determine what percentage of your income goes to a specific category (e.g., housing, food), divide the amount spent on that category by your total income and multiply by 100.
- Example: If your monthly income is $4,000 and you spend $1,200 on rent. Rent percentage = ($1,200 / $4,000) * 100 = 30%. This helps you adhere to budgeting rules like the popular 50/30/20 rule (50% needs, 30% wants, 20% savings/debt repayment).
-
Tracking Progress: You can also track your spending against your budget. If you budgeted $500 for groceries and spent $400, you’ve used ($400 / $500) * 100 = 80% of your grocery budget, leaving 20% remaining.
Savings Goals and Progress
Percentages are excellent for monitoring progress towards financial goals.
-
Reaching a Goal: If your goal is to save $10,000 and you’ve currently saved $3,000, you’ve achieved ($3,000 / $10,000) * 100 = 30% of your goal. This tangible progress can be highly motivating.
-
Contribution Rates: Many financial advisors recommend saving a certain percentage of your income for retirement (e.g., 10-15%). Calculating your current contribution rate helps you assess if you’re on track.
Percentages in Business and Investing
Moving beyond personal finance, percentages are the lingua franca of business and investment analysis. They provide critical insights into performance, profitability, and growth.
Analyzing Profit Margins
For businesses, profit margins are key indicators of financial health and operational efficiency.
-
Gross Profit Margin: This tells you the percentage of revenue left after subtracting the cost of goods sold (COGS).
-
Formula: (Gross Profit / Revenue) * 100
-
Example: If a company has $1,000,000 in revenue and $400,000 in COGS, its Gross Profit is $600,000. Gross Profit Margin = ($600,000 / $1,000,000) * 100 = 60%.
-
-
Net Profit Margin: This reveals the percentage of revenue remaining after all expenses (including COGS, operating expenses, interest, and taxes) have been deducted. It’s a true measure of a company’s bottom-line profitability.
-
Formula: (Net Profit / Revenue) * 100
-
Example: If the same company has a Net Profit of $200,000, its Net Profit Margin = ($200,000 / $1,000,000) * 100 = 20%.
-

These percentages are vital for comparing a company’s performance against competitors or its own historical data.
Calculating Return on Investment (ROI)
ROI is a fundamental metric for evaluating the efficiency of an investment or comparing the efficiency of several different investments. It’s expressed as a percentage.
-
Formula: ((Current Value of Investment – Original Cost of Investment) / Original Cost of Investment) * 100
-
Example: You invested $10,000 in stocks, and they are now worth $12,000.
- ROI = (($12,000 – $10,000) / $10,000) * 100 = ($2,000 / $10,000) * 100 = 0.20 * 100 = 20%.
A positive ROI means the investment generated a profit, while a negative ROI indicates a loss.
Understanding Market Share and Growth Rates
Businesses often use percentages to understand their position in the market and how quickly they are growing.
-
Market Share: This is the percentage of total sales in a market that a particular company or product has.
- Example: If the total market for smartphones is 100 million units sold annually, and Company X sells 30 million units, its market share is (30 million / 100 million) * 100 = 30%.
-
Growth Rates: These percentages measure the increase or decrease in a financial metric over a period.
-
Formula: ((Current Period Value – Previous Period Value) / Previous Period Value) * 100
-
Example: A company’s revenue increased from $1,000,000 last year to $1,200,000 this year.
- Growth Rate = (($1,200,000 – $1,000,000) / $1,000,000) * 100 = ($200,000 / $1,000,000) * 100 = 0.20 * 100 = 20%.
-
These percentages help management, investors, and analysts gauge a company’s competitive standing and trajectory.
Stock Price Changes and Portfolio Performance
For individual investors, percentages are crucial for tracking investment performance.
-
Stock Price Change: The daily or period-over-period percentage change in a stock’s price.
-
Formula: ((Current Price – Previous Price) / Previous Price) * 100
-
Example: A stock went from $100 to $105. Change = (($105 – $100) / $100) * 100 = 5%.
-
-
Portfolio Performance: The overall percentage return of your entire investment portfolio. This is calculated similar to ROI, but for the aggregate value of all your holdings.
Advanced Scenarios and Common Pitfalls
While the basic percentage formula is straightforward, real-world financial scenarios often introduce nuances that require careful application and understanding.
Percentage Increase vs. Percentage Decrease
It’s crucial to understand that a percentage increase followed by an identical percentage decrease does not always return you to the original value.
-
Example: A stock worth $100 increases by 50%. New value = $100 * 1.50 = $150.
-
If it then decreases by 50% from its new value. Decrease amount = $150 * 0.50 = $75.
-
Final value = $150 – $75 = $75.
-
You are not back at $100. This is because the base (the ‘whole’) for the second calculation ($150) was different from the base for the first calculation ($100). Always be mindful of which ‘whole’ you are referencing.
-
Compound Interest and Growth
Simple interest (calculated only on the principal) is easy, but most financial growth (and debt) involves compound interest. Compound interest means that interest is earned not only on the initial principal but also on the accumulated interest from previous periods.
-
Example (Compound Interest): If you invest $1,000 at 10% annual interest, compounded annually:
-
Year 1: $1,000 * 0.10 = $100 interest. Total = $1,100.
-
Year 2: $1,100 * 0.10 = $110 interest. Total = $1,210.
-
The percentage is always applied to the new total, leading to exponential growth.
-
This concept is vital for understanding long-term investments, retirement planning, and the true cost of loans.
Avoiding Misinterpretations
Context is paramount when interpreting percentages. A 100% growth in a small startup’s revenue might be a few thousand dollars, while a 1% growth in a multi-billion dollar corporation could be tens of millions. Both are 100% and 1%, but their absolute impact differs vastly. Similarly, a percentage point change is different from a percentage change. If an interest rate goes from 5% to 6%, that’s a 1 percentage point increase, but it’s a ( (6-5)/5 ) * 100 = 20% increase in the interest rate itself. Always clarify the base and what the percentage is actually measuring.
Tools and Tips for Accurate Calculation
While understanding the theory is vital, practical application often benefits from the right tools and habits.
Using Calculators and Spreadsheets
For complex calculations or when dealing with many numbers, digital tools are invaluable.
-
Basic Calculators: Most scientific and even basic calculators have a ‘%’ key. Be careful with how it functions, as behavior can vary. Generally, to find 20% of 50, you’d input ’50 * 20 % =’. To subtract 20% from 50, you might input ’50 – 20 % =’. Practice with your specific calculator.
-
Spreadsheets (Excel, Google Sheets): These are perhaps the most powerful tools for financial percentage calculations. They allow you to:
-
Enter formulas directly (e.g.,
=A1/B1*100for(Part/Whole)*100). -
Format cells to automatically display numbers as percentages (e.g.,
0.25becomes25%). -
Build complex models for budgeting, investment analysis, and financial forecasting, where percentages play a central role. Learning basic spreadsheet functions for percentages is a highly valuable financial skill.
-
Mental Math Shortcuts
For quick estimations, knowing a few mental math tricks can be very helpful.
-
Finding 10%: To find 10% of any number, simply move the decimal point one place to the left. (e.g., 10% of $250 is $25.0).
-
Finding 1%: Move the decimal point two places to the left. (e.g., 1% of $250 is $2.50).
-
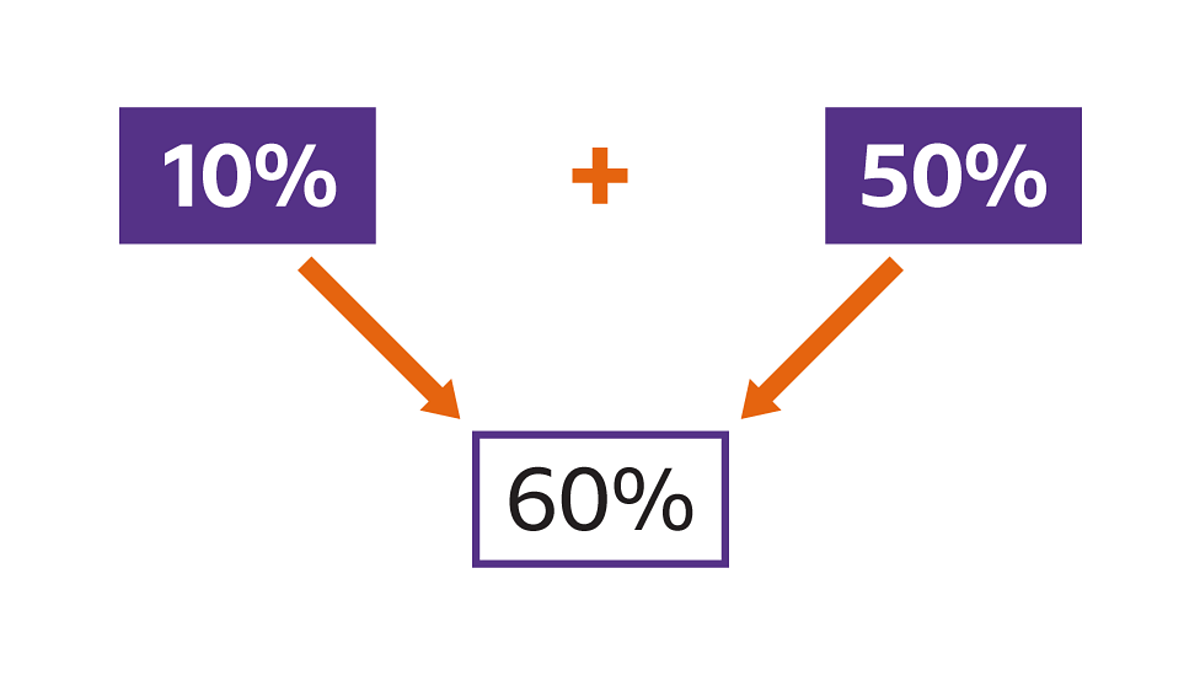
Using 10% as a base: To find 20%, double the 10%. To find 5%, halve the 10%. To find 15%, add 10% and 5%.
-
Rounding: For quick estimates, round numbers to make them easier to work with. (e.g., for 18% of $98, estimate 20% of $100, which is $20).
These shortcuts are not for precision but for rapidly gauging the magnitude of a percentage, which is often sufficient for initial decision-making.
Double-Checking Your Work
Accuracy in financial calculations is paramount. A small error can lead to significant misjudgments.
-
Recalculate: If possible, re-do the calculation using a different method or tool.
-
Estimate: Mentally estimate the answer to see if your calculated result is in the right ballpark. If 20% of $500 is calculated as $10, something is clearly wrong.
-
Sense Check: Does the answer make logical sense in the context of the problem? If you’re calculating a discount, the final price should always be less than the original. If you’re calculating growth, the new number should be higher.

Conclusion
The ability to “figure a percentage of something” is far more than a simple arithmetic skill; it is a fundamental pillar of financial literacy. From the grocery store aisle to the boardroom, percentages provide the lens through which we interpret discounts, evaluate investment performance, manage budgets, and understand economic trends. They standardize comparisons, reveal hidden costs or benefits, and empower us to make informed, intelligent financial decisions.
By understanding the core concept of percentages, mastering the basic conversion methods, and applying the simple (Part / Whole) * 100 formula across diverse financial scenarios, you gain a powerful analytical tool. Recognizing the nuances of percentage increase versus decrease, appreciating the impact of compounding, and critically interpreting percentage data will elevate your financial acumen even further.
In an increasingly data-driven world, where financial information is constantly presented in percentage terms, a firm grasp of this concept is no longer optional—it is essential. Embrace the clarity and insight that percentage calculations offer, and you will unlock a deeper understanding of your personal finances, business operations, and the broader economic landscape, empowering you to navigate the world of money with confidence and precision.
aViewFromTheCave is a participant in the Amazon Services LLC Associates Program, an affiliate advertising program designed to provide a means for sites to earn advertising fees by advertising and linking to Amazon.com. Amazon, the Amazon logo, AmazonSupply, and the AmazonSupply logo are trademarks of Amazon.com, Inc. or its affiliates. As an Amazon Associate we earn affiliate commissions from qualifying purchases.