In the realm of finance, numbers tell a story, but percentages provide the context. Whether you are tracking the growth of a retirement portfolio, evaluating the success of a side hustle, or analyzing the quarterly revenue of a Fortune 500 company, understanding how to figure a percentage increase is a fundamental skill. It is the bridge between raw data and actionable insight. Without the ability to calculate and interpret these shifts, an investor or business owner is essentially navigating without a compass.
A percentage increase quantifies the growth of a value over time relative to its starting point. It allows for a “level playing field” comparison between different assets or time periods. For instance, a $500 gain on a $1,000 investment is vastly different from a $500 gain on a $1,000,000 investment. This guide will provide a comprehensive deep dive into the mechanics of percentage increase, its application in wealth management, and its critical role in strategic business analysis.
The Mathematical Foundation of Percentage Calculations
Before applying these concepts to complex financial portfolios, one must master the core arithmetic. The logic behind percentage increase is straightforward, yet it is frequently misapplied in high-pressure financial reporting.
Defining the Basic Formula
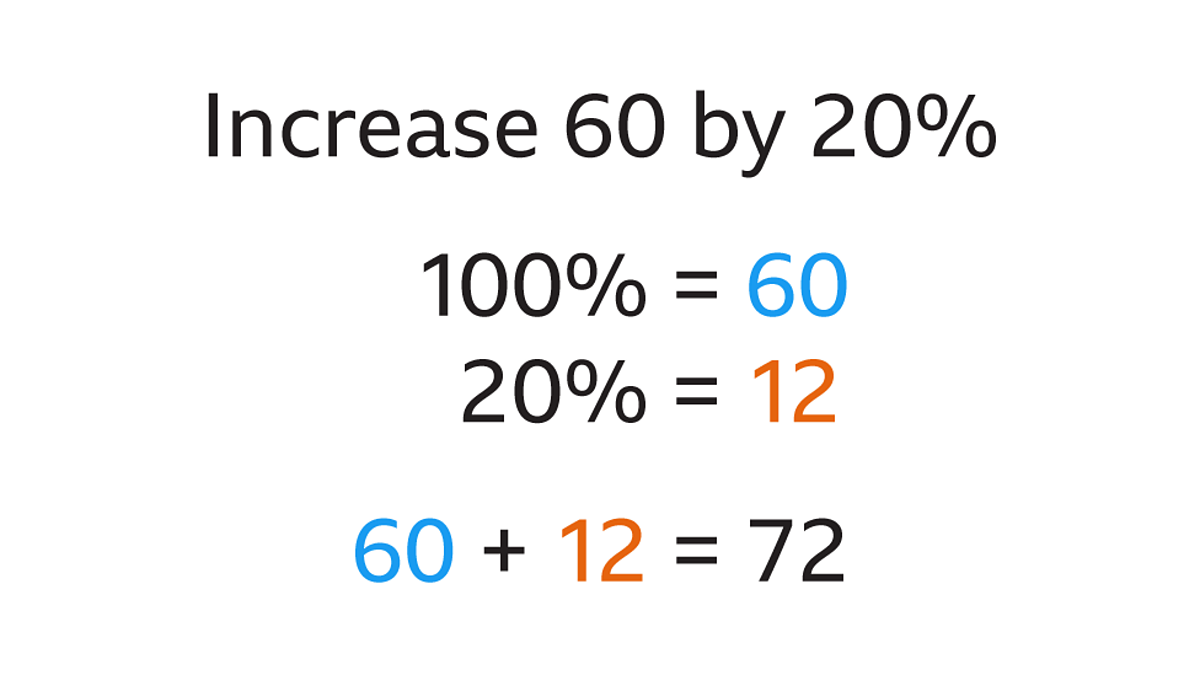
The standard formula for determining a percentage increase is:
((New Value – Original Value) / Original Value) × 100
In financial terms, we often refer to the “Original Value” as the “Initial Principal” or “Base Amount,” and the “New Value” as the “Current Market Value” or “Ending Balance.” The numerator (New Value – Original Value) represents the absolute change, often called the “delta.” By dividing this delta by the original value, you determine the growth relative to where you started.
Step-by-Step Calculation Guide
To illustrate, imagine you purchased a share of a technology ETF for $150 last year, and today it is trading at $195.
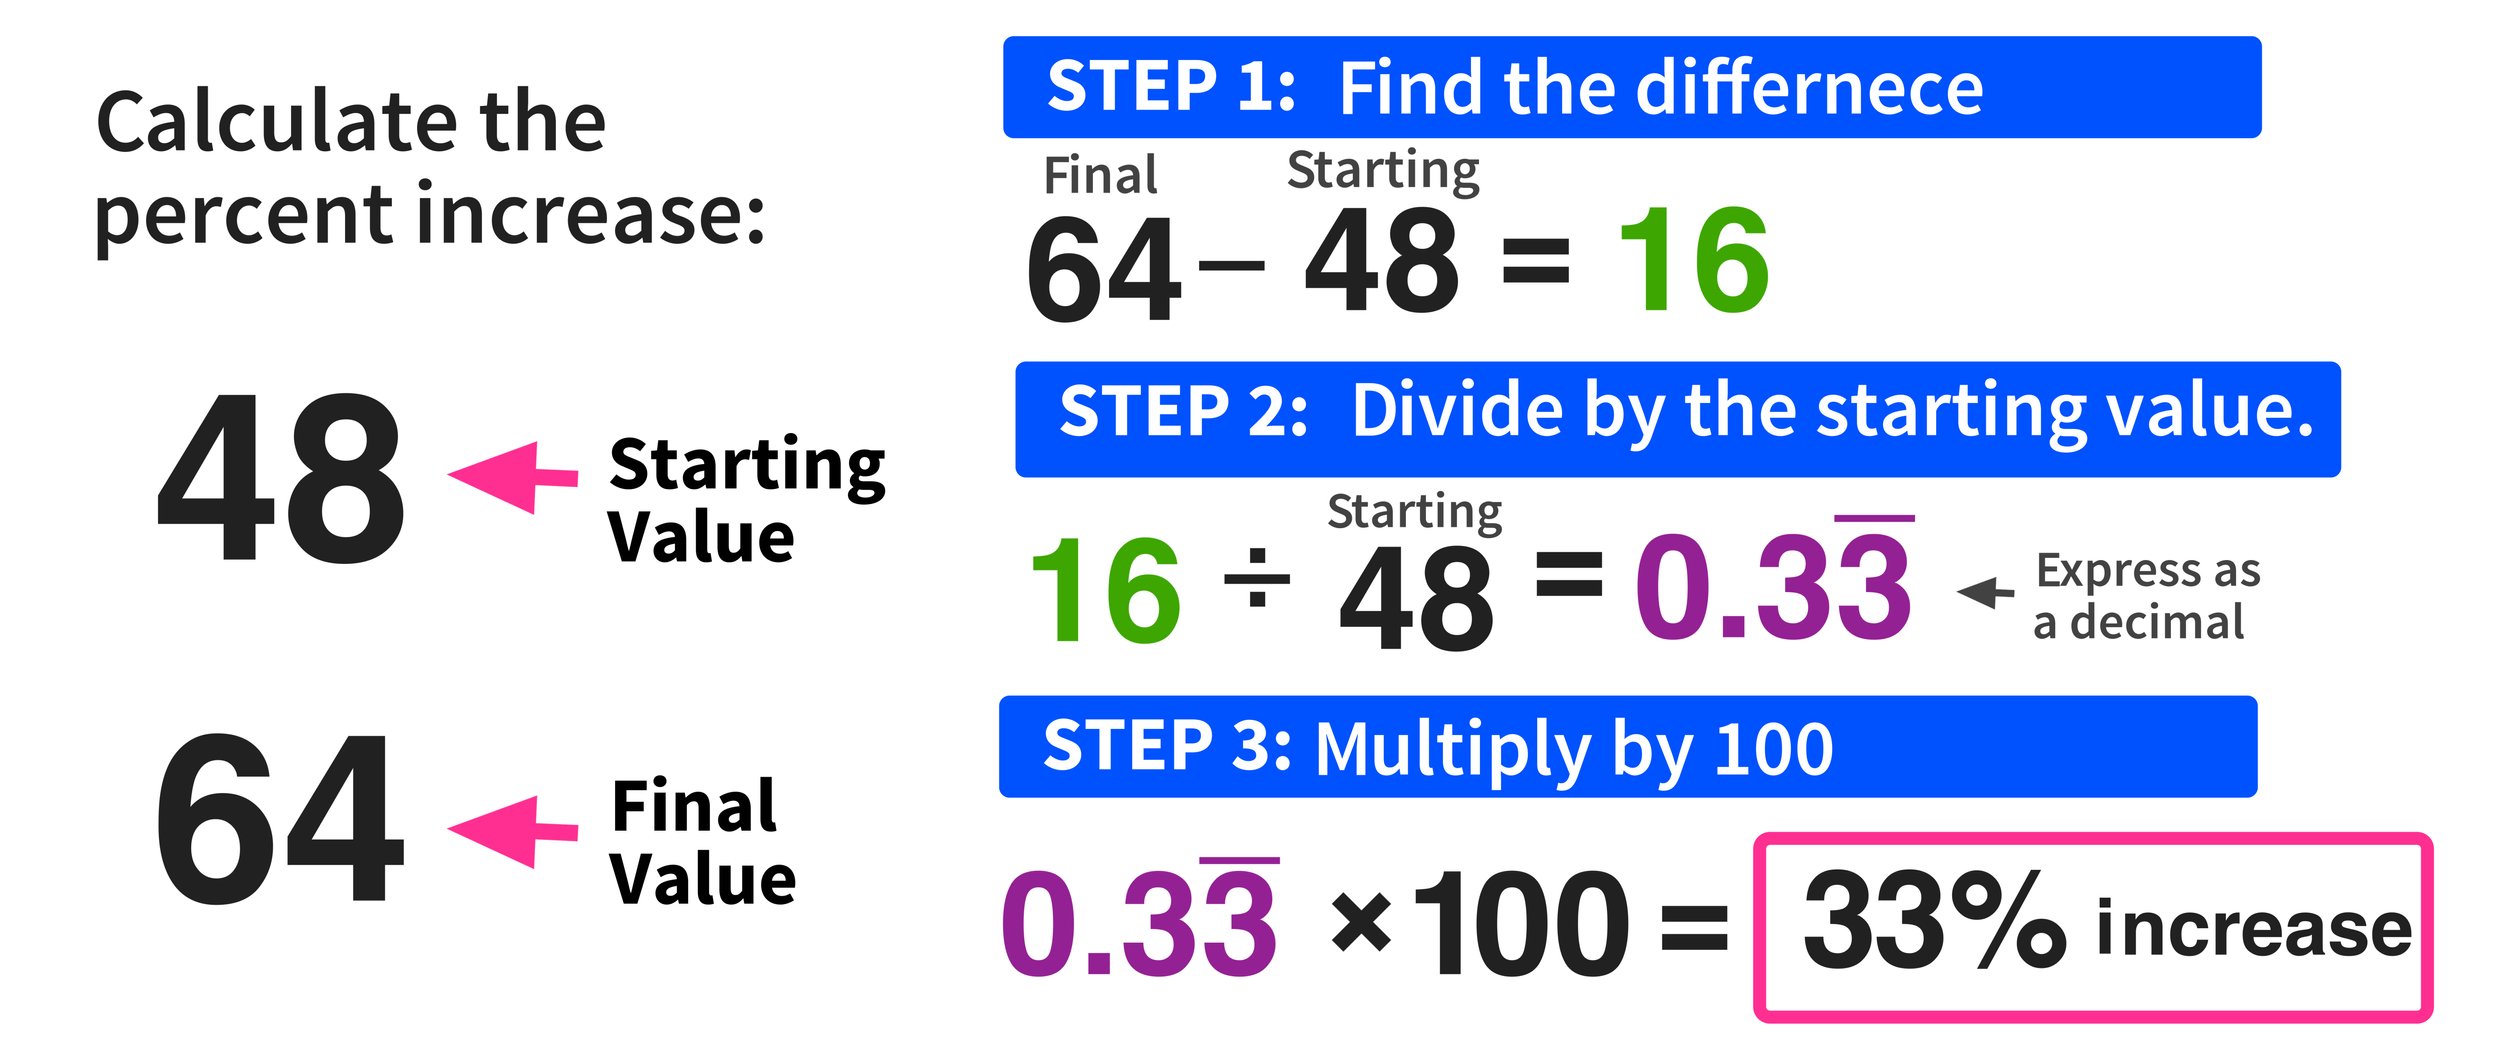
- Find the Difference: Subtract the original price from the current price ($195 – $150 = $45).
- Divide by the Original: Divide that gain by the starting price ($45 / $150 = 0.3).
- Convert to Percentage: Multiply the decimal by 100 to get the percentage (0.3 × 100 = 30%).
In this scenario, your investment has seen a 30% increase. This single figure tells you more about the efficiency of your capital than the $45 raw gain ever could.
Common Pitfalls to Avoid
A frequent error in financial calculation is dividing by the new value instead of the original value. This is known as confusing “markup” with “margin.” In the context of growth, always anchor your division to the starting point. Another common mistake is failing to account for the time horizon. A 20% increase over one month is an extraordinary signal of momentum, whereas a 20% increase over ten years might actually lag behind the rate of inflation, resulting in a loss of real purchasing power.
Leveraging Percentage Increase in Investment Strategy
For the individual investor, percentage increase is the primary metric for evaluating performance. It moves the focus away from the “noise” of daily price fluctuations and toward the “signal” of long-term wealth accumulation.
Analyzing Portfolio Performance
When reviewing a brokerage statement, many investors focus on the total balance. However, savvy investors look at the percentage increase of individual asset classes. By calculating the percentage growth of your domestic equities versus your international bonds, you can identify which sectors of your portfolio are over-performing. This data is essential for “rebalancing”—the process of selling assets that have increased significantly (taking profits) and buying assets that are undervalued, thereby maintaining your desired risk profile.
Understanding the Power of Compound Growth
The concept of percentage increase becomes truly transformative when viewed through the lens of compounding. Compounding occurs when the percentage increase of one period is applied to the new, higher balance of the next period.
For example, a $10,000 investment with a 10% annual increase doesn’t just grow by $1,000 every year. In the second year, that 10% is calculated on $11,000, resulting in an $1,100 increase. Over decades, the “percentage increase on the previous increase” is what builds generational wealth. Understanding the math behind this allows investors to project future values and set realistic retirement goals.
Benchmarking Against Market Indices
Calculating your own percentage increase is only half the battle; you must also know how that increase compares to the broader market. If your portfolio increased by 12% last year, that sounds successful in a vacuum. However, if the S&P 500 increased by 18% in the same period, your “increase” actually represents an underperformance. In finance, we call this “Alpha.” Seeking positive Alpha means striving for a percentage increase that exceeds a relevant benchmark.
Navigating Corporate Finance and Revenue Metrics
In a business context, percentage increase is the ultimate KPI (Key Performance Indicator). It is used by stakeholders to determine the health, scalability, and viability of a company.
Year-over-Year (YoY) Growth Analysis
Corporations rarely look at month-to-month changes in isolation because seasonal fluctuations can skew the data (e.g., a retail store will always see a massive increase in December). Instead, they utilize Year-over-Year (YoY) calculations. By figuring the percentage increase between Q3 of this year and Q3 of last year, a business can filter out seasonality and see the true trajectory of its growth. A consistent YoY percentage increase is often a prerequisite for attracting venture capital or securing favorable loan terms.
Profit Margins and Cost Escalation
Percentage increase is not only applied to revenue but also to expenses. If a business’s revenue increases by 10% but its operating costs increase by 15%, the company is actually becoming less profitable despite selling more. This is why “Margin Expansion” is a critical concept. Managers must constantly monitor the percentage increase in the cost of goods sold (COGS). If the price of raw materials increases by 5%, the business must decide whether to absorb that cost or increase their own prices by a corresponding percentage to maintain their net margin.
Market Share Expansion
In competitive industries, companies track their “Market Share Percentage.” If a company holds 10% of the market and moves to 12%, that is a 2% “percentage point” increase, but it represents a 20% increase in their total market dominance (2/10 = 0.20). Understanding this distinction is vital for strategic branding and marketing departments as they fight for a larger slice of the consumer pie.
Utilizing Financial Tools for Precision Growth Tracking
While the math can be done on a napkin, professional finance requires speed and accuracy. Modern financial tools have made calculating percentage increases nearly instantaneous, but they require a structured approach to be effective.
Automating Calculations with Excel and Google Sheets
In the professional world, spreadsheets are the primary tool for financial modeling. To calculate percentage increase in a cell, one would use a formula like: =(B2-A2)/A2.
By dragging this formula across hundreds of rows, an analyst can instantly see the growth trends of every product line in a company’s catalog. Advanced users utilize “Conditional Formatting” to highlight cells where the percentage increase falls below a certain threshold, providing an early warning system for declining business units.
The Importance of CAGR (Compound Annual Growth Rate)
Standard percentage increase can sometimes be misleading if the growth is volatile. For instance, an investment that goes up 50% one year and down 20% the next has a different “feel” than one that grows 15% steadily. This is where the Compound Annual Growth Rate (CAGR) comes in. CAGR provides a smoothed annual rate of growth over a period of time, effectively telling you what the steady percentage increase would have been if the growth had been constant. For long-term financial planning, CAGR is a more accurate tool than a simple average of yearly percentage increases.
Real-Time Financial Dashboards
Today’s online income earners and small business owners use dashboards like QuickBooks, Mint, or Personal Capital. These tools automatically calculate percentage increases across various categories—such as “Total Net Worth,” “Monthly Recurring Revenue (MRR),” or “Customer Acquisition Cost (CAC).” By keeping these percentages front and center, entrepreneurs can make data-driven decisions. If the percentage increase in “Ad Spend” is outpacing the percentage increase in “Sales,” it is a clear signal to pivot the marketing strategy.

Conclusion: Mastering the Math of Success
Figuring a percentage increase is more than a mathematical exercise; it is a vital discipline for anyone serious about their financial future. In personal finance, it allows you to see past the dollar signs and understand the true velocity of your wealth. In the business world, it provides the metrics necessary to scale operations, satisfy investors, and outpace the competition.
By mastering the formula, understanding the implications of compounding, and utilizing the right analytical tools, you transform raw data into a strategic roadmap. Whether you are aiming for a 5% increase in your savings rate or a 50% increase in your business’s bottom line, the journey begins with knowing exactly how to measure the distance you’ve traveled. Numbers may define the state of your finances, but percentages define your progress.
aViewFromTheCave is a participant in the Amazon Services LLC Associates Program, an affiliate advertising program designed to provide a means for sites to earn advertising fees by advertising and linking to Amazon.com. Amazon, the Amazon logo, AmazonSupply, and the AmazonSupply logo are trademarks of Amazon.com, Inc. or its affiliates. As an Amazon Associate we earn affiliate commissions from qualifying purchases.