
In the realm of finance, percentages are the universal language of growth, risk, and value. Whether you are calculating the return on a high-growth stock, determining the interest rate on a mortgage, or evaluating the profit margins of a startup, mastery over percentages is non-negotiable. While the mathematical formula for a percentage is relatively simple, its application within personal and business finance requires a nuanced understanding of how these figures influence long-term wealth accumulation and capital preservation. To navigate the complexities of the modern economy, one must move beyond basic arithmetic and learn to wield percentages as a strategic tool for financial decision-making.

Understanding the Fundamentals: Why Percentages Matter in Personal Finance
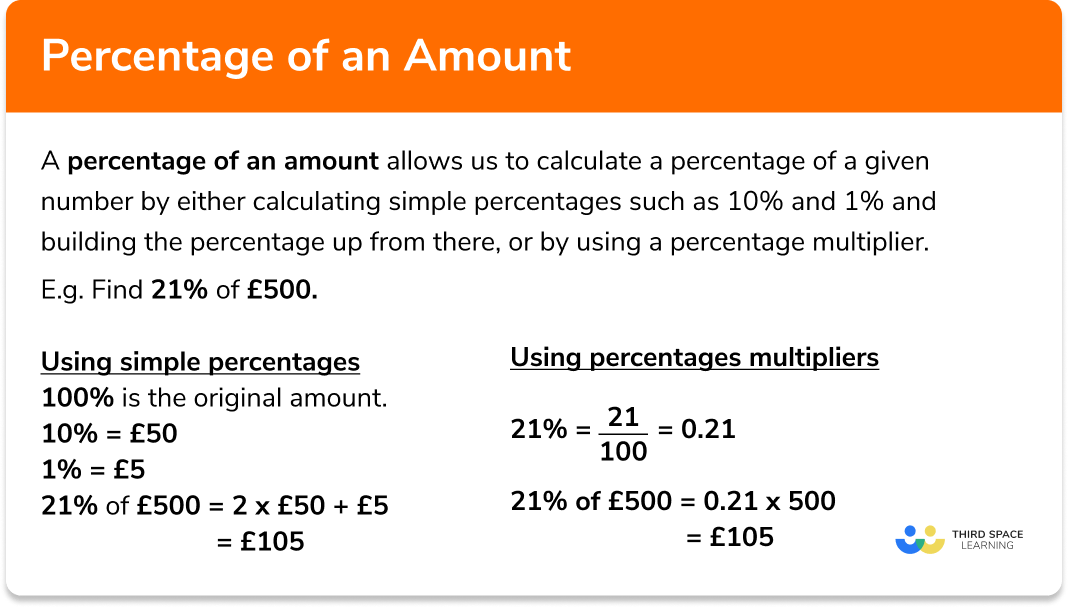
At its core, a percentage represents a fraction of 100. In financial terms, this “fraction” defines the scale of your progress or the cost of your liabilities. Understanding how to calculate a percentage of a number is the first step in auditing your financial health. The standard formula—(Percentage / 100) × Total Value = Part—serves as the foundation for nearly every financial transaction you will encounter.
The Basic Formula and Financial Logic
To find a percentage of a number, you convert the percentage into a decimal by moving the decimal point two places to the left and then multiply it by the total amount. For example, if you want to find 15% of a $5,000 investment, you multiply 0.15 by 5,000 to arrive at $750. In the context of budgeting, this simple calculation allows you to allocate specific portions of your income toward essential categories like housing, savings, and discretionary spending. Professional financial planners often recommend the 50/30/20 rule, where 50% of income goes to needs, 30% to wants, and 20% to savings. Without the ability to calculate these percentages accurately, maintaining a disciplined budget becomes an exercise in guesswork.
Percentages vs. Basis Points
As you move into more sophisticated financial environments, you will often hear the term “basis points” (BPS). One basis point is equal to 1/100th of 1 percent, or 0.01%. While it may seem like a minute detail, basis points are the standard measure for interest rates and investment fees. For instance, a 50-basis-point increase in a mortgage rate (0.50%) can result in tens of thousands of dollars in additional interest over the life of a loan. Understanding the relationship between percentages and basis points allows you to evaluate the “hidden” costs of financial products, such as management expense ratios (MERs) on mutual funds, which can quietly erode your wealth if left unchecked.
Practical Applications in Investing and Wealth Building
For investors, percentages are the primary metric used to measure performance. Raw dollar gains are secondary to percentage returns because percentages provide the context necessary to compare different asset classes. A $1,000 gain on a $10,000 investment (10%) is far more significant than a $1,000 gain on a $100,000 investment (1%).
Calculating Compound Interest and Portfolio Growth
Compound interest is often described as the eighth wonder of the world, and it is entirely driven by percentage-based growth. When you calculate the percentage of a number in the context of compounding, you are not just looking at a one-time gain; you are looking at the new “base” for the next period’s calculation. If your portfolio grows by 7% annually, you are multiplying your total balance by 1.07 each year. Over decades, this exponential growth creates a snowball effect where the interest earned on previous interest begins to outpace your original contributions. Mastering this calculation is essential for retirement planning, as it allows you to project how much you need to save today to reach a specific target in the future.
Dividend Yields and Reinvestment Strategies
Income-focused investors rely heavily on the dividend yield, which is a percentage calculated by dividing the annual dividend payment by the current stock price. If a company pays $2.00 in annual dividends and the stock is trading at $50, the dividend yield is 4%. This percentage allows investors to compare the income-generating potential of a stock against other “safe” assets like Treasury bonds or high-yield savings accounts. By calculating the percentage of these dividends relative to your total portfolio, you can determine your “yield on cost,” a metric that tracks the income generated based on your original investment rather than current market value.
Assessing Risk and Drawdowns
Understanding percentages is equally important for risk management. A “drawdown” refers to a peak-to-trough decline in an investment’s value, expressed as a percentage. One of the most critical lessons in finance is the “asymmetry of loss.” If an investment drops by 50%, it does not require a 50% gain to break even; it requires a 100% gain. This is because the percentage is being calculated from a smaller base. Recognizing this mathematical reality encourages investors to focus on capital preservation and avoid the high-percentage losses that can take years to recover from.
Percentages in Business Management and Profitability
In the corporate world, percentages are used to measure efficiency, profitability, and scalability. Business owners who fail to grasp the nuances of percentage-based accounting often struggle with cash flow management and pricing strategies.
Gross and Net Profit Margins
Profitability is rarely measured in absolute dollars alone; it is measured by “margins.” The gross profit margin is the percentage of revenue that exceeds the cost of goods sold (COGS). For example, if a product sells for $200 and costs $120 to manufacture, the gross profit is $80, and the gross margin is 40%. The net profit margin goes a step further, subtracting all operating expenses, taxes, and interest. A business with high revenue but a low net profit margin (e.g., 2%) is highly vulnerable to market fluctuations. By tracking these percentages over time, management can identify whether the company is becoming more efficient or if rising costs are eating into the bottom line.
Markup vs. Margin: Avoiding Costly Mistakes
One of the most common errors in business finance is confusing “markup” with “margin.” Markup is the percentage added to the cost to reach a selling price, while margin is the percentage of the selling price that is profit. If you want a 25% margin on a product that costs $75, you cannot simply add a 25% markup. Adding 25% to $75 results in a $93.75 sale price, but your margin would only be 20% ($18.75 / $93.75). To achieve a 25% margin, you must divide the cost by the inverse of the margin (75 / 0.75), resulting in a $100 sale price. This distinction is vital for maintaining profitability and ensuring that your pricing strategy aligns with your financial goals.
Tax Planning and Deductions
Taxes are almost always calculated as a percentage of income or capital gains. In a progressive tax system, understanding your “marginal tax rate”—the percentage of tax paid on your next dollar of income—is crucial for effective tax planning. High-income earners often use percentage-based deductions, such as contributing 15% of their salary to a 401(k), to lower their taxable income. Furthermore, understanding the percentage of your total income that goes toward various taxes (federal, state, and payroll) allows you to calculate your “effective tax rate,” which is the true percentage of your income that you lose to the government each year.
Mastering Consumer Math: Savings, Loans, and Credit
In our daily lives, we are constantly bombarded with percentage-based offers, from credit card interest rates to store discounts. Being able to perform these calculations on the fly is a hallmark of financial literacy.
Deciphering APR and Interest Rates
When you borrow money, the cost of that capital is expressed as the Annual Percentage Rate (APR). This figure includes not only the interest rate but also any fees or additional costs associated with the loan. When comparing financial products, the APR is the most accurate percentage to use, as it represents the true yearly cost of the debt. For credit cards, where interest is often compounded daily, even a small percentage difference can lead to a significant debt spiral. By calculating the monthly interest percentage (APR divided by 12) and applying it to your average daily balance, you can see exactly how much your debt is costing you in real-time.
Managing Debt-to-Income Ratios
Lenders use percentages to determine your creditworthiness, specifically the Debt-to-Income (DTI) ratio. This is the percentage of your gross monthly income that goes toward paying debts. Generally, a DTI of 36% or lower is considered healthy, with no more than 28% of that going toward mortgage or rent payments. If your DTI exceeds these percentages, you may be denied a loan or charged a higher interest rate. Monitoring your own DTI percentage allows you to understand how much additional debt you can safely handle before it threatens your financial stability.
Calculating Discounts and Value for Money
Retailers often use percentages to create a sense of urgency. A “30% off” sale sounds appealing, but savvy consumers calculate the actual dollar savings to determine if the purchase is truly a value. Moreover, understanding “percentage increase” is helpful when tracking inflation. If the price of your favorite grocery staples has increased by 10% while your wages have remained stagnant, your purchasing power has effectively decreased. Being able to quantify these shifts helps you adjust your spending habits and seek out better value.
Leveraging Tools and Mental Models for Financial Calculations
While calculators and spreadsheets are ubiquitous, developing the ability to perform mental percentage calculations and using advanced tools for financial modeling can give you a competitive edge.
The Rule of 72 and Quick Mental Math
For quick estimates, the “Rule of 72” is an invaluable mental model. By dividing 72 by your expected annual percentage return, you can estimate how many years it will take for your money to double. For example, at an 8% return, your investment will double in roughly 9 years (72 / 8 = 9). For everyday calculations, remember that 10% is simply moving the decimal one place to the left, and 5% is half of that. If you are at a restaurant and want to leave a 20% tip on a $64 bill, 10% is $6.40, so 20% is $12.80. These quick mental shortcuts ensure that you are never caught off guard in financial situations.

Leveraging Spreadsheets for Complex Financial Modeling
For more complex scenarios, such as amortizing a loan or projecting the future value of a business, spreadsheets are essential. Modern tools allow you to use functions like =PMT for loan payments or =FV for future value, which handle the underlying percentage math automatically. However, the software is only as good as the logic you provide. Understanding how to structure these percentage-based formulas—ensuring you are using the correct decimal equivalents and compounding periods—is what separates a basic user from a financial expert.
Ultimately, knowing how to do percentages of a number is about more than just getting the right answer on a math test. It is about understanding the mechanics of wealth. By mastering these calculations, you gain the clarity needed to evaluate opportunities, minimize costs, and build a secure financial future. Whether you are managing a household budget or a multi-million dollar corporation, the percentage remains the most powerful indicator of financial health and potential.
aViewFromTheCave is a participant in the Amazon Services LLC Associates Program, an affiliate advertising program designed to provide a means for sites to earn advertising fees by advertising and linking to Amazon.com. Amazon, the Amazon logo, AmazonSupply, and the AmazonSupply logo are trademarks of Amazon.com, Inc. or its affiliates. As an Amazon Associate we earn affiliate commissions from qualifying purchases.