
Inflation, the silent thief of purchasing power, is a fundamental economic concept that impacts everyone, from individual consumers to large corporations and national economies. Understanding how to count the inflation rate is not merely an academic exercise; it’s a critical skill for making informed financial decisions, planning for the future, and interpreting economic news. In essence, inflation measures the rate at which the general level of prices for goods and services is rising, and subsequently, the purchasing power of currency is falling. A consistent rise in prices means your money buys less today than it did yesterday. This article will demystify the process of measuring inflation, focusing on the primary tools and methodologies employed by economists and financial institutions, and explain its profound implications for your financial well-being.
Understanding the Fundamentals of Inflation Measurement
Before delving into the specifics of calculation, it’s crucial to grasp the foundational principles behind inflation measurement. Inflation is not a measure of how much the price of one item has changed; rather, it reflects the average change across a broad spectrum of goods and services.
Defining Inflation and Its Economic Impact
At its core, inflation is the rate of increase in the general price level of an economy over a period of time. Conversely, deflation is a general fall in prices, and disinflation is a slowdown in the rate of inflation. Inflation erodes the purchasing power of money, meaning that each unit of currency buys fewer goods and services. For instance, if the inflation rate is 3%, an item that cost $100 last year would cost $103 this year, requiring you to spend more to maintain the same standard of living. This phenomenon has far-reaching effects on savings, investments, wages, and consumer behavior, making its accurate measurement indispensable for economic stability and personal financial planning.
The Importance of a Price Index and the Base Period
To measure inflation accurately, economists do not track individual prices in isolation. Instead, they construct a “market basket” of representative goods and services that a typical consumer or producer buys. The total cost of this market basket is then compared over time using a “price index.” A price index normalizes prices to a “base period” – an arbitrary starting point (often a year or a range of years) assigned an index value of 100. All subsequent price changes are then expressed relative to this base period. This approach allows for a standardized way to compare price levels across different time periods, providing a clear picture of how overall prices have changed. Without a base period and a comprehensive index, it would be impossible to quantify the aggregate price changes across an entire economy.
Key Measures of Inflation: CPI, PPI, and PCE
While various indicators exist, the most commonly cited and influential measures of inflation are:
-
Consumer Price Index (CPI): This is arguably the most widely recognized measure, reflecting the average change over time in the prices paid by urban consumers for a market basket of consumer goods and services.
-
Producer Price Index (PPI): The PPI measures the average change over time in the selling prices received by domestic producers for their output. It’s often considered a leading indicator as changes in producer prices can eventually translate into changes in consumer prices.
-
Personal Consumption Expenditures (PCE) Price Index: This measure, compiled by the Bureau of Economic Analysis, tracks the prices of goods and services purchased by consumers. It is the preferred inflation measure of the U.S. Federal Reserve for monetary policy decisions due to its broader coverage and dynamic weighting.
Each of these indices serves a distinct purpose and provides different insights into inflationary pressures within the economy.
The Consumer Price Index (CPI): Your Everyday Inflation Barometer
The Consumer Price Index (CPI) is the go-to metric for understanding how inflation impacts the average household. It’s a broad measure that captures the cost of living and is frequently used to adjust wages, social security benefits, and tax brackets.
What is the CPI and How is it Constructed?
The CPI is a statistical estimate constructed by surveying the prices of a vast array of goods and services purchased by urban consumers. In the United States, the Bureau of Labor Statistics (BLS) is responsible for this monumental task. They survey thousands of households to determine what goods and services are typical purchases, creating a “market basket” that includes everything from food and housing to transportation, medical care, education, and recreation. Each item in this basket is weighted according to its importance in the average consumer’s budget. For example, housing typically holds a larger weight than recreational activities because it represents a more significant portion of household spending. This meticulous construction ensures the CPI reflects real-world spending patterns.
The CPI Calculation Formula
Once the market basket is defined and its cost in various periods is known, the CPI can be calculated. The formula for the CPI in any given year is:
$$ text{CPI} = left( frac{text{Cost of Market Basket in Current Year}}{text{Cost of Market Basket in Base Year}} right) times 100 $$
Let’s illustrate with a simplified example:
Assume a market basket consists of just three items: bread, milk, and gasoline.
| Item | Quantity (per month) | Price in Base Year (Year 1) | Price in Current Year (Year 2) |
| :——- | :——————- | :————————– | :—————————– |
| Bread | 10 loaves | $2.00 | $2.20 |
| Milk | 4 gallons | $3.50 | $3.80 |
| Gasoline | 20 gallons | $3.00 | $3.50 |
Cost of Market Basket in Base Year (Year 1):
$(10 times $2.00) + (4 times $3.50) + (20 times $3.00)$
$= $20.00 + $14.00 + $60.00 = $94.00$
Cost of Market Basket in Current Year (Year 2):
$(10 times $2.20) + (4 times $3.80) + (20 times $3.50)$
$= $22.00 + $15.20 + $70.00 = $107.20$
If the Base Year (Year 1) CPI is set at 100:
CPI for Current Year (Year 2):
$$ text{CPI}_{text{Year 2}} = left( frac{$107.20}{$94.00} right) times 100 approx 114.04 $$
This means that prices, on average, have increased by about 14.04% since the base year.
Calculating the Inflation Rate from CPI
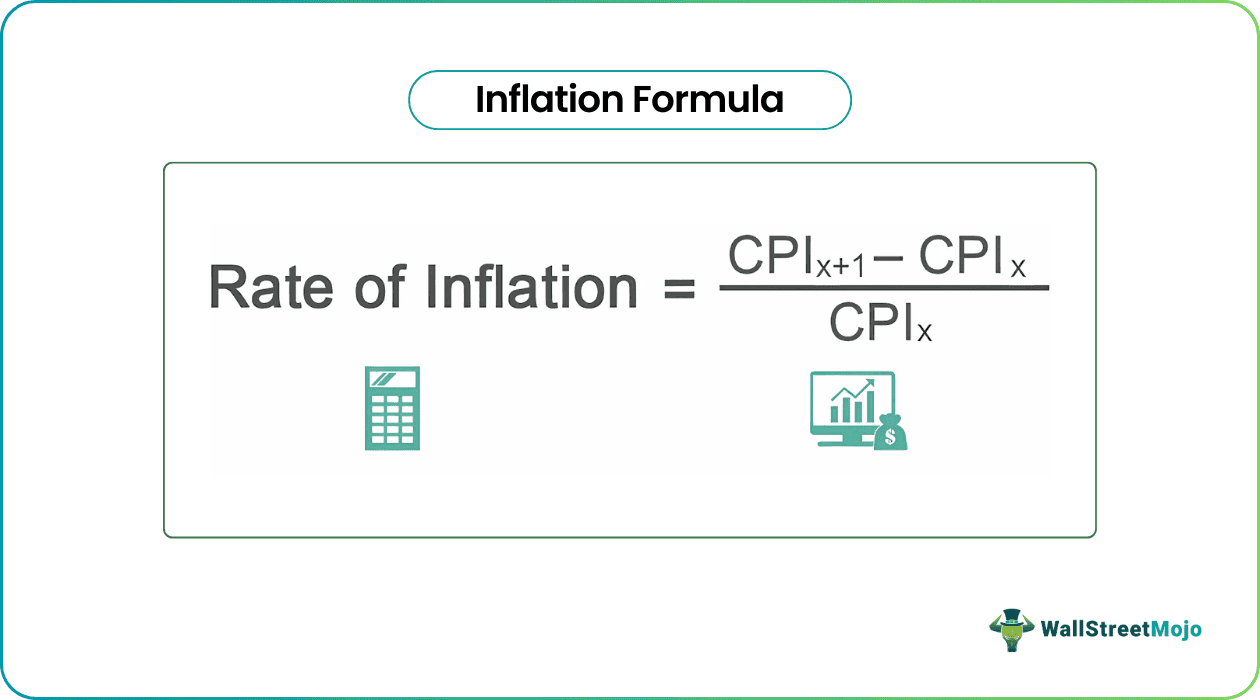
To calculate the inflation rate between two periods using the CPI, the formula is:
$$ text{Inflation Rate} = left( frac{text{CPI}{text{Current Year}} – text{CPI}{text{Previous Year}}}{text{CPI}_{text{Previous Year}}} right) times 100 $$
Using our example, if CPI in Year 1 was 100 and CPI in Year 2 was 114.04:
$$ text{Inflation Rate} = left( frac{114.04 – 100}{100} right) times 100 = 14.04% $$
This figure represents the percentage increase in the price level from the previous year to the current year, indicating the rate of inflation.

Limitations and Nuances of CPI
While the CPI is a robust measure, it has inherent limitations:
-
Substitution Bias: The fixed market basket doesn’t account for consumers substituting away from goods that have become relatively more expensive towards cheaper alternatives. This can overestimate the true cost of living.
-
Quality Bias: Over time, goods and services often improve in quality (e.g., a smartphone today vs. ten years ago). The CPI has difficulty distinguishing between a price increase due to higher quality versus a pure inflationary price increase.
-
New Goods Bias: The CPI market basket is updated periodically, but new products (e.g., streaming services) are not immediately included, delaying their impact on the index.
-
Regional Differences: The national CPI may not accurately reflect the inflation experience in specific regions or cities, where housing, energy, and labor costs can vary significantly.
-
Core vs. Headline Inflation: Economists often look at “Core CPI,” which excludes volatile food and energy prices, to get a clearer picture of underlying inflation trends, separate from short-term supply shocks. “Headline CPI” includes all goods and services.
Producer Price Index (PPI) and Other Inflation Indicators
Beyond the consumer’s perspective, understanding inflation requires looking at price changes further up the supply chain and at broader economic measures.
What is the PPI? A Look at Upstream Prices
The Producer Price Index (PPI) measures the average change over time in the selling prices received by domestic producers for their output. Unlike the CPI, which measures what consumers pay, the PPI measures what producers receive. It covers goods at various stages of production: crude materials, intermediate goods, and finished goods.
The PPI is often considered a leading indicator of consumer inflation. When producers face higher input costs (raw materials, energy, labor), they often pass these costs onto consumers in the form of higher retail prices. Therefore, a significant increase in the PPI can signal future increases in the CPI. Analyzing the PPI provides insights into inflationary pressures originating from the supply side of the economy.
Other Relevant Inflation Indicators
To gain a comprehensive understanding of inflation, economists also monitor other indicators:
-
Personal Consumption Expenditures (PCE) Price Index: As mentioned, this is the Federal Reserve’s preferred measure. It differs from CPI in coverage (includes purchases made by non-profits on behalf of households) and weighting (uses a chain-type index that reflects shifting consumer spending patterns more dynamically).
-
GDP Deflator: This index measures the average level of prices of all new, domestically produced goods and services in an economy. It’s broader than CPI or PCE because it includes investment goods and government purchases, not just consumption.
-
Employment Cost Index (ECI): While not a direct price index, the ECI measures the change in the cost of labor, which is a significant component of production costs. Rising labor costs can contribute to inflation.
-
Commodity Price Indices: Indices tracking prices of raw materials like oil, metals, and agricultural products can provide early warnings of inflationary pressures, as these commodities are inputs for many manufactured goods.
Practical Applications and Impact on Personal Finance
Understanding how to count inflation is not just theoretical; it has direct and profound implications for your personal financial planning and decision-making.
Adjusting for Inflation in Financial Planning
Inflation erodes the purchasing power of your savings and investments over time. A common mistake is to look at nominal returns (the stated return) without considering inflation. The real return is what truly matters:
$$ text{Real Return} approx text{Nominal Return} – text{Inflation Rate} $$
For example, if your savings account offers a 2% nominal interest rate and inflation is 3%, your real return is -1%. This means your money is losing purchasing power. Financial planning for retirement, education, or any long-term goal must account for inflation to ensure that future funds will have sufficient real value. It impacts how much you need to save, how aggressively you invest, and the types of assets you choose.
Inflation and Purchasing Power
Every dollar you earn or save is subject to the forces of inflation. To understand your true financial progress, it’s essential to consider your “personal inflation rate,” which might differ from the national average based on your specific spending habits. If you spend a larger proportion of your income on goods and services that are experiencing higher-than-average price increases (e.g., healthcare or housing), your effective inflation rate will be higher. This awareness helps you make targeted adjustments to your budget and spending.
Strategies to Mitigate Inflation’s Impact
Armed with the knowledge of how inflation is counted and its effects, individuals can adopt strategies to protect their wealth:
-
Investing in Inflation-Protected Securities (TIPS): Treasury Inflation-Protected Securities are government bonds whose principal value adjusts with the CPI, offering protection against inflation.
-
Real Estate: Real estate can be a hedge against inflation as property values and rental income often rise with the general price level.
-
Commodities: Investing in physical commodities or commodity-linked funds (like gold, oil, or agricultural products) can perform well during inflationary periods.
-
Diversified Portfolio: A diversified investment portfolio that includes stocks (which represent ownership in companies whose revenues and profits may grow with inflation), real assets, and potentially some inflation-indexed bonds can help weather inflationary storms.
-
Increase Earning Power: Investing in your skills and education to command higher wages is a direct way to combat inflation, as your income growth can outpace price increases.
Government Role and Monetary Policy
Central banks and governments play a crucial role in managing inflation, recognizing its potential to destabilize economies if left unchecked.
Central Banks and Inflation Targeting
Most central banks, such as the Federal Reserve in the U.S. or the European Central Bank, have a mandate to maintain price stability, which often translates into an explicit or implicit inflation target (e.g., 2% annual inflation). They primarily achieve this through monetary policy tools, such as:
-
Interest Rates: Raising benchmark interest rates makes borrowing more expensive, slowing down economic activity and reducing demand, which can cool inflationary pressures. Conversely, lowering rates can stimulate the economy.
-
Quantitative Easing/Tightening: Buying or selling government bonds and other securities to inject or withdraw money from the financial system, influencing long-term interest rates and credit availability.
These actions are carefully calibrated based on inflation readings, including the CPI and PCE, to guide the economy towards sustainable growth without excessive price increases.
Why Moderate Inflation is Desirable
While high or runaway inflation (hyperinflation) is destructive, a low and stable rate of inflation (e.g., 2-3%) is generally considered healthy for an economy. Moderate inflation:
-
Encourages Spending and Investment: Consumers and businesses are incentivized to spend or invest rather than hoard cash, as money will lose value over time.
-
Provides Flexibility for Monetary Policy: Central banks have more room to cut interest rates to stimulate the economy during downturns if there’s a buffer against deflation.
-
Prevents Deflation: Deflation (a general fall in prices) can be far more damaging than moderate inflation, leading to reduced consumer spending, business investment, wage cuts, and economic stagnation.

Conclusion
Counting the inflation rate is a multifaceted process that relies on meticulously constructed price indices like the CPI, PPI, and PCE. These measures provide essential insights into the changing cost of living and production, guiding everything from individual budget decisions to national monetary policy. By understanding the methodologies, limitations, and implications of inflation, individuals can better protect their purchasing power, make smarter investment choices, and navigate the economic landscape with greater confidence. In an ever-evolving global economy, staying informed about inflation and its measurement remains paramount for sound financial health and strategic planning.
aViewFromTheCave is a participant in the Amazon Services LLC Associates Program, an affiliate advertising program designed to provide a means for sites to earn advertising fees by advertising and linking to Amazon.com. Amazon, the Amazon logo, AmazonSupply, and the AmazonSupply logo are trademarks of Amazon.com, Inc. or its affiliates. As an Amazon Associate we earn affiliate commissions from qualifying purchases.