
In the world of finance, numbers speak volumes, but it’s often their relative meaning, expressed as percentages, that truly conveys their significance. From personal budgeting and investment returns to understanding market trends and economic indicators, percentages are an indispensable language. They allow us to compare disparate figures, quantify growth or decline, and make informed financial decisions with clarity and precision. This article delves into the fundamental mechanics of converting to percentages, exploring why this skill is paramount across various financial domains and how to apply it effectively to empower your financial journey.

The Foundational Role of Percentages in Finance
Percentages are more than just a mathematical concept; they are a universal translator in the financial realm. They allow us to standardize comparisons, making complex financial data digestible and actionable. Without the ability to convert raw numbers into percentages, gauging relative performance, risk, or opportunity would be a far more arduous and error-prone task.
Demystifying the “Per Cent” Concept
At its core, “per cent” literally means “per hundred” or “out of one hundred.” When we say something is 25%, we mean 25 out of every 100 units. This simple definition underpins its power: it provides a standardized base for comparison. Whether we’re talking about a small startup’s quarterly growth or a multinational corporation’s market share, expressing these figures as percentages brings them into a comparable context. For instance, knowing a company’s revenue increased by $1 million might seem impressive, but if its initial revenue was $1 billion, a 0.1% increase paints a very different picture than if its initial revenue was $5 million, representing a 20% increase. The percentage conversion immediately highlights the scale and impact of the change.
Why Percentages are Indispensable for Financial Literacy
Financial literacy hinges on understanding the proportional relationships between different financial elements. How much of your income goes towards housing? What proportion of your investment portfolio is allocated to stocks versus bonds? What is the annual interest rate on your loan? All these critical questions are answered using percentages. They provide the framework for analyzing debt-to-income ratios, calculating profit margins, evaluating investment yields, and comprehending the true cost of borrowing or the potential for growth. Without a solid grasp of percentage conversion and interpretation, individuals and businesses alike operate at a distinct disadvantage, making it harder to set realistic goals, manage risks, or identify opportunities.
Beyond Basic Math: The Power of Relative Comparison
The true strength of percentages lies in their ability to facilitate relative comparison. Absolute numbers, while important, can often be misleading on their own. For example, two different investments might yield an absolute profit of $1,000. However, if Investment A required an initial outlay of $5,000 while Investment B required $20,000, their respective returns are vastly different. Converting these to percentages immediately reveals that Investment A yielded a 20% return ($1,000 / $5,000 * 100), whereas Investment B yielded only 5% ($1,000 / $20,000 * 100). This relative perspective is crucial for making sound comparative judgments, enabling investors to discern which opportunity truly offers better performance for the capital deployed. It transforms raw data into meaningful insights, empowering better decision-making across all facets of finance.
The Mechanics of Conversion: From Raw Numbers to Percentages
Converting to a percentage is a fundamental mathematical operation that transforms a fraction or a decimal into a value out of one hundred. While seemingly simple, mastering this skill is critical for accurately interpreting and communicating financial information. This section breaks down the core formula and illustrates its application with practical, everyday financial scenarios.
The Fundamental Formula: Part/Whole x 100
The most basic and universally applicable formula for converting any part of a whole into a percentage is:
Percentage = (Part / Whole) × 100
Let’s dissect this formula:
- Part: This represents the specific quantity or amount you are interested in expressing as a proportion.
- Whole: This is the total quantity or the base amount against which the part is being compared.
- Division (Part / Whole): Performing this division yields a decimal value, which represents the proportion of the part relative to the whole. For example, if you spend $300 (Part) out of a $1,000 budget (Whole), $300 / $1,000 = 0.3.
- Multiplication by 100: Multiplying the resulting decimal by 100 converts it into a percentage. Continuing the example, 0.3 × 100 = 30%. This means $300 is 30% of $1,000.
This formula is the cornerstone for all percentage calculations in finance, whether you’re determining your savings rate, calculating a discount, or assessing a profit margin.
Converting Decimals and Fractions with Ease
While the Part/Whole formula is universal, you’ll often encounter numbers already in decimal or fractional form that need to be converted to percentages.
-
Converting a Decimal to a Percentage: This is perhaps the simplest conversion. You merely multiply the decimal by 100 and add the percent symbol (%).
- Example: If a growth rate is reported as a decimal of 0.045, to express it as a percentage, you calculate 0.045 × 100 = 4.5%.
- Example: An investment expense ratio of 0.0075 translates to 0.0075 × 100 = 0.75%.
-
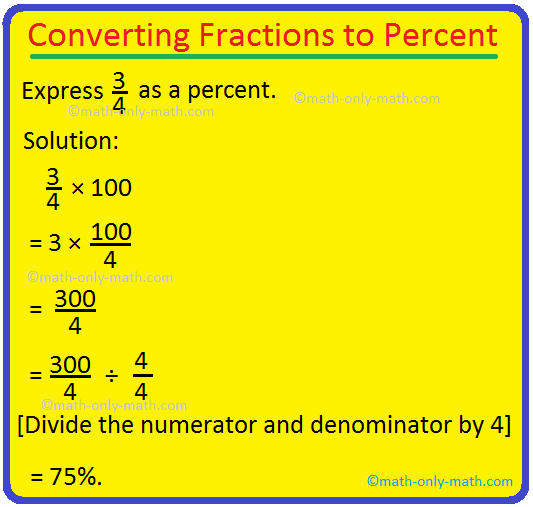
Converting a Fraction to a Percentage: First, convert the fraction to a decimal by dividing the numerator by the denominator. Then, convert the resulting decimal to a percentage by multiplying by 100.
- Example: If 3/5 of your portfolio is allocated to a certain asset, you first divide 3 by 5, which equals 0.6. Then, multiply 0.6 by 100 to get 60%.
- Example: A commission structure that pays 1/20 of sales means 1 divided by 20 equals 0.05. Multiply 0.05 by 100 to get 5%.
Practical Examples: Calculating Discounts and Tips
Let’s apply these mechanics to common financial scenarios:
-
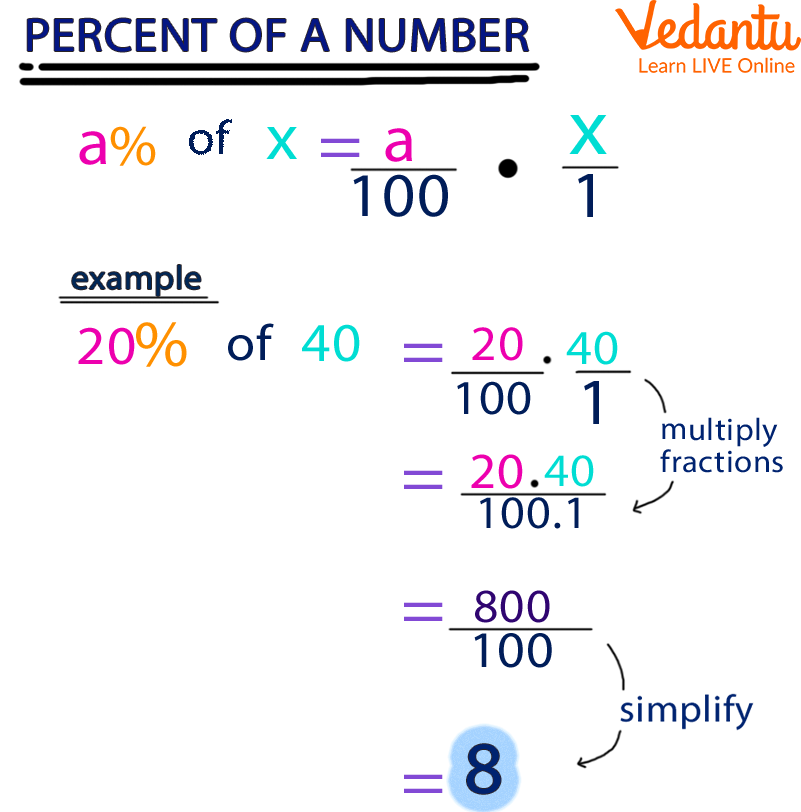
Calculating a Discount: You see an item priced at $150 with a 20% discount. To find the discount amount, you’re essentially finding 20% of $150.
- Convert 20% to a decimal: 20 / 100 = 0.20.
- Multiply the decimal by the original price: 0.20 × $150 = $30.
- The discount is $30, making the final price $150 – $30 = $120.
-
Calculating a Tip: You want to leave a 15% tip on a restaurant bill of $60.
- Convert 15% to a decimal: 15 / 100 = 0.15.
- Multiply the decimal by the bill amount: 0.15 × $60 = $9.
- The tip is $9, making the total payment $60 + $9 = $69.
These practical examples demonstrate how routinely percentages are used in daily financial interactions. A firm grasp of these conversion principles is fundamental to understanding and managing your everyday finances effectively.
Percentages in Personal Finance: Budgeting, Savings, and Debt
Personal finance is where the practical application of percentage conversion truly shines. From meticulously planning how your income is distributed to strategizing debt repayment and building wealth, percentages provide the essential framework for clear analysis and effective decision-making.
Crafting a Balanced Budget with Percentage Allocations
Budgeting is arguably the most crucial aspect of personal finance, and percentages are its backbone. Instead of focusing solely on absolute dollar amounts, which can fluctuate with income, percentage-based budgeting offers a flexible and sustainable approach. Popular methods like the 50/30/20 rule (50% for Needs, 30% for Wants, 20% for Savings & Debt Repayment) are entirely built on percentage allocations.
To apply this, you first need to understand your income. If your net monthly income is $4,000, you can quickly convert these percentages to dollar amounts:
- Needs (50%): $4,000 × 0.50 = $2,000 (housing, utilities, groceries, transportation)
- Wants (30%): $4,000 × 0.30 = $1,200 (dining out, entertainment, subscriptions)
- Savings & Debt Repayment (20%): $4,000 × 0.20 = $800
This conversion from a percentage rule to concrete dollar figures allows you to track your spending, identify areas of overspending, and make adjustments to maintain financial health. It provides a clear, proportional view of how your money is being utilized, irrespective of your specific income level.
Setting and Tracking Savings Goals
Saving for a down payment, retirement, or a child’s education often involves setting a target percentage of your income to save regularly. This helps ensure consistency and progress towards long-term objectives. For instance, financial experts often recommend saving 10-15% of your income for retirement.
If your monthly income is $5,000 and you aim to save 15%:
- Monthly Savings Goal: $5,000 × 0.15 = $750.
Tracking your progress also involves percentages. If you’ve saved $15,000 towards a $50,000 down payment goal, you can convert this to a percentage to see how far you’ve come:
- Progress Percentage: ($15,000 / $50,000) × 100 = 30%.
This immediate understanding of your progress, expressed as a percentage, can be a powerful motivator and a clear indicator of how much more effort is required.
Deciphering Interest Rates and Debt Ratios
Interest rates, the cost of borrowing money or the return on lending it, are almost universally expressed as percentages. Understanding how to convert a percentage interest rate into its real-world impact is crucial for managing debt effectively. A 6% annual interest rate on a $10,000 loan means you’ll pay $600 in interest per year ($10,000 × 0.06), excluding principal repayments.
Furthermore, lenders frequently assess your financial health using debt-to-income (DTI) ratios, which are expressed as percentages. This ratio compares your total monthly debt payments to your gross monthly income:
DTI Ratio = (Total Monthly Debt Payments / Gross Monthly Income) × 100
If your monthly debt payments (car loan, student loan, credit card minimums) total $800 and your gross monthly income is $4,000:
- DTI Ratio: ($800 / $4,000) × 100 = 20%.
Lenders typically prefer DTI ratios below 36-43%, depending on the type of loan. By converting your debt and income figures into a percentage, you can quickly assess your eligibility for new loans or identify if your debt load is becoming unmanageable. Percentages, in these contexts, are not just numbers; they are powerful indicators of financial health and future opportunities.
Leveraging Percentages in Investing and Wealth Building
In the dynamic world of investing, percentages are the lingua franca for evaluating performance, managing risk, and making strategic allocation decisions. From understanding individual asset returns to analyzing the composition of an entire portfolio, the ability to convert and interpret percentage metrics is essential for successful wealth building.
Understanding Return on Investment (ROI) and Capital Gains
One of the most fundamental metrics for any investor is the Return on Investment (ROI). ROI measures the profitability or efficiency of an investment by comparing the gain or loss relative to its cost. It is almost always expressed as a percentage, allowing for easy comparison across different investment vehicles and timeframes.
The basic formula for ROI is:
ROI = [(Current Value of Investment – Original Cost of Investment) / Original Cost of Investment] × 100
Let’s say you bought shares for $5,000 and sold them for $6,500.
- ROI: [($6,500 – $5,000) / $5,000] × 100 = ($1,500 / $5,000) × 100 = 0.30 × 100 = 30%.
This 30% ROI gives a clear, relative measure of your investment’s success. Similarly, capital gains—the profit made from selling an investment for more than its purchase price—are often discussed as a percentage of the original investment. This provides crucial context beyond the absolute dollar amount.
Analyzing Portfolio Diversification and Asset Allocation
Diversification, the strategy of spreading investments across various assets to reduce risk, is heavily dependent on percentage-based allocation. Investors allocate their capital to different asset classes (e.g., stocks, bonds, real estate, cash) based on their risk tolerance, financial goals, and time horizon. These allocations are typically expressed as percentages of the total portfolio value.
For example, a common balanced portfolio might target:
- 60% Stocks
- 30% Bonds
- 10% Cash
To maintain this allocation, an investor needs to continuously monitor their portfolio’s current composition. If your $100,000 portfolio now has $65,000 in stocks, you can quickly calculate its current percentage allocation:
- Current Stock Allocation: ($65,000 / $100,000) × 100 = 65%.
This indicates an overweighting in stocks relative to your target. Converting to percentages allows for easy “rebalancing”—adjusting the portfolio back to its target percentages by buying or selling assets. This systematic approach, driven by percentage targets, is key to managing risk and aligning the portfolio with an investor’s long-term strategy.
Evaluating Investment Performance Metrics (Yields, Expense Ratios)
Beyond overall ROI, several other critical investment metrics are presented as percentages:
-
Dividend Yield: For income-generating investments like stocks and mutual funds, dividend yield is the annual dividend income per share, expressed as a percentage of the stock’s current price. If a stock pays $2 in annual dividends and trades at $50 per share:
- Dividend Yield: ($2 / $50) × 100 = 4%.
This helps investors compare the income-generating potential of different stocks.
- Dividend Yield: ($2 / $50) × 100 = 4%.
-
Bond Yield: For bonds, various yields (current yield, yield to maturity) are expressed as percentages and indicate the return an investor can expect.
-
Expense Ratios: Mutual funds and Exchange Traded Funds (ETFs) charge management fees, expressed as an “expense ratio,” which is a percentage of the total assets managed. A fund with an expense ratio of 0.50% means 0.50% of your investment’s value is deducted annually as fees. While seemingly small, these percentages can significantly impact long-term returns due to compounding.
Understanding and converting to these percentage-based metrics is fundamental for making informed investment choices, ensuring your wealth-building strategy is robust and aligned with your financial objectives.
Advanced Applications and Common Misconceptions
While the basic conversion of numbers to percentages is straightforward, their application in finance often involves nuances and potential pitfalls. Understanding these advanced applications and common misconceptions is crucial for accurate financial analysis and avoiding costly errors.
Interpreting Percentage Changes vs. Percentage Point Changes
A common source of confusion in financial reporting is the distinction between a “percentage change” and a “percentage point change.” Failing to differentiate these can lead to significant misinterpretations.
-
Percentage Change: This refers to the relative change in a quantity, calculated as the difference between the new and old values, divided by the old value, multiplied by 100. For instance, if an investment grows from $100 to $120, that’s a ($20 / $100) * 100 = 20% increase.
-
Percentage Point Change: This refers to the absolute difference between two percentages. For example, if an interest rate increases from 4% to 5%, that is a 1 percentage point increase. It is not a 1% increase. A 1% increase on a 4% rate would mean the new rate is 4% * (1 + 0.01) = 4.04%. The absolute difference of 1 percentage point from 4% to 5% is actually a (5-4)/4 * 100 = 25% percentage increase in the interest rate itself. This distinction is vital in discussions about inflation, interest rates, and market share.
The Impact of Compounding and Annualized Percentages
Compounding, often called the “eighth wonder of the world,” is the process where investment earnings generate their own earnings. It’s fundamentally tied to percentages, specifically annualized return percentages. When a percentage return is compounded, the growth rate applies not just to the initial principal but also to the accumulated interest or gains from previous periods.
- Annualized Percentage: This expresses a return or rate over a full year, even if the period is shorter or longer. For example, if an investment earns 1% per month, its annual return isn’t simply 1% × 12 = 12% if compounded. Instead, it’s (1 + 0.01)^12 – 1, which equals approximately 12.68%. This effective annual rate (EAR) accounts for the compounding effect and is a more accurate representation of the actual return over a year. Understanding how to annualize and the power of compounding percentages is paramount for long-term financial planning and investment growth projection.
Utilizing Financial Tools for Complex Percentage Calculations
While basic percentage conversions can be done manually or with a simple calculator, more complex financial scenarios often benefit from dedicated tools.
-
Spreadsheets (e.g., Microsoft Excel, Google Sheets): These are invaluable for managing budgets, tracking investments, and performing sophisticated percentage calculations. Functions like
RATE,PV,FV,PMT, and simple percentage formulas (=A2/B2*100) allow for dynamic analysis. You can easily model different scenarios (e.g., “what if my savings rate increases by 2%?”) and see the long-term impact on your financial goals. -
Online Financial Calculators: Websites often provide specialized calculators for mortgage payments, retirement savings, loan interest, and investment returns, all relying heavily on percentage inputs and outputs. These tools simplify complex calculations, allowing users to focus on understanding the implications of the percentages rather than performing the arithmetic.
-
Financial Software and Apps: Many personal finance management apps and investment platforms integrate percentage-based reporting and analysis, helping users visualize their spending percentages, portfolio allocations, and performance metrics without manual calculations.
Mastering the art of converting to and interpreting percentages is not just about crunching numbers; it’s about gaining a deeper understanding of financial dynamics. By recognizing the nuances, avoiding common mistakes, and leveraging available tools, you can transform raw financial data into powerful insights, enabling more intelligent and effective financial decision-making in all aspects of your life.
aViewFromTheCave is a participant in the Amazon Services LLC Associates Program, an affiliate advertising program designed to provide a means for sites to earn advertising fees by advertising and linking to Amazon.com. Amazon, the Amazon logo, AmazonSupply, and the AmazonSupply logo are trademarks of Amazon.com, Inc. or its affiliates. As an Amazon Associate we earn affiliate commissions from qualifying purchases.