
In the dynamic world of finance, numbers tell a story. Whether you’re tracking your personal investments, analyzing a business’s quarterly performance, or evaluating market trends, understanding the relationship between different data points is paramount. One of the most fundamental yet powerful tools in a financial analyst’s arsenal is the ability to calculate the percentage difference between two numbers. This metric goes beyond simply noting a change; it contextualizes that change, allowing for meaningful comparisons and informed decision-making.
This article will guide you through the process of calculating the percentage difference, exploring its nuanced applications within personal finance, investing, and business operations. By mastering this concept, you’ll unlock a deeper understanding of financial data, enabling you to identify growth, pinpoint declines, and ultimately make smarter money moves.

Understanding the “Why”: The Importance of Percentage Difference in Finance
Before diving into the mechanics, it’s essential to grasp why percentage difference holds such significance in financial contexts. Absolute differences, while informative, often lack the perspective needed for true financial analysis. A $100 change means very different things if the original amount was $1,000 versus $1,000,000. Percentage difference normalizes these changes, providing a relative measure that is universally comparable.
Tracking Growth and Decline
For individuals, businesses, and investors alike, tracking growth and decline is a core activity. Percentage difference allows you to quantify this over time. For instance, comparing your investment portfolio’s value at the beginning and end of a quarter, assessing your side hustle’s revenue year-over-year, or analyzing a company’s profit margin fluctuations – all these scenarios benefit immensely from percentage difference calculations. It helps answer critical questions like: “Did my portfolio grow by a meaningful amount?” or “Is this company’s sales growth accelerating or decelerating?”
Comparing Performance Across Time or Entities
Imagine you’re comparing two different investment opportunities or evaluating the performance of your business against a competitor. An absolute difference might not paint the full picture. If one stock went up $5 and another went up $50, which performed better? Without knowing their starting prices, it’s impossible to tell. Percentage difference provides the necessary common ground, allowing you to directly compare the relative performance, regardless of the initial magnitudes. Similarly, it helps assess whether your current month’s expenses are significantly higher or lower than the previous month, offering a clear, proportionate view of your spending habits.
Informing Budgeting and Forecasting
Effective budgeting and financial forecasting rely heavily on understanding past trends and projecting future outcomes. Percentage difference is an invaluable tool here. By analyzing historical percentage changes in revenue, costs, or various budget categories, you can identify patterns, set realistic financial goals, and create more accurate forecasts. For example, if you consistently see a 5% increase in a particular expense category each year, you can factor that into your future budgets, anticipating the impact on your overall financial plan.
The Core Formula: Demystifying Percentage Difference
At its heart, calculating the percentage difference is straightforward. It involves finding the absolute difference between two numbers, dividing it by their average, and then multiplying by 100 to express it as a percentage. This approach is specifically for “percentage difference,” which measures how much two numbers vary relative to their average. It’s distinct from “percentage change,” which measures change relative to an initial value. In financial analysis, both are useful, but percentage difference is particularly good for comparing two distinct points without designating one as a strict “start” or “end.”
The formula is as follows:
Percentage Difference = [ | Number 1 – Number 2 | / ( (Number 1 + Number 2) / 2 ) ] * 100
Let’s break down each component:
- | Number 1 – Number 2 |: This calculates the absolute difference between the two numbers. The absolute value ensures that the result is always positive, as a “difference” typically refers to magnitude.
- ** (Number 1 + Number 2) / 2 :** This calculates the average of the two numbers. This average serves as the baseline or reference point against which the difference is measured.
- Dividing the absolute difference by the average: This step gives you the fractional difference relative to the midpoint of the two numbers.
- Multiplying by 100: This converts the fractional difference into a percentage, making it easier to interpret.
Step-by-Step Calculation Breakdown
Let’s use a financial example. Suppose your investment portfolio was worth $10,000 at the beginning of the year and $12,000 at the end of the year.
-
Identify your two numbers:
- Number 1 = $10,000
- Number 2 = $12,000
-
Calculate the absolute difference:
- | $10,000 – $12,000 | = | -$2,000 | = $2,000
-
Calculate the average of the two numbers:
- ( $10,000 + $12,000 ) / 2 = $22,000 / 2 = $11,000
-
Divide the absolute difference by the average:
- $2,000 / $11,000 ≈ 0.1818
-
Multiply by 100 to get the percentage difference:
- 0.1818 * 100 = 18.18%
So, the percentage difference between $10,000 and $12,000 is approximately 18.18%. This tells you that the two values differ from their average by 18.18%.
Interpreting Positive and Negative Results (Context of Percentage Change vs. Difference)

While the percentage difference formula inherently yields a positive result due to the absolute value, when you’re looking at “percentage change” (which might be what you actually need for growth/decline), the sign matters.
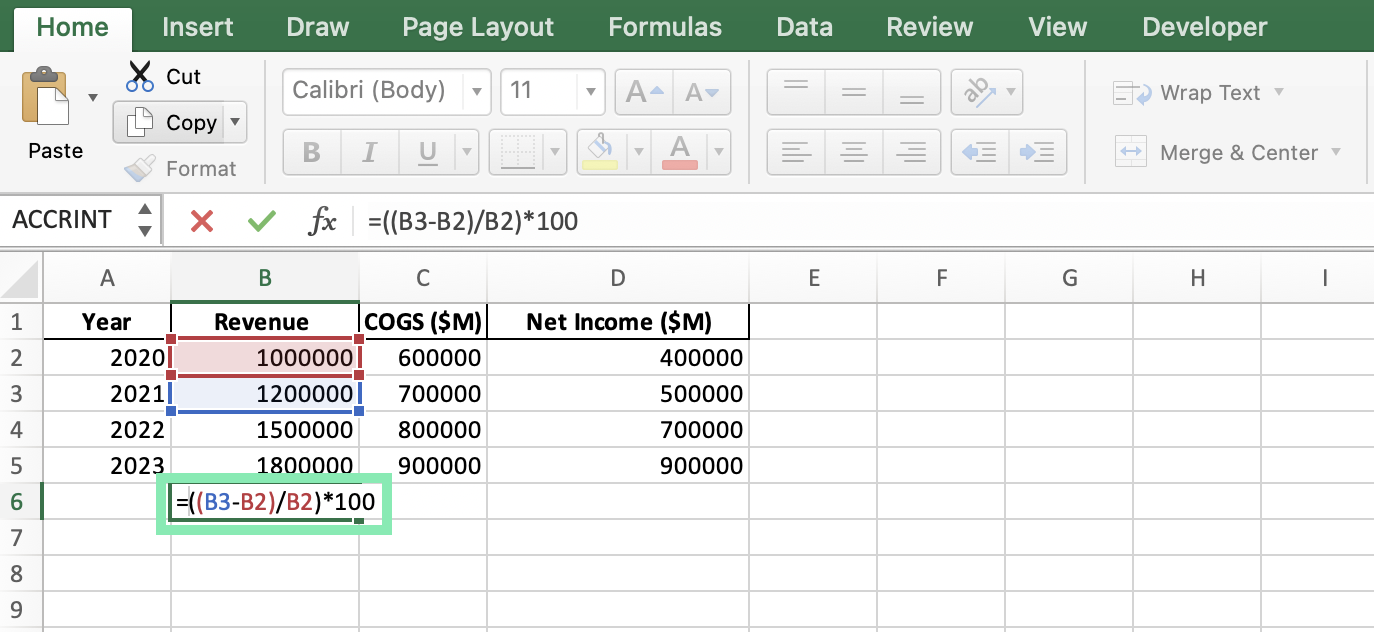
For percentage change: (New Value - Old Value) / Old Value * 100.
- If your new value is greater than your old value, the result will be positive, indicating growth or an increase.
- If your new value is less than your old value, the result will be negative, indicating a decline or decrease.
For example, using the portfolio example above with percentage change:
($12,000 – $10,000) / $10,000 * 100 = ($2,000 / $10,000) * 100 = 0.20 * 100 = +20%.
This indicates a 20% growth in your portfolio. While distinct from percentage difference, understanding both is crucial for comprehensive financial analysis. Percentage difference is useful when there isn’t a clear “old” and “new” but rather two distinct values whose magnitude of separation needs to be understood.
Real-World Applications in Personal Finance
For individuals managing their own money, percentage difference and change are powerful allies in achieving financial goals. They provide clarity where raw numbers might obscure insights.
Analyzing Investment Returns and Portfolio Growth
Perhaps the most common application in personal finance is evaluating investment performance. Comparing the value of your 401(k) or brokerage account from one period to another using percentage change tells you your actual return. Using percentage difference might be useful if you’re comparing two different hypothetical portfolio compositions or scenarios without a clear starting point. For example, comparing the financial impact of investing $10,000 in Stock A vs. Stock B over a year, where both start on the same day, allows you to determine their relative variance.
Tracking Budget Variances and Spending Habits
Budgeting isn’t just about setting limits; it’s about monitoring and adjusting. By calculating the percentage difference between your budgeted amount for a category (e.g., groceries) and your actual spending, you can quickly identify areas of overspending or underspending. A 5% difference might be acceptable, but a 25% difference signals a need for closer examination and adjustment of habits or budget allocation.
Evaluating Price Changes and Loan Interest Rates
When making purchasing decisions or managing debt, percentage difference offers valuable context. Is the price increase of a common grocery item significant? By how much has your mortgage interest rate changed compared to a competitor’s offer? Comparing loan interest rates from different lenders as a percentage difference quickly reveals which offers a more favorable deal, especially when the principal amounts might be different.
Strategic Insights for Business and Investing
In the corporate world and for seasoned investors, the ability to rapidly and accurately calculate percentage differences is a foundational skill for strategic decision-making and performance evaluation.
Assessing Revenue Growth and Profitability Shifts
Businesses constantly track their financial health. Comparing current quarter revenue to the previous quarter’s revenue, or year-over-year revenue, using percentage change provides a clear picture of growth or contraction. Similarly, monitoring percentage changes in gross profit margins or net income reveals shifts in operational efficiency and overall profitability, critical for investor relations and internal strategy adjustments. A significant drop in percentage profit margin, even with stable revenue, indicates rising costs or pricing issues.
Benchmarking Competitor Performance
In a competitive market, understanding how your business stacks up is crucial. Companies often use percentage differences to compare their own key performance indicators (KPIs)—such as market share, customer acquisition cost, or conversion rates—against industry averages or direct competitors. If your customer churn rate percentage difference is significantly higher than the industry average, it flags an area requiring immediate strategic attention.
Optimizing Marketing ROI and Operational Efficiency
Marketing departments use percentage difference to assess the effectiveness of campaigns by comparing conversion rates, website traffic, or sales figures before and after an initiative. Operations teams analyze percentage changes in production costs, waste reduction, or delivery times to identify inefficiencies and measure the impact of process improvements. For example, if a new manufacturing process reduces material waste from 10% to 5%, that’s a 50% reduction in waste, a significant operational improvement.
Common Pitfalls and Best Practices for Financial Analysis
While calculating percentage difference is simple, its application in finance demands careful consideration to avoid misinterpretations that could lead to poor decisions.
Avoiding Misinterpretations of Baseline Values
One common mistake, especially when discussing “percentage change,” is using the wrong base number. For instance, if a stock drops from $100 to $50 (a 50% decrease), and then rises from $50 back to $100, that’s a 100% increase, not a 50% increase. The base value for the increase is $50, not the original $100. Always be clear about what constitutes your “original” or “comparison” base, especially in the context of percentage change. For percentage difference, the average serves as a neutral baseline, reducing this specific type of ambiguity.
Considering Context and Timeframes
Numbers rarely tell the whole story in isolation. A 10% increase in revenue might sound good, but if the overall market grew by 20%, your company has actually lost market share. Always consider external factors, economic conditions, and industry benchmarks. Similarly, the timeframe is critical. A 5% monthly return on an investment is excellent, but a 5% annual return might be modest. Ensure you are comparing apples to apples across consistent periods.
Leveraging Financial Tools for Accuracy
While manual calculation is vital for understanding, for complex analyses or large datasets, leverage financial tools. Spreadsheets like Excel or Google Sheets offer functions that automate percentage calculations, reducing human error. Financial software and investment platforms often provide these metrics built-in, allowing you to focus on interpretation rather than computation. However, always understand the underlying formula these tools use to ensure they align with the specific “percentage difference” or “percentage change” you intend to calculate.
Mastering the calculation and interpretation of percentage difference and percentage change is more than just a mathematical exercise; it’s a fundamental skill that empowers financial literacy. From managing your household budget to making savvy investment choices and driving business growth, this simple yet potent metric provides the clarity and context needed to transform raw data into actionable financial intelligence. By integrating this skill into your financial toolkit, you position yourself to make more informed, strategic decisions, leading to greater financial success.
aViewFromTheCave is a participant in the Amazon Services LLC Associates Program, an affiliate advertising program designed to provide a means for sites to earn advertising fees by advertising and linking to Amazon.com. Amazon, the Amazon logo, AmazonSupply, and the AmazonSupply logo are trademarks of Amazon.com, Inc. or its affiliates. As an Amazon Associate we earn affiliate commissions from qualifying purchases.