In the dynamic world of finance, numbers tell a compelling story. Whether you’re tracking investment growth, analyzing business performance, or simply monitoring your personal financial progress, understanding change is paramount. One of the most fundamental yet powerful metrics for quantifying this change is the percent increase. It transforms raw numerical shifts into a relatable and comparative figure, allowing for clearer insights into growth, efficiency, and opportunity.
This article delves into the precise methodology for calculating percent increase, grounding it firmly within the context of personal finance, investing, and business operations. We’ll demystify the formula, explore its diverse applications, and equip you with the knowledge to interpret these crucial figures to make more informed financial decisions.
The Indispensable Role of Percent Increase in Financial Analysis
The ability to calculate and interpret percent increase is not merely an academic exercise; it’s a vital skill for anyone navigating the complexities of modern financial landscapes. It provides a standardized way to measure growth, making disparate figures comparable and trends discernible.
Understanding Growth in Investments
For investors, percent increase is the bedrock of performance measurement. It helps answer critical questions like: “How much did my portfolio grow last year?” or “What was the return on that particular stock?” A stock price moving from $50 to $60 might seem like a modest $10 increase, but expressing it as a 20% increase ($10/$50 * 100) provides a much clearer picture of its profitability relative to the initial investment. This allows for direct comparison between different assets, regardless of their absolute price points.
Consider two investments:
- Investment A: Grows from $100 to $120.
- Investment B: Grows from $1,000 to $1,050.
In absolute terms, Investment B gained $50, which is more than Investment A’s $20. However, calculating the percent increase reveals:
- Investment A: (($120 – $100) / $100) * 100 = 20%
- Investment B: (($1,050 – $1,000) / $1,000) * 100 = 5%
Suddenly, Investment A, despite its smaller absolute gain, emerges as the significantly better performer in terms of percentage return on capital. This insight is invaluable for portfolio management and strategic asset allocation.
Tracking Business Performance and Profitability
In the realm of business finance, percent increase is a cornerstone for evaluating operational health and strategic success. Companies constantly track sales growth, profit margin expansion, customer acquisition rates, and cost efficiencies using this metric. For instance, a business might want to know how much their revenue increased from Q1 to Q2, or how their marketing spend influenced customer conversion rates year-over-year.
- Revenue Growth: If a company’s revenue climbed from $1 million to $1.2 million, that’s a 20% increase, a clear indicator of market traction and sales team effectiveness.
- Profit Margin Improvement: If net profit went from $100,000 to $130,000, that’s a 30% jump, signaling improved cost management or pricing strategies.
- Operating Expenses: Even for costs, understanding percent increase (or decrease) is crucial. A 5% increase in production costs might be acceptable if sales increased by 20%, but alarming if sales remained flat.
These percentages allow businesses to benchmark their performance against industry averages, competitors, and their own historical data, driving strategic decision-making and resource allocation.
Evaluating Personal Financial Progress
On a personal level, percent increase helps individuals gauge the effectiveness of their financial habits and plans. It empowers you to:
- Monitor Net Worth Growth: How much did your total assets less liabilities grow over the past year? A consistent positive percentage indicates healthy financial progression.
- Assess Income Raises: A $5,000 raise on a $50,000 salary (10% increase) is significantly different from a $5,000 raise on a $100,000 salary (5% increase). Understanding this percentage helps in salary negotiations and financial planning.
- Track Savings Rate: If you increased your monthly savings from $200 to $300, that’s a 50% increase, showing significant progress towards financial goals.
By regularly calculating and reviewing these percentages, individuals gain clarity on their financial trajectory and can adjust their strategies as needed to achieve their personal economic objectives.
The Core Formula: Demystifying Percent Increase
While its applications are diverse, the calculation of percent increase is straightforward and relies on a simple, universal formula.
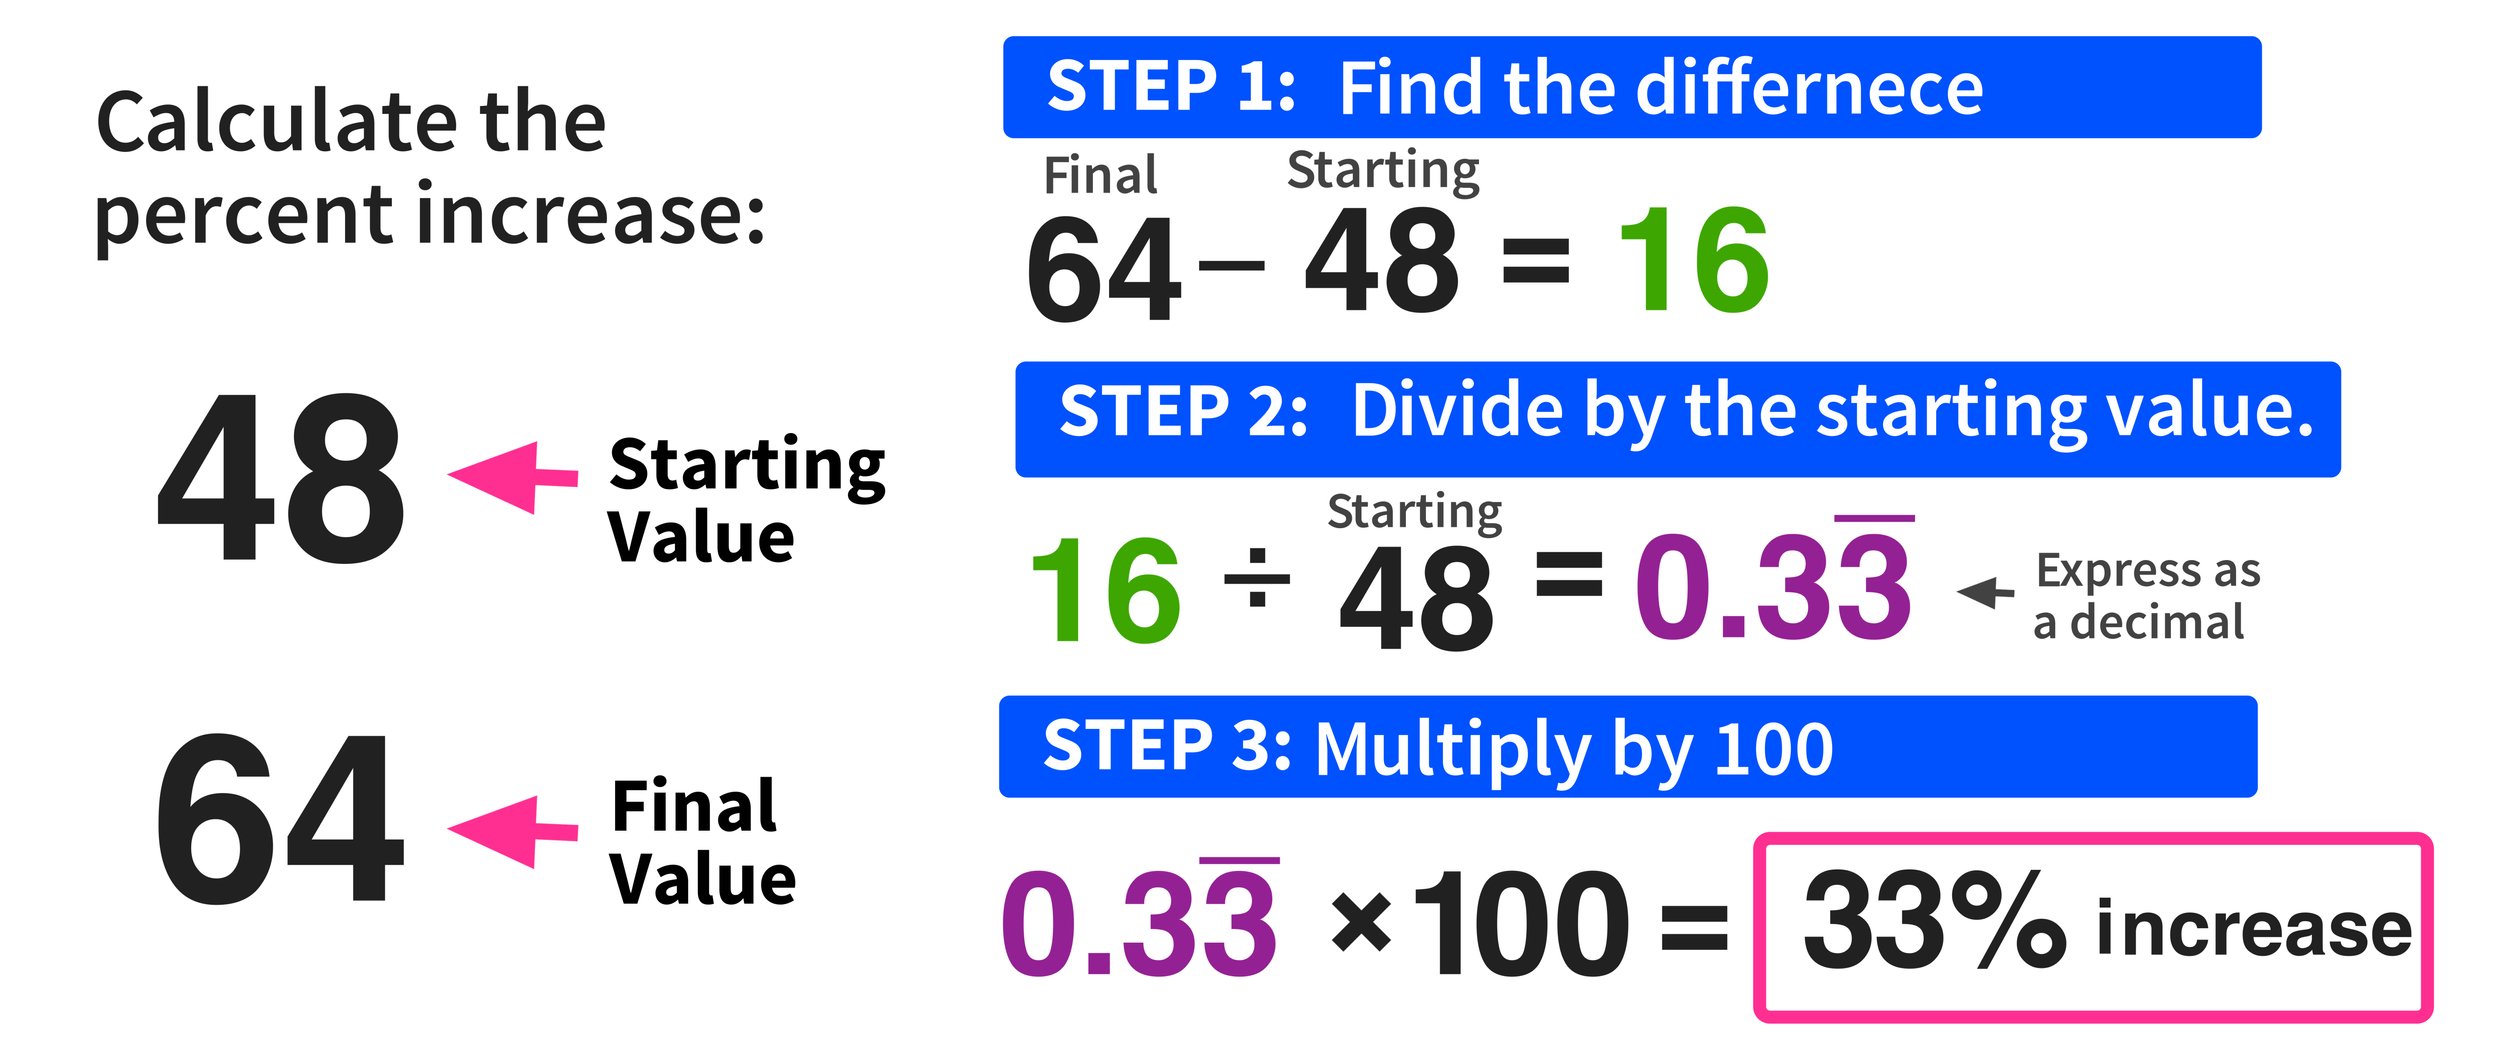
Step-by-Step Breakdown of the Calculation
The formula for percent increase is:
Percent Increase = ((New Value – Original Value) / Original Value) * 100
Let’s break down each component:
- New Value (or Final Value): This is the larger number, representing the amount after the increase has occurred.
- Original Value (or Starting Value): This is the smaller number, representing the initial amount before the increase. This is crucial as it forms the base for comparison.
- Subtract (New Value – Original Value): This step calculates the absolute change or the amount of increase.
- Divide by Original Value: This step normalizes the absolute change, expressing it as a decimal proportion of the original amount.
- Multiply by 100: This converts the decimal proportion into a percentage, making it easier to understand and compare.
Practical Examples for Clarity
Let’s apply this formula to various financial scenarios:
Example 1: Stock Price Increase
- You bought shares of Company X at $75 per share.
- One year later, the shares are worth $90 per share.
- New Value: $90
- Original Value: $75
- Increase: $90 – $75 = $15
- Percent Increase: ($15 / $75) * 100 = 0.20 * 100 = 20%
- Your investment in Company X increased by 20%.
Example 2: Small Business Revenue Growth
- A startup generated $500,000 in revenue in its first year.
- In its second year, revenue grew to $750,000.
- New Value: $750,000
- Original Value: $500,000
- Increase: $750,000 – $500,000 = $250,000
- Percent Increase: ($250,000 / $500,000) * 100 = 0.50 * 100 = 50%
- The startup achieved a 50% revenue growth.
Example 3: Personal Savings Growth
- At the beginning of the year, your savings account had $12,000.
- By the end of the year, it grew to $13,500.
- New Value: $13,500
- Original Value: $12,000
- Increase: $13,500 – $12,000 = $1,500
- Percent Increase: ($1,500 / $12,000) * 100 = 0.125 * 100 = 12.5%
- Your personal savings grew by 12.5% over the year.
Common Pitfalls and How to Avoid Them
While the formula is simple, misapplication can lead to incorrect conclusions.
- Using the Wrong Base (Original Value): This is the most common mistake. Always divide by the starting or original number. If you inadvertently divide by the new value, you’ll get an incorrect percentage that doesn’t reflect the true increase from the initial point. For example, if a product price increased from $10 to $12, the percent increase is (2/10)100 = 20%. If you mistakenly used 12 as the base, you’d get (2/12)100 = 16.67%, which is wrong.
- Confusing Percent Increase with Percentage Point Increase: A “percentage point” refers to the arithmetic difference between two percentages. For instance, if a company’s market share increased from 20% to 25%, that’s a 5 percentage point increase. However, the percent increase in market share is ((25-20)/20)*100 = 25%. Understanding this distinction is vital in financial reporting.
- Ignoring Context: A 100% increase sounds phenomenal, but if it’s from $1 to $2, its impact is minimal compared to a 10% increase from $1 million to $1.1 million. Always consider the absolute numbers and the scale of the change.
Beyond Basic Calculation: Real-World Financial Applications
The utility of percent increase extends far beyond simple, isolated calculations. It forms the basis for more sophisticated financial metrics and deeper analytical insights.
Analyzing Investment Returns
For investors, understanding return on investment (ROI) is fundamental. Percent increase is the core of ROI.
- Simple ROI: Calculated as the percent increase in the value of an investment over a period.
- Compound Annual Growth Rate (CAGR): For investments that grow over multiple periods, CAGR provides a smoothed annual growth rate. While more complex than simple percent increase (it involves roots and exponents), its purpose is to show the average percent increase year-over-year. For example, if an investment grows from $10,000 to $15,000 over 3 years, the simple total percent increase is 50%, but the CAGR (average annual percent increase) would be closer to 14.47%.
Measuring Business Growth and Performance
Businesses rely on percent increase to track numerous key performance indicators (KPIs):
- Sales Growth: Essential for assessing market demand and sales team effectiveness.
- Profit Growth: Indicates improved profitability, whether through increased revenue, cost control, or both.
- Customer Acquisition Cost (CAC) vs. Customer Lifetime Value (CLTV): While not direct percent increases, comparing these often involves analyzing trends. An increase in CLTV or a decrease in CAC is always desired.
- Inventory Turnover Rate: Tracking percent changes in this rate helps optimize supply chain management and reduce holding costs.
- Market Share: An increase in market share percentage signifies competitive strength and brand influence.
These metrics, when tracked over time as percent changes, provide a clear narrative of the business’s trajectory and areas requiring attention.
Assessing Personal Finance Metrics
Percent increase provides clarity in personal financial planning:
- Net Worth Appreciation: Tracking the percentage growth of your net worth is a powerful motivator and indicator of financial health.
- Inflation’s Impact: Understanding how much the cost of living (inflation) has increased year-over-year helps you gauge if your income or investment returns are keeping pace, preserving your purchasing power. If your salary increased by 3% but inflation was 5%, your real purchasing power actually decreased.
- Debt Reduction Progress: While often expressed as a percent decrease, monitoring the percentage of debt paid off against the original debt amount provides tangible proof of progress.
Tools and Techniques for Efficient Calculation
While mental math or a basic calculator suffice for simple cases, leveraging technology can streamline percent increase calculations, especially when dealing with large datasets or complex financial scenarios.
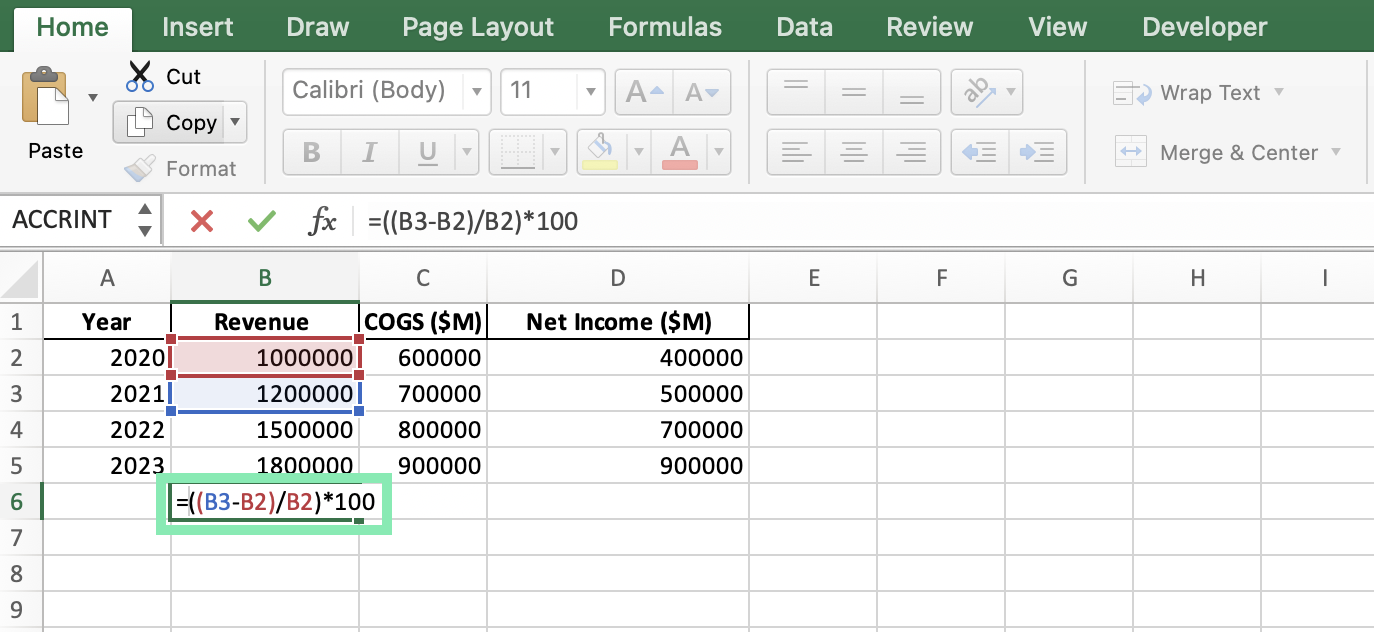
Leveraging Spreadsheets (Excel/Google Sheets) for Automation
Spreadsheets are indispensable financial tools. They allow you to set up formulas once and apply them to countless data points.
Steps in a Spreadsheet:
- Input Data: Place your Original Value in one cell (e.g., A2) and your New Value in another (e.g., B2).
- Apply Formula: In a third cell (e.g., C2), enter the formula:
=(B2-A2)/A2. - Format as Percentage: Select cell C2, then click the “Percentage Style” button (usually found in the Number group on the Home tab) to display the result as a percentage. You can also adjust the number of decimal places.
This method is incredibly efficient for tracking multiple investments, monthly expenses, or business revenues over time.
Online Calculators and Financial Software
Numerous websites and financial software packages offer dedicated percentage change calculators. These are convenient for quick, one-off calculations without needing to set up a spreadsheet. Many investment platforms and personal finance apps also incorporate percent change calculations directly into their dashboards, showing you your portfolio’s growth or savings rate at a glance.
Mental Math Shortcuts for Quick Estimates
For rough estimates or quick checks, some mental math techniques can be useful:
- Halving/Doubling: A 100% increase means the value doubled. A 50% increase means it grew by half.
- 10% Rule: To find 10% of a number, just move the decimal point one place to the left. For example, 10% of $500 is $50. If something increased from $500 to $550, it’s a 10% increase.
- Breaking Down Large Percentages: A 25% increase is 10% + 10% + 5%. If a value increases from $200 to $250, the increase is $50. $50 is 10% of $200 (which is $20) plus 10% ($20) plus 5% ($10), so it is a 25% increase.
While not precise, these shortcuts can help you quickly assess if a calculated percentage makes sense or to get a general idea without reaching for a calculator.
Interpreting and Communicating Percentage Changes Effectively
Calculating the percent increase is only half the battle; understanding its implications and conveying them clearly is equally crucial for sound financial management.
Contextualizing Financial Data
A percentage increase is rarely meaningful in isolation. It must be viewed within its appropriate context:
- Timeframe: Is the 20% increase over a month, a year, or five years? The longer the period, the less impressive a raw percentage might be.
- Industry Benchmarks: Is a 15% revenue increase good for your industry? In a fast-growing tech sector, it might be average, but in a mature manufacturing industry, it could be stellar.
- Absolute Values: As discussed, a 100% increase from $1 to $2 is different from a 10% increase from $1 million to $1.1 million. The absolute dollar change provides a vital layer of context.
- Inflation: Always consider if the percent increase is “real” (above inflation) or “nominal” (before adjusting for inflation).
Visualizing Growth Trends
For presentations, reports, or even personal review, visualizing percent increases through charts and graphs can significantly enhance understanding. Line graphs are excellent for showing trends over time (e.g., monthly portfolio growth), while bar charts can compare percent increases across different categories (e.g., departmental budget increases). These visuals make complex data accessible and highlight patterns that might be missed in raw numbers alone.
Making Informed Decisions Based on Percentages
Ultimately, the goal of calculating and interpreting percent increase is to inform better financial decisions.
- Investment Strategy: A consistently low percent increase in a particular asset might signal a need to re-evaluate its place in your portfolio. High, sustainable increases could justify further investment.
- Business Operations: Analyzing percent changes in costs, revenues, and efficiency metrics can pinpoint areas for optimization, investment, or divestment.
- Personal Budgeting: Observing percent increases in categories like “dining out” or “entertainment” can highlight areas for cutting back, while increases in “savings” or “investments” validate positive financial habits.
By mastering the calculation and contextual interpretation of percent increase, individuals and businesses alike can gain a powerful quantitative lens through which to view their financial world, enabling them to navigate challenges and capitalize on opportunities with greater confidence and insight. This fundamental financial tool is not just about numbers; it’s about understanding progress, anticipating future trends, and making strategic choices that lead to greater prosperity.
aViewFromTheCave is a participant in the Amazon Services LLC Associates Program, an affiliate advertising program designed to provide a means for sites to earn advertising fees by advertising and linking to Amazon.com. Amazon, the Amazon logo, AmazonSupply, and the AmazonSupply logo are trademarks of Amazon.com, Inc. or its affiliates. As an Amazon Associate we earn affiliate commissions from qualifying purchases.