
Understanding the Essence of Inflation
Inflation stands as a fundamental economic concept, representing the rate at which the general level of prices for goods and services is rising, and consequently, the purchasing power of currency is falling. In simpler terms, it means your money buys less today than it did yesterday. This seemingly abstract economic force has tangible impacts, directly influencing household budgets, investment returns, and the strategic decisions of businesses.
Tracking inflation is not merely an academic exercise; it’s a critical component of sound financial planning and economic analysis. For individuals, understanding inflation helps in making informed decisions about saving, spending, and investing to preserve or grow their wealth. For investors, it dictates real returns and influences asset allocation strategies. Businesses must account for rising costs and adjust pricing to maintain profitability, while policymakers use inflation data to guide monetary policy, aiming for price stability and sustainable economic growth. Without a clear grasp of inflation, both personal and corporate financial strategies can be severely undermined. While there are various forms, such as demand-pull (excess demand) and cost-push (rising production costs), the core impact remains the erosion of purchasing power.
The Core Formula for Inflation Calculation
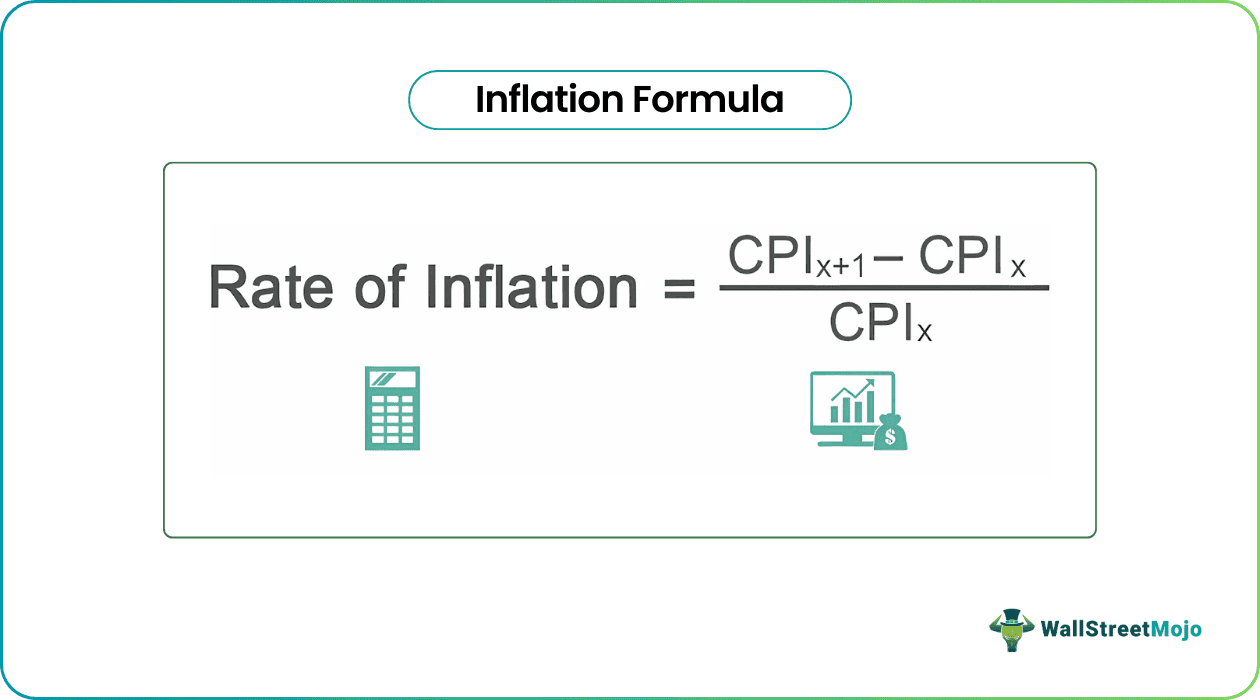
The most common and widely recognized method for calculating the inflation rate involves using a price index, primarily the Consumer Price Index (CPI). The CPI measures the average change over time in the prices paid by urban consumers for a market basket of consumer goods and services.
Introducing the Consumer Price Index (CPI)
The CPI serves as the benchmark for measuring inflation from the perspective of the consumer. It aggregates the prices of a representative “basket” of goods and services, including food, housing, apparel, transportation, medical care, education, and recreation. By comparing the cost of this basket over different periods, we can quantify the rate of price change.
The Basic Formula: Measuring Price Change Over Time
To calculate the inflation rate between two periods using the CPI, the following formula is applied:
Inflation Rate = [(Current Period CPI - Previous Period CPI) / Previous Period CPI] * 100
Let’s break down the components:
-
Current Period CPI: This is the Consumer Price Index value for the most recent period you are analyzing (e.g., the current month or year).
-
Previous Period CPI: This is the Consumer Price Index value for the earlier period against which you are comparing (e.g., the same month last year, or the previous quarter).
-
Percentage Multiplier (100): Multiplying by 100 converts the decimal result into a percentage, making it easier to understand and communicate.
The choice of “current” and “previous” periods is crucial. Most commonly, inflation is reported as a year-over-year rate, comparing the CPI of the current month to the CPI of the same month in the previous year. This approach helps to smooth out seasonal fluctuations. However, month-over-month or quarter-over-quarter rates can also be calculated to observe more immediate trends, though these are often annualized to provide a comparable figure.
Example Calculation
Let’s illustrate with a hypothetical example:
Suppose the Consumer Price Index for January 2023 was 300.0, and for January 2022 it was 290.0. To calculate the year-over-year inflation rate for January 2023:
-
Identify Current Period CPI: CPI (January 2023) = 300.0
-
Identify Previous Period CPI: CPI (January 2022) = 290.0
-
Apply the Formula:
Inflation Rate =
[(300.0 - 290.0) / 290.0] * 100Inflation Rate =
[10.0 / 290.0] * 100Inflation Rate =
0.03448 * 100Inflation Rate =
3.45%(rounded to two decimal places)
This calculation indicates that prices, as measured by the CPI, increased by approximately 3.45% from January 2022 to January 2023. This is the rate at which purchasing power eroded during that period for the typical consumer basket.
Key Indicators and Data Sources
While the CPI is the most prominent indicator, several other indices and data sources provide a comprehensive view of inflation, each with distinct methodologies and applications.
The Consumer Price Index (CPI)
The Bureau of Labor Statistics (BLS) in the United States, along with national statistical agencies globally, is the primary source for CPI data. It publishes monthly reports detailing changes across various categories. The CPI is constructed by surveying thousands of households to determine expenditure patterns, then collecting price data for approximately 80,000 goods and services monthly.
-
What it measures: Changes in the prices of a fixed “basket” of consumer goods and services.
-
How it’s compiled: Through extensive surveys of consumer spending and price collection in urban areas.
-
Limitations:
-
Substitution Bias: Assumes consumers buy the same basket regardless of price changes, while in reality, they might substitute cheaper alternatives.
-
Quality Bias: Struggles to account for improvements in product quality over time that may justify higher prices.
-
New Goods Bias: Slow to incorporate new products into the basket, missing early price changes.
-
Core vs. Headline: The headline CPI includes volatile items like food and energy, while “core CPI” excludes them to provide a clearer picture of underlying inflation trends.
-
The Producer Price Index (PPI)

Also published by the BLS, the PPI measures the average change over time in the selling prices received by domestic producers for their output. It covers prices at the wholesale level, before goods reach the consumer.
-
What it measures: Prices at various stages of production (raw materials, intermediate goods, finished goods).
-
Relationship to CPI: Often seen as a leading indicator of consumer inflation, as increases in producer costs typically get passed on to consumers eventually.
The Personal Consumption Expenditures (PCE) Price Index
The PCE Price Index, published by the Bureau of Economic Analysis (BEA), is the Federal Reserve’s preferred measure of inflation.
-
Why the Federal Reserve prefers it:
-
It covers a broader range of goods and services than the CPI.
-
It uses a “chained” method, allowing for changes in consumption patterns and substitutions, which makes it less prone to substitution bias.
-
Weights for different categories are updated more frequently than the CPI.
-
-
Differences from CPI: While both measure inflation, the PCE’s broader scope and dynamic weighting make it a more comprehensive gauge of overall consumer spending and inflationary pressures. Like the CPI, a “core PCE” index is often used to strip out volatile food and energy prices.
Other Measures
-
GDP Deflator: A measure of the average level of prices of all new, domestically produced, final goods and services in an economy. It is broader than the CPI as it includes all components of GDP (consumption, investment, government spending, and net exports).
-
Regional Indices: Inflation can vary significantly by geographic region, so specific regional or metropolitan area CPIs are published for localized analysis.
Practical Applications and Implications for Your Finances
Understanding and calculating inflation is not an abstract economic exercise; it directly impacts personal financial planning, investment strategies, and business financial health.
Personal Finance Planning
Inflation erodes the purchasing power of money, making thoughtful financial planning essential.
-
Budgeting: Regularly review and adjust your budget to account for rising costs. What cost $100 last year might cost $103 or $105 this year. Without adjusting, you’ll feel a pinch.
-
Retirement Planning: Inflation is a significant threat to retirement savings. A comfortable retirement sum today will buy less in 20 or 30 years. Financial planners often incorporate a 2-3% annual inflation rate into long-term projections to ensure retirement nest eggs are sufficient to maintain desired lifestyles.
-
Salary Negotiations: When discussing salary increases, it’s crucial to consider the inflation rate. A 3% raise in a 5% inflationary environment results in a net decrease in real purchasing power. Aim for raises that at least keep pace with inflation to maintain your standard of living.
Investing Strategies
Inflation profoundly influences investment returns and portfolio construction.
-
Inflation-Indexed Securities: Treasury Inflation-Protected Securities (TIPS) are designed to protect investors from inflation. Their principal value adjusts with the CPI, providing a hedge.
-
Real Estate: Historically, real estate has often served as an inflation hedge. Property values and rental income tend to rise with inflation, offering a degree of protection against currency devaluation.
-
Commodities and Precious Metals: Gold, silver, and other commodities like oil or agricultural products are often seen as inflation hedges. Their prices tend to increase when the value of fiat currency declines.
-
Dividend Stocks vs. Growth Stocks: In an inflationary environment, dividend-paying stocks from companies with strong pricing power can be attractive, as their dividends may grow alongside inflation. Growth stocks, while potentially offering higher returns, can be more sensitive to rising interest rates, which often accompany efforts to combat inflation.
Business Finance Decisions
For businesses, inflation impacts everything from operational costs to strategic planning.
-
Pricing Strategies: Companies must constantly monitor their input costs (raw materials, labor, energy) and adjust product or service pricing to maintain profit margins. Failing to account for inflation can quickly erode profitability.
-
Cost Management and Supply Chain Resilience: Inflation highlights the importance of efficient cost management and diversifying supply chains to mitigate the impact of rising input prices. Long-term contracts might be revisited, and hedging strategies for commodities might be employed.
-
Forecasting Revenue and Expenses: Accurate financial forecasting requires integrating inflation expectations. Projecting future revenues must consider potential price increases, while expense forecasts must account for higher operational costs.
-
Capital Expenditure Decisions: The cost of new equipment, facilities, and technology will increase with inflation. Businesses need to factor these rising costs into their capital budgeting decisions, potentially accelerating investments to lock in current prices or delaying them if they anticipate disinflation.
Beyond the Basics: Advanced Considerations
While the core formula provides a direct method for calculating inflation, a deeper understanding requires acknowledging nuances and broader economic contexts.
Core vs. Headline Inflation
As touched upon, headline inflation includes all goods and services in the consumer basket, while core inflation excludes volatile food and energy prices. Policymakers and analysts often focus on core inflation to discern underlying inflationary trends, believing it better reflects the economy’s structural price pressures, free from transient supply shocks. For personal finance, however, headline inflation is arguably more relevant, as food and energy are unavoidable expenses for most households.
Annualized vs. Monthly Rates
Inflation is frequently reported as a month-over-month (M/M) or quarter-over-quarter (Q/Q) rate, which can then be annualized. An annualized rate projects what the inflation rate would be if the observed monthly or quarterly trend continued for a full year. While useful for showing immediate momentum, these short-term annualized rates can be highly volatile and may not accurately predict the long-term trend. Year-over-year (Y/Y) rates, which compare a given month to the same month in the previous year, are generally preferred for macro analysis as they smooth out seasonal variations.
Regional Differences
Inflation is not uniform across a country. Specific regions or metropolitan areas may experience higher or lower rates of price increases depending on local supply and demand dynamics, housing markets, energy costs, and other localized factors. For individuals and businesses operating in specific locales, consulting regional CPI data can provide a more accurate picture of their particular inflationary environment.

Global Inflation
In an increasingly interconnected global economy, domestic inflation rates are often influenced by international factors. Global supply chain disruptions, currency fluctuations, and commodity price movements can transmit inflationary pressures across borders. Understanding these global dynamics is crucial for investors with international portfolios and businesses engaged in global trade. The calculation methods might remain local, but the root causes and contributing factors are often global in scope, adding another layer of complexity to financial analysis and planning.
aViewFromTheCave is a participant in the Amazon Services LLC Associates Program, an affiliate advertising program designed to provide a means for sites to earn advertising fees by advertising and linking to Amazon.com. Amazon, the Amazon logo, AmazonSupply, and the AmazonSupply logo are trademarks of Amazon.com, Inc. or its affiliates. As an Amazon Associate we earn affiliate commissions from qualifying purchases.