
Understanding and accurately calculating growth is a cornerstone of sound financial analysis, whether you’re a seasoned investor, a budding entrepreneur, or simply managing your personal finances. It provides an objective measure of progress, performance, and potential, transforming raw data into actionable insights. In the world of money, growth is not just a desirable outcome; it’s a critical metric for evaluating investments, assessing business health, and planning for future financial security. This article delves into the various methods of calculating growth, their applications across different financial contexts, and the nuances necessary for accurate interpretation.
Understanding the Essence of Growth in Finance
At its core, financial growth signifies an increase in value over a period. This value could be anything from your personal savings and investment portfolio to a company’s revenue, profit, or market capitalization, or even the Gross Domestic Product (GDP) of an entire nation. Grasping the concept of growth is the first step toward making informed financial decisions.

Why Growth Matters: From Personal Wealth to Corporate Performance
For individuals, understanding the growth of their assets – be it a savings account, a retirement fund, or real estate – is fundamental to wealth accumulation. It helps assess whether financial goals are being met and if current strategies are effective. For instance, knowing the compound annual growth rate (CAGR) of your investment portfolio allows you to project future wealth and adjust your savings or investment strategies accordingly.
In the business world, growth metrics are vital for stakeholders, including management, investors, and creditors. Companies track growth in various areas:
-
Revenue Growth: Indicates how effectively a company is selling its products or services.
-
Profit Growth: Shows an increase in earnings, reflecting operational efficiency and market demand.
-
Market Share Growth: Demonstrates a company’s expanding influence within its industry.
-
Asset Growth: Signifies expansion in the company’s resource base.
Strong, sustainable growth often correlates with increased shareholder value, greater financial stability, and enhanced opportunities for future expansion. Conversely, a lack of growth, or even contraction, signals potential problems that need immediate attention.
The Different Faces of Growth: Absolute vs. Relative
When we talk about growth, it’s important to distinguish between absolute and relative measures.
-
Absolute Growth: This refers to the raw numerical increase in a value. For example, if your investment portfolio grew from $100,000 to $110,000, the absolute growth is $10,000. While straightforward, absolute figures alone can sometimes be misleading without context. A $10,000 growth from a $100,000 portfolio is very different from a $10,000 growth from a $1,000,000 portfolio.
-
Relative Growth (Percentage Change): This expresses the absolute change as a proportion of the starting value, typically as a percentage. Using the previous example, a $10,000 growth from $100,000 is a 10% growth. This relative measure provides a standardized way to compare performance across different scales and periods, making it invaluable for financial analysis. The majority of growth calculations in finance rely on percentage change to offer a comparable and insightful perspective.
Fundamental Growth Calculation Methods
While the concept of growth is simple, its calculation can take several forms depending on the data available and the specific insight you seek. Mastering these fundamental methods is crucial for anyone engaging with financial data.
Simple Growth Rate (Percentage Change)
The most basic and widely used method to calculate growth is the simple percentage change. This method determines the increase or decrease of a value relative to its initial amount over a single period.
Formula:
$$ text{Simple Growth Rate} = left( frac{text{Ending Value} – text{Beginning Value}}{text{Beginning Value}} right) times 100 $$
Example:
If a company’s quarterly revenue increased from $500,000 to $550,000, the simple growth rate would be:
$$ left( frac{$550,000 – $500,000}{$500,000} right) times 100 = left( frac{$50,000}{$500,000} right) times 100 = 0.10 times 100 = 10% $$
The revenue grew by 10% for that quarter.
When to Use It:
This method is ideal for quick comparisons over short, distinct periods (e.g., quarter-over-quarter, year-over-year revenue growth) or when measuring a one-time change. It’s straightforward and provides an immediate understanding of recent performance.
Compound Annual Growth Rate (CAGR)
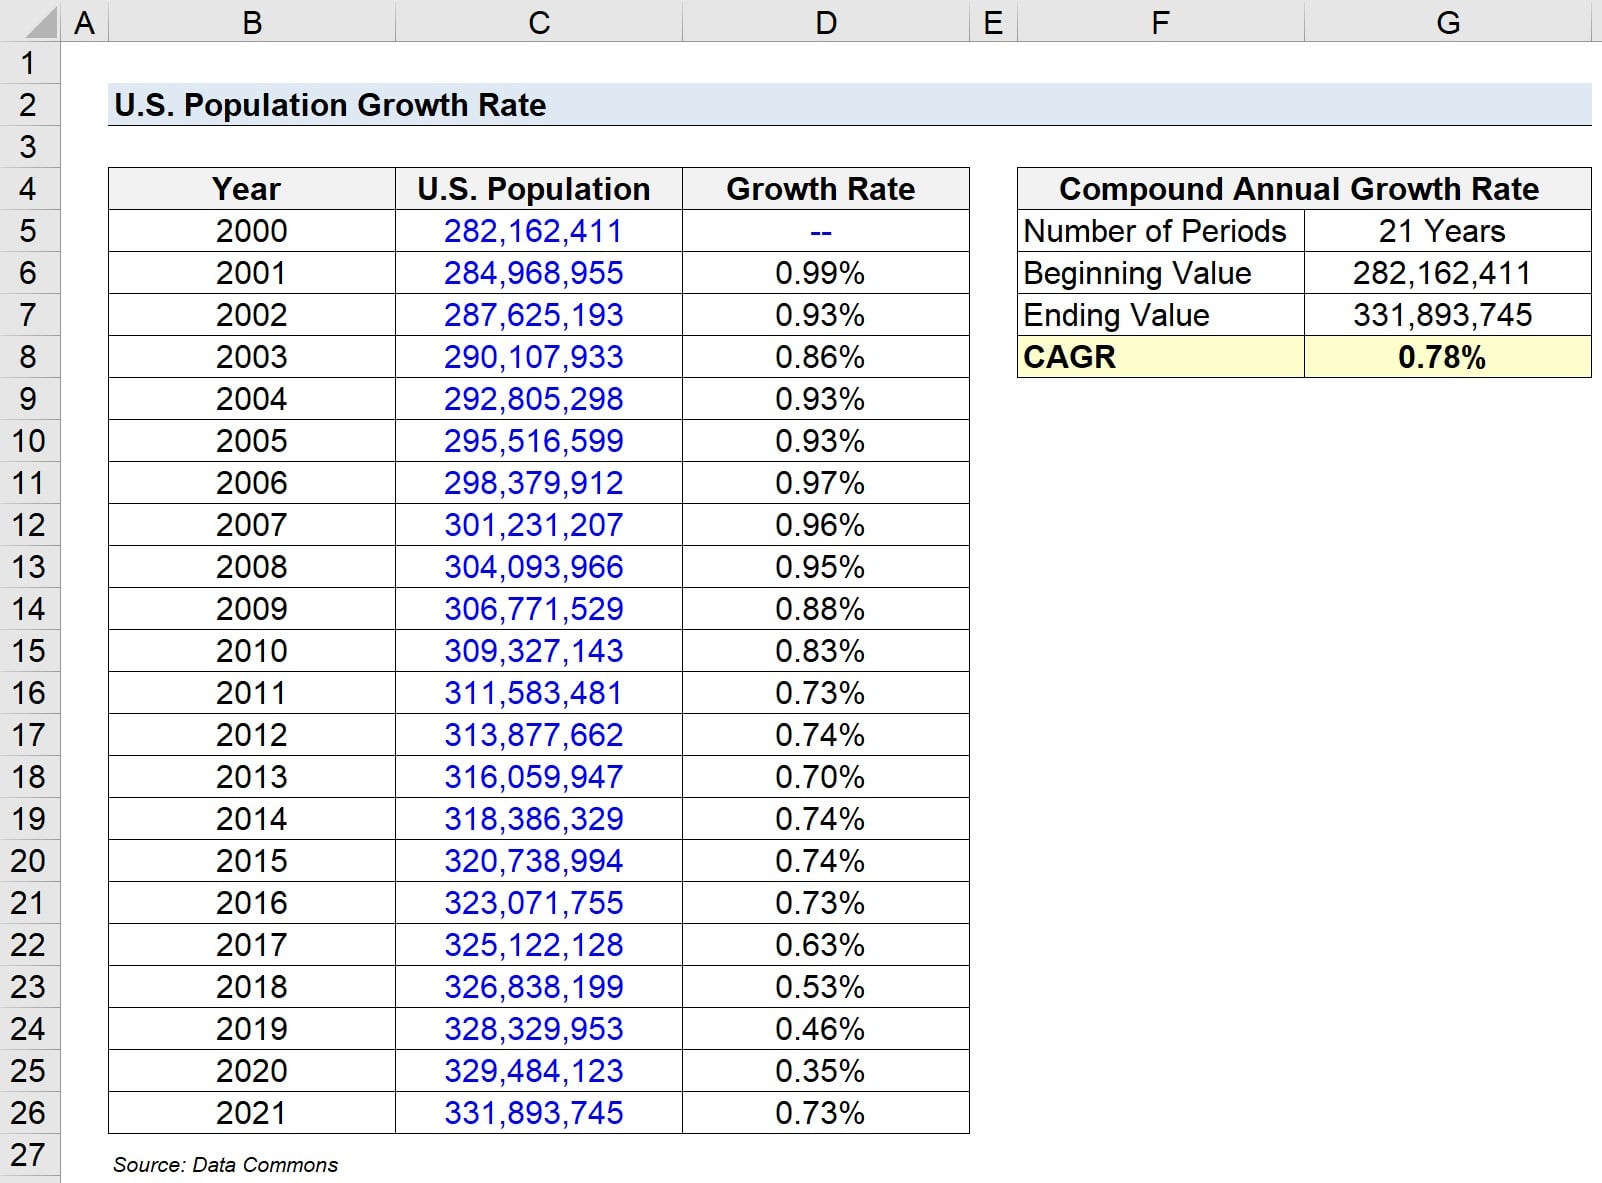
CAGR is a more sophisticated and often preferred method for calculating growth over multiple periods. Unlike the simple annual growth rate, which can fluctuate wildly year-to-year, CAGR smooths out volatility and provides a theoretical constant rate of growth that would lead to the final value from the initial value, assuming profits are reinvested at the end of each period. It effectively accounts for the compounding effect.
Formula:
$$ text{CAGR} = left( left( frac{text{Ending Value}}{text{Beginning Value}} right)^{frac{1}{text{Number of Years}}} – 1 right) times 100 $$
Example:
Imagine an investment portfolio grew from $10,000 to $16,000 over 3 years.
$$ text{CAGR} = left( left( frac{$16,000}{$10,000} right)^{frac{1}{3}} – 1 right) times 100 $$
$$ text{CAGR} = left( (1.6)^{frac{1}{3}} – 1 right) times 100 $$
$$ text{CAGR} = (1.1696 – 1) times 100 = 0.1696 times 100 = 16.96% $$
This means the investment grew at an average annual rate of approximately 16.96% over the three years, assuming compounding.
When to Use It:
CAGR is particularly useful for measuring investment returns, business revenue growth over several years, or the performance of any metric where the compounding effect is relevant. It provides a more accurate and representative picture of average annual growth compared to simply averaging individual annual growth rates, especially when there’s significant year-to-year fluctuation.
Average Annual Growth Rate (AAGR)
The Average Annual Growth Rate (AAGR) is less commonly used for financial performance where compounding is a factor, but it has its place. It’s simply the arithmetic mean of the individual annual growth rates.
Formula:
$$ text{AAGR} = frac{sum (text{Annual Growth Rates})}{text{Number of Years}} $$
Example:
Year 1 growth: 10%
Year 2 growth: 5%
Year 3 growth: 15%
$$ text{AAGR} = frac{10% + 5% + 15%}{3} = frac{30%}{3} = 10% $$
When to Use It:
AAGR can be used for metrics that do not compound, or for a quick, simplified average when the nuances of compounding are not strictly necessary or desired. However, for investment or business finance, CAGR is almost always preferred due to its more realistic depiction of growth over time.
Applying Growth Calculations in Key Financial Areas

The utility of growth calculations spans across virtually all facets of financial management and analysis. From tracking personal wealth to dissecting corporate financial statements, these metrics provide crucial insights.
Investment Performance: Measuring Portfolio Returns
Investors rely heavily on growth calculations to evaluate the success of their investment strategies.
-
Portfolio Growth: CAGR is the gold standard for comparing the long-term performance of different investments (stocks, bonds, mutual funds, real estate) or entire portfolios, as it accounts for the reinvestment of earnings.
-
Asset Class Growth: Analyzing the growth of specific asset classes (e.g., technology stocks vs. value stocks) helps in asset allocation decisions.
-
Benchmarking: Investors often compare their portfolio’s growth rate against a relevant market index (e.g., S&P 500 growth) to determine if they are outperforming or underperforming the market.
Business Finance: Tracking Revenue, Profit, and Market Share Growth
For businesses, growth metrics are integral to strategic planning, operational assessment, and investor relations.
-
Revenue Growth: Often the primary indicator of a company’s top-line performance. Consistent revenue growth is critical for attracting investment and sustaining operations.
-
Profit Growth (Net Income, EBITDA): Reflects the company’s ability to increase earnings, indicating efficiency and profitability.
-
Earnings Per Share (EPS) Growth: A key metric for publicly traded companies, as it directly impacts share price and investor sentiment.
-
Market Share Growth: Shows an expansion of a company’s presence within its industry, often a result of successful marketing, product development, or competitive advantage.
Personal Finance: Assessing Savings and Net Worth Progression
Individuals can apply growth calculations to their personal financial situations to monitor progress towards goals.
-
Savings Growth: Tracking the growth of your emergency fund or long-term savings helps ensure you’re on target.
-
Net Worth Growth: Calculating the year-over-year percentage change in your net worth (assets minus liabilities) provides a comprehensive view of your financial health and progress toward wealth accumulation.
-
Retirement Fund Growth: Understanding the CAGR of your retirement accounts is vital for projecting future income and adjusting contributions.
Economic Indicators: GDP Growth and Inflation Rates
On a macroeconomic level, growth calculations provide insight into the health and direction of national and global economies.
-
GDP Growth: The most common measure of economic growth, indicating the expansion or contraction of a country’s total economic output. Positive GDP growth generally signifies a healthy economy with job creation and rising incomes.
-
Inflation Rate: Measures the rate at which the general level of prices for goods and services is rising, and subsequently, purchasing power is falling. While not growth in a positive sense, it’s a critical growth rate to monitor as it impacts the real (inflation-adjusted) growth of investments and incomes.
Advanced Considerations and Common Pitfalls
While the formulas for calculating growth are straightforward, their application in real-world financial scenarios demands careful consideration. Overlooking certain factors can lead to misinterpretations and poor decision-making.
The Impact of Time Horizon and Volatility
Growth rates can vary significantly depending on the time period chosen. Short-term growth can be highly volatile due to temporary market fluctuations, seasonal effects, or one-off events. Longer time horizons tend to smooth out these variations, providing a more reliable indicator of underlying trends. When comparing investments or business performance, always ensure you’re using comparable time frames. A company boasting 50% growth in one quarter might have a much lower CAGR over five years.
Normalization and Seasonality Adjustments
Some businesses experience predictable fluctuations based on the time of year (e.g., retail sales around holidays). When analyzing quarterly or monthly growth, it’s crucial to account for seasonality. “Year-over-year” comparisons (e.g., Q1 this year vs. Q1 last year) are often preferred over “quarter-over-quarter” for seasonal businesses to normalize data and provide a more accurate picture of true growth.
The Perils of Misinterpreting Growth Data
Growth figures, while powerful, can be manipulated or misinterpreted.
-
Base Effect: High growth rates can look impressive on a small base (e.g., 100% growth from $1,000 to $2,000 is less significant than 10% growth from $1 billion to $1.1 billion). Always consider the absolute values behind the percentages.
-
Non-Recurring Events: A sudden spike in growth due to a one-time sale of an asset or an acquisition might not be sustainable and can skew future projections if not properly identified.
-
Inflation: Nominal growth rates (not adjusted for inflation) can give a false sense of prosperity. Real growth rates (nominal growth minus inflation) provide a more accurate picture of purchasing power increase.
The Role of Benchmarking
Calculating growth in isolation offers limited insight. To truly understand performance, growth rates should be benchmarked against relevant comparables:
-
Industry Averages: How does a company’s revenue growth compare to its peers in the same industry?
-
Market Indices: How does an investment portfolio’s growth compare to a broad market index like the S&P 500?
-
Historical Performance: Is the current growth rate an improvement or decline from past periods?
Benchmarking provides context and helps determine whether a growth rate is exceptional, average, or concerning.
Leveraging Growth Calculations for Strategic Decision-Making
Accurate growth calculations are not just academic exercises; they are vital tools that empower individuals and organizations to make strategic decisions. They provide the quantitative basis for future planning and resource allocation.
Forecasting Future Performance
Historical growth rates, particularly CAGR, are often used as a starting point for forecasting future financial performance. Businesses project future revenue, profit, and cash flow based on past growth trends, adjusting for market conditions, strategic initiatives, and economic outlook. Investors use historical growth to estimate future earnings and potential stock price appreciation. However, it’s crucial to remember that past performance is not necessarily indicative of future results, and forecasts should always incorporate qualitative factors and forward-looking analyses.
Identifying Investment Opportunities
For investors, growth rates are a primary filter for identifying attractive opportunities. Companies demonstrating consistent, high-quality revenue and earnings growth are often favored, as they suggest a strong business model, competitive advantage, and potential for future value creation. Analysts use growth rates to perform valuation models, such as the Discounted Cash Flow (DCF) model or the Dividend Discount Model (DDM), which rely on projected growth to determine intrinsic value. Identifying industries or sectors with strong macroeconomic growth trends can also guide investment allocation.
Guiding Business Strategy and Resource Allocation
Within a business, growth metrics are indispensable for guiding strategic decisions.
-
Product Development: High growth in a particular product line might warrant increased R&D investment.
-
Market Expansion: Strong growth in a specific geographic region could justify further expansion efforts.
-
Operational Efficiency: Declining profit growth despite rising revenue might signal a need to review cost structures or operational processes.
-
Capital Allocation: Management uses growth forecasts to decide where to invest capital – whether in new equipment, acquisitions, or share buybacks – to maximize shareholder value.
By consistently monitoring and analyzing various growth rates, businesses can adapt to changing market dynamics, capitalize on opportunities, and mitigate risks, thereby ensuring long-term sustainability and profitability.
Conclusion
Calculating growth is a fundamental skill in finance, providing the quantitative lens through which we evaluate progress, performance, and potential. From the simple percentage change to the more nuanced Compound Annual Growth Rate, each method serves a specific purpose, offering insights into personal wealth accumulation, corporate health, and macroeconomic trends. However, mere calculation is insufficient; critical interpretation, an understanding of contextual factors like time horizon and inflation, and diligent benchmarking are equally vital. By mastering the art of calculating and understanding growth, individuals and organizations alike can unlock deeper financial insights, make more informed decisions, and navigate the complex financial landscape with greater confidence and strategic foresight.
aViewFromTheCave is a participant in the Amazon Services LLC Associates Program, an affiliate advertising program designed to provide a means for sites to earn advertising fees by advertising and linking to Amazon.com. Amazon, the Amazon logo, AmazonSupply, and the AmazonSupply logo are trademarks of Amazon.com, Inc. or its affiliates. As an Amazon Associate we earn affiliate commissions from qualifying purchases.