
Understanding and accurately calculating the price level is a cornerstone of sound financial analysis, crucial for businesses, investors, and individuals alike. It provides a vital snapshot of an economy’s health, revealing trends in inflation, purchasing power, and the overall cost of living or doing business. Far from being a mere academic exercise, tracking the price level offers actionable insights that inform strategic decisions, from investment portfolio adjustments to operational budgeting.
Understanding the Concept of Price Level
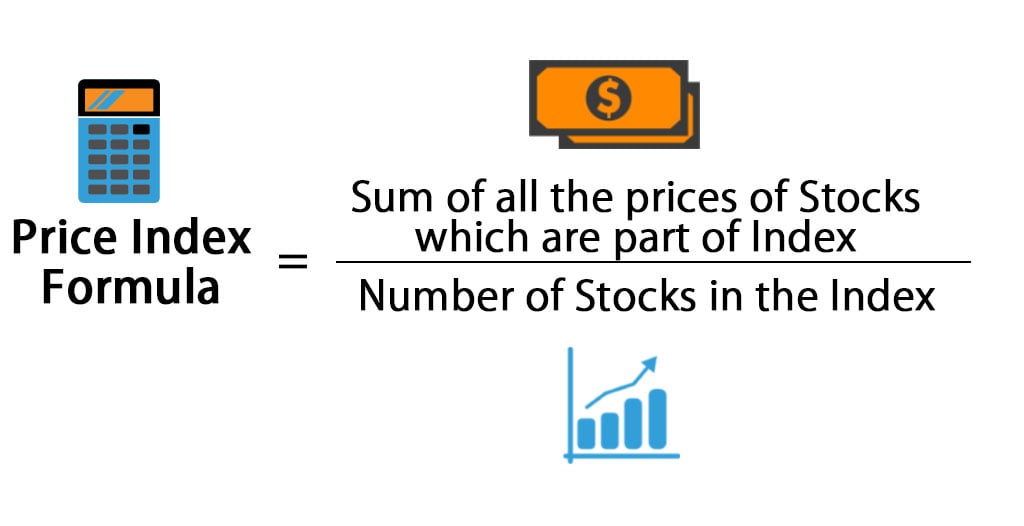
The price level refers to the average of current prices across an entire economy or a specific market basket of goods and services. It’s a broad economic indicator, not the price of a single item, but rather a composite measure that helps to quantify the general cost of goods and services over time.
What is the Price Level?
At its core, the price level represents the relative cost of a standard set of goods and services at a particular point in time. It’s often expressed as an index number, which compares the current cost of this “basket” to its cost in a chosen base period. A higher price level indicates that, on average, goods and services are more expensive, while a lower price level suggests they are cheaper. This average is critical because individual prices can fluctuate widely, but the overall trend captured by the price level offers a more stable and representative view of economic conditions. For businesses, this impacts everything from raw material costs to consumer spending power, directly affecting revenue and profit margins.
Why is Price Level Important?
The importance of the price level stems from its direct implications for inflation, purchasing power, and economic policy.
-
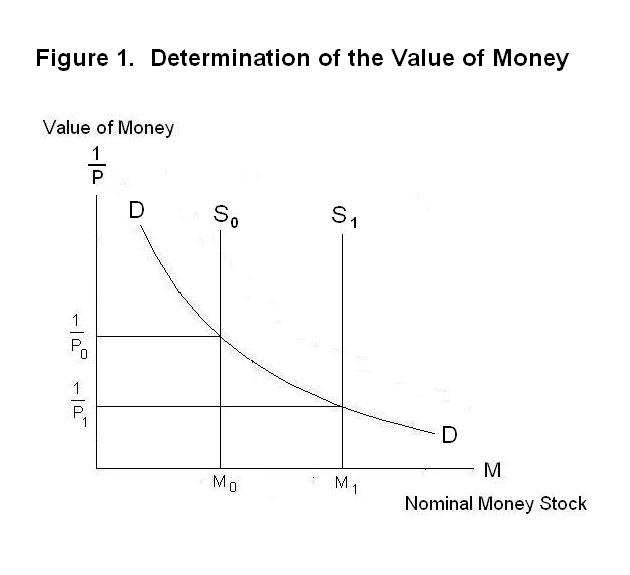
Inflation and Deflation: Changes in the price level are the primary way inflation (a sustained increase in the general price level) or deflation (a sustained decrease) is measured. Inflation erodes the purchasing power of money, meaning a dollar today buys less than it did yesterday. For businesses, this can mean higher operational costs, while for consumers, it reduces their disposable income. Deflation, while seemingly positive, can signal economic contraction and reduced demand, often leading to lower profits and investment.
-
Purchasing Power: The price level directly influences purchasing power. If prices rise faster than incomes, purchasing power declines. Financial planning, investment strategies, and wage negotiations all depend on an accurate understanding of how purchasing power is evolving. Investors, for instance, need to ensure their returns outpace inflation to achieve real growth.
-
Economic Policy: Central banks and governments closely monitor price levels to formulate monetary and fiscal policies. Decisions regarding interest rates, government spending, and taxation are often made with the goal of maintaining price stability—a moderate, predictable rate of inflation that supports economic growth without eroding purchasing power excessively.
Key Measures of Price Level
Several key indices are used to calculate and track the price level, each offering a slightly different perspective on economic inflation and the cost of goods and services. The most prominent include the Consumer Price Index (CPI), the Producer Price Index (PPI), and the GDP Deflator.
Consumer Price Index (CPI)
The Consumer Price Index (CPI) is perhaps the most widely recognized measure of the price level. It measures the average change over time in the prices paid by urban consumers for a market basket of consumer goods and services.
-
How it’s Constructed: The CPI is constructed by first identifying a representative “market basket” of goods and services typically purchased by households. This basket includes a wide range of categories, such as food, housing, apparel, transportation, medical care, education, and recreation. The prices of these items are then tracked over time. A “base year” is chosen, and the cost of the market basket in that year is set as the reference point, usually indexed to 100.
-
Calculation Formula: To calculate the CPI for a given year, the following formula is used:
$$ text{CPI} = left( frac{text{Cost of Market Basket in Current Year}}{text{Cost of Market Basket in Base Year}} right) times 100 $$
If the CPI for a given year is 120, it means that the cost of the market basket has increased by 20% since the base year. This metric is critical for adjusting wages, social security benefits, and understanding the real return on investments.
Producer Price Index (PPI)
The Producer Price Index (PPI) measures the average change over time in the selling prices received by domestic producers for their output. Unlike the CPI, which looks at prices from the consumer’s perspective, the PPI captures price changes from the seller’s perspective, often at the wholesale level.
-
What it Measures: The PPI covers prices for commodities, processed goods, and services at various stages of production (e.g., crude materials, intermediate goods, finished goods). It tracks prices before they reach the retail level, encompassing industries such as manufacturing, mining, agriculture, and services.
-
Its Role as a Leading Indicator: Because the PPI measures prices earlier in the supply chain, it is often considered a leading indicator of consumer inflation. Increases in producer prices for raw materials or intermediate goods can signal that higher prices will eventually be passed on to consumers, influencing future CPI readings. Businesses use PPI data to forecast their input costs and adjust pricing strategies.
GDP Deflator
The GDP Deflator is a broader measure of the overall price level in an economy than either the CPI or PPI. It measures the changes in prices of all new, domestically produced, final goods and services in an economy.
-
Broader Scope: While the CPI focuses on consumer purchases and the PPI on producer sales, the GDP Deflator includes all components of Gross Domestic Product (GDP): consumption, investment, government spending, and net exports. This makes it a comprehensive indicator of economy-wide inflation.
-
Calculation Formula: The GDP Deflator is calculated by dividing Nominal GDP (GDP at current prices) by Real GDP (GDP adjusted for inflation, using base year prices) and multiplying by 100:
$$ text{GDP Deflator} = left( frac{text{Nominal GDP}}{text{Real GDP}} right) times 100 $$
A key difference from the CPI is that the GDP Deflator’s basket of goods and services changes automatically over time to reflect the economy’s current production and consumption patterns, whereas the CPI’s basket is fixed for a period. This makes the GDP Deflator more reflective of overall economic activity and less prone to “substitution bias” where consumers switch to cheaper alternatives for items in a fixed basket.
Step-by-Step Calculation: The CPI Method
While economic agencies perform complex calculations for national indices, understanding the basic methodology, especially through the CPI, provides a practical framework for how price levels are determined. Businesses can adapt this approach for internal tracking of costs relevant to their operations.
Selecting a Base Year
The first step in calculating a price level index like the CPI is to designate a base year. This year serves as the reference point against which prices in other periods will be compared. The cost of the market basket in the base year is assigned an index value, typically 100, which simplifies percentage change calculations. The choice of a base year should ideally be a period of relative economic stability, avoiding times of extreme inflation or recession.

Constructing a Market Basket
A crucial step involves defining a “market basket” of goods and services. For national CPI, this basket represents what a typical urban consumer purchases. For a business, this might be a specific basket of raw materials, operational supplies, or labor costs relevant to their production process. The selection process involves:
-
Identifying Key Items: Pinpointing the most representative and frequently purchased or utilized goods and services.
-
Assigning Weights: Determining the relative importance (or expenditure share) of each item in the basket. For example, housing might have a higher weight than entertainment because consumers spend a larger portion of their income on it. This weighting ensures that price changes in more significant items have a greater impact on the overall index.
Collecting Price Data
Once the market basket is defined, the next step is to systematically collect price data for each item within the basket. This data must be collected consistently across different time periods (e.g., monthly, quarterly, annually) and from various sources (e.g., retailers, suppliers, industry reports) to ensure accuracy and representativeness. For a business tracking its input costs, this means regularly logging supplier prices for weighted components.
Calculating the Cost of the Basket in Different Periods
After collecting the price data, calculate the total cost of the market basket for each period (the base year and the current year being analyzed). This involves multiplying the price of each item by its quantity (or weight) in the basket and then summing these values.
-
Example:
-
Base Year Basket Cost: (Price of Item A in Base Year × Quantity A) + (Price of Item B in Base Year × Quantity B) + …
-
Current Year Basket Cost: (Price of Item A in Current Year × Quantity A) + (Price of Item B in Current Year × Quantity B) + …
Note that the quantities for each item remain constant between the base year and current year calculations. Only the prices change.
-
Applying the CPI Formula with an Example
Let’s illustrate with a simplified example for a hypothetical business tracking two key inputs: steel and plastic.
Market Basket:
-
Steel: 1000 units
-
Plastic: 500 units
Price Data:
-
Base Year (Year 1):
-
Steel: $1.00/unit
-
Plastic: $0.50/unit
-
-
Current Year (Year 2):
-
Steel: $1.20/unit
-
Plastic: $0.60/unit
-
Step 1: Calculate Base Year Basket Cost
-
Steel cost: 1000 units × $1.00/unit = $1000
-
Plastic cost: 500 units × $0.50/unit = $250
-
Total Base Year Basket Cost (Year 1): $1000 + $250 = $1250
Step 2: Calculate Current Year Basket Cost
-
Steel cost: 1000 units × $1.20/unit = $1200
-
Plastic cost: 500 units × $0.60/unit = $300
-
Total Current Year Basket Cost (Year 2): $1200 + $300 = $1500
Step 3: Apply the CPI Formula
$$ text{CPI for Year 2} = left( frac{text{Cost of Basket in Year 2}}{text{Cost of Basket in Year 1}} right) times 100 $$
$$ text{CPI for Year 2} = left( frac{$1500}{$1250} right) times 100 $$
$$ text{CPI for Year 2} = 1.2 times 100 = 120 $$
The CPI for Year 2 is 120. This indicates that the cost of this particular business’s input basket has increased by 20% from Year 1 to Year 2.
Interpreting and Applying Price Level Data
Calculating the price level is just the first step; the true value comes from interpreting this data and applying it to financial decisions and economic analysis.
Measuring Inflation and Deflation
A primary use of price level indices is to measure the rate of inflation or deflation. The inflation rate is the percentage change in the price level from one period to another.
$$ text{Inflation Rate} = left( frac{text{CPI in Current Year} – text{CPI in Previous Year}}{text{CPI in Previous Year}} right) times 100 $$
Using our example, if Year 1 (base year) CPI was 100 and Year 2 CPI was 120, the inflation rate from Year 1 to Year 2 is:
$$ text{Inflation Rate} = left( frac{120 – 100}{100} right) times 100 = 20% $$
This 20% inflation directly impacts financial planning, budgeting, and investment return expectations. High inflation can erode real returns, while deflation can signal economic contraction and reduced demand.
Adjusting for Inflation (Real vs. Nominal Values)
Price level data is essential for distinguishing between nominal and real values.
-
Nominal Value: A value expressed in current dollars, unadjusted for inflation.
-
Real Value: A value adjusted for inflation, reflecting its purchasing power in a base period.
To convert a nominal value to a real value, you use the price level index:
$$ text{Real Value} = frac{text{Nominal Value}}{text{Price Level Index / 100}} $$
For instance, if your salary increased by 10% (nominal increase) but inflation (as measured by CPI) was 8%, your real salary increase is only about 2%. Businesses use this to understand real revenue growth, real profit margins, and the real cost of capital projects, providing a more accurate picture of economic performance free from the distortion of changing prices.
Impact on Businesses and Investors
For businesses, understanding the price level and inflation is critical for:
-
Budgeting and Forecasting: Accurately projecting future costs for raw materials, labor, and overhead.
-
Pricing Strategies: Adjusting product prices to maintain profit margins without losing competitiveness.
-
Investment Decisions: Evaluating the real return on capital investments and comparing project profitability over time.
-
Wage Negotiations: Ensuring that wage increases are sustainable and reflect changes in the cost of living.
Investors use price level data to:
-
Asset Allocation: Shifting investments towards assets that historically perform well during inflationary or deflationary periods.
-
Return Analysis: Calculating real rates of return on investments, ensuring that nominal gains aren’t just an illusion created by inflation.
-
Bond Markets: Inflation expectations heavily influence bond yields, as higher inflation erodes the value of future fixed payments.
By diligently tracking and interpreting price level data, businesses and investors can make more informed, strategic financial decisions that account for the evolving economic landscape.
aViewFromTheCave is a participant in the Amazon Services LLC Associates Program, an affiliate advertising program designed to provide a means for sites to earn advertising fees by advertising and linking to Amazon.com. Amazon, the Amazon logo, AmazonSupply, and the AmazonSupply logo are trademarks of Amazon.com, Inc. or its affiliates. As an Amazon Associate we earn affiliate commissions from qualifying purchases.