
Understanding how to calculate a price increase is a fundamental skill, whether you’re managing a business, tracking personal finances, or analyzing economic trends. Price increases reflect changes in value, cost, and market dynamics, significantly impacting profitability, purchasing power, and financial planning. Mastering these calculations provides clarity and enables informed decision-making.
Understanding the Fundamentals of Price Increases
Before diving into the calculations, it’s essential to grasp the underlying reasons for price adjustments and the key metrics involved. Prices are rarely static; they fluctuate due to a variety of internal and external factors.
Why Prices Change
Several forces can drive a price increase. From a business perspective, the most common reasons include:
-
Inflation: The general increase in prices and fall in the purchasing value of money. This is often an economy-wide phenomenon that necessitates businesses to raise prices to maintain margins and consumers to pay more for goods and services.
-
Increased Cost of Goods Sold (COGS): If the raw materials, labor, manufacturing, or distribution costs for a product or service go up, businesses often pass these increases on to consumers.
-
Supply and Demand Dynamics: When demand for a product or service outstrips its supply, sellers gain pricing power and can increase prices. Conversely, excess supply often leads to price reductions.
-
Value Addition and Product Enhancement: Companies might increase prices after investing in product improvements, adding new features, or enhancing service quality, justifying a higher value proposition.
-
Market Positioning and Strategy: A business might strategically raise prices to position itself as a premium brand or to align with a perceived increase in brand value. Competitor pricing also plays a significant role.
-
Regulatory Changes and Taxes: New taxes, tariffs, or compliance costs can directly impact the final price consumers pay.
Key Metrics
To calculate a price increase, you primarily need two pieces of information:
-
Initial Price (Old Price): The price of the item or service before the increase.
-
New Price: The price of the item or service after the increase.
The goal is to determine the absolute increase and, more commonly, the percentage increase, which provides a standardized way to compare changes regardless of the base price.
Core Methods for Calculating Price Increase
Calculating price increases can range from simple percentage changes for a single item to more complex analyses involving multiple periods or economic indexes.
The Basic Percentage Formula
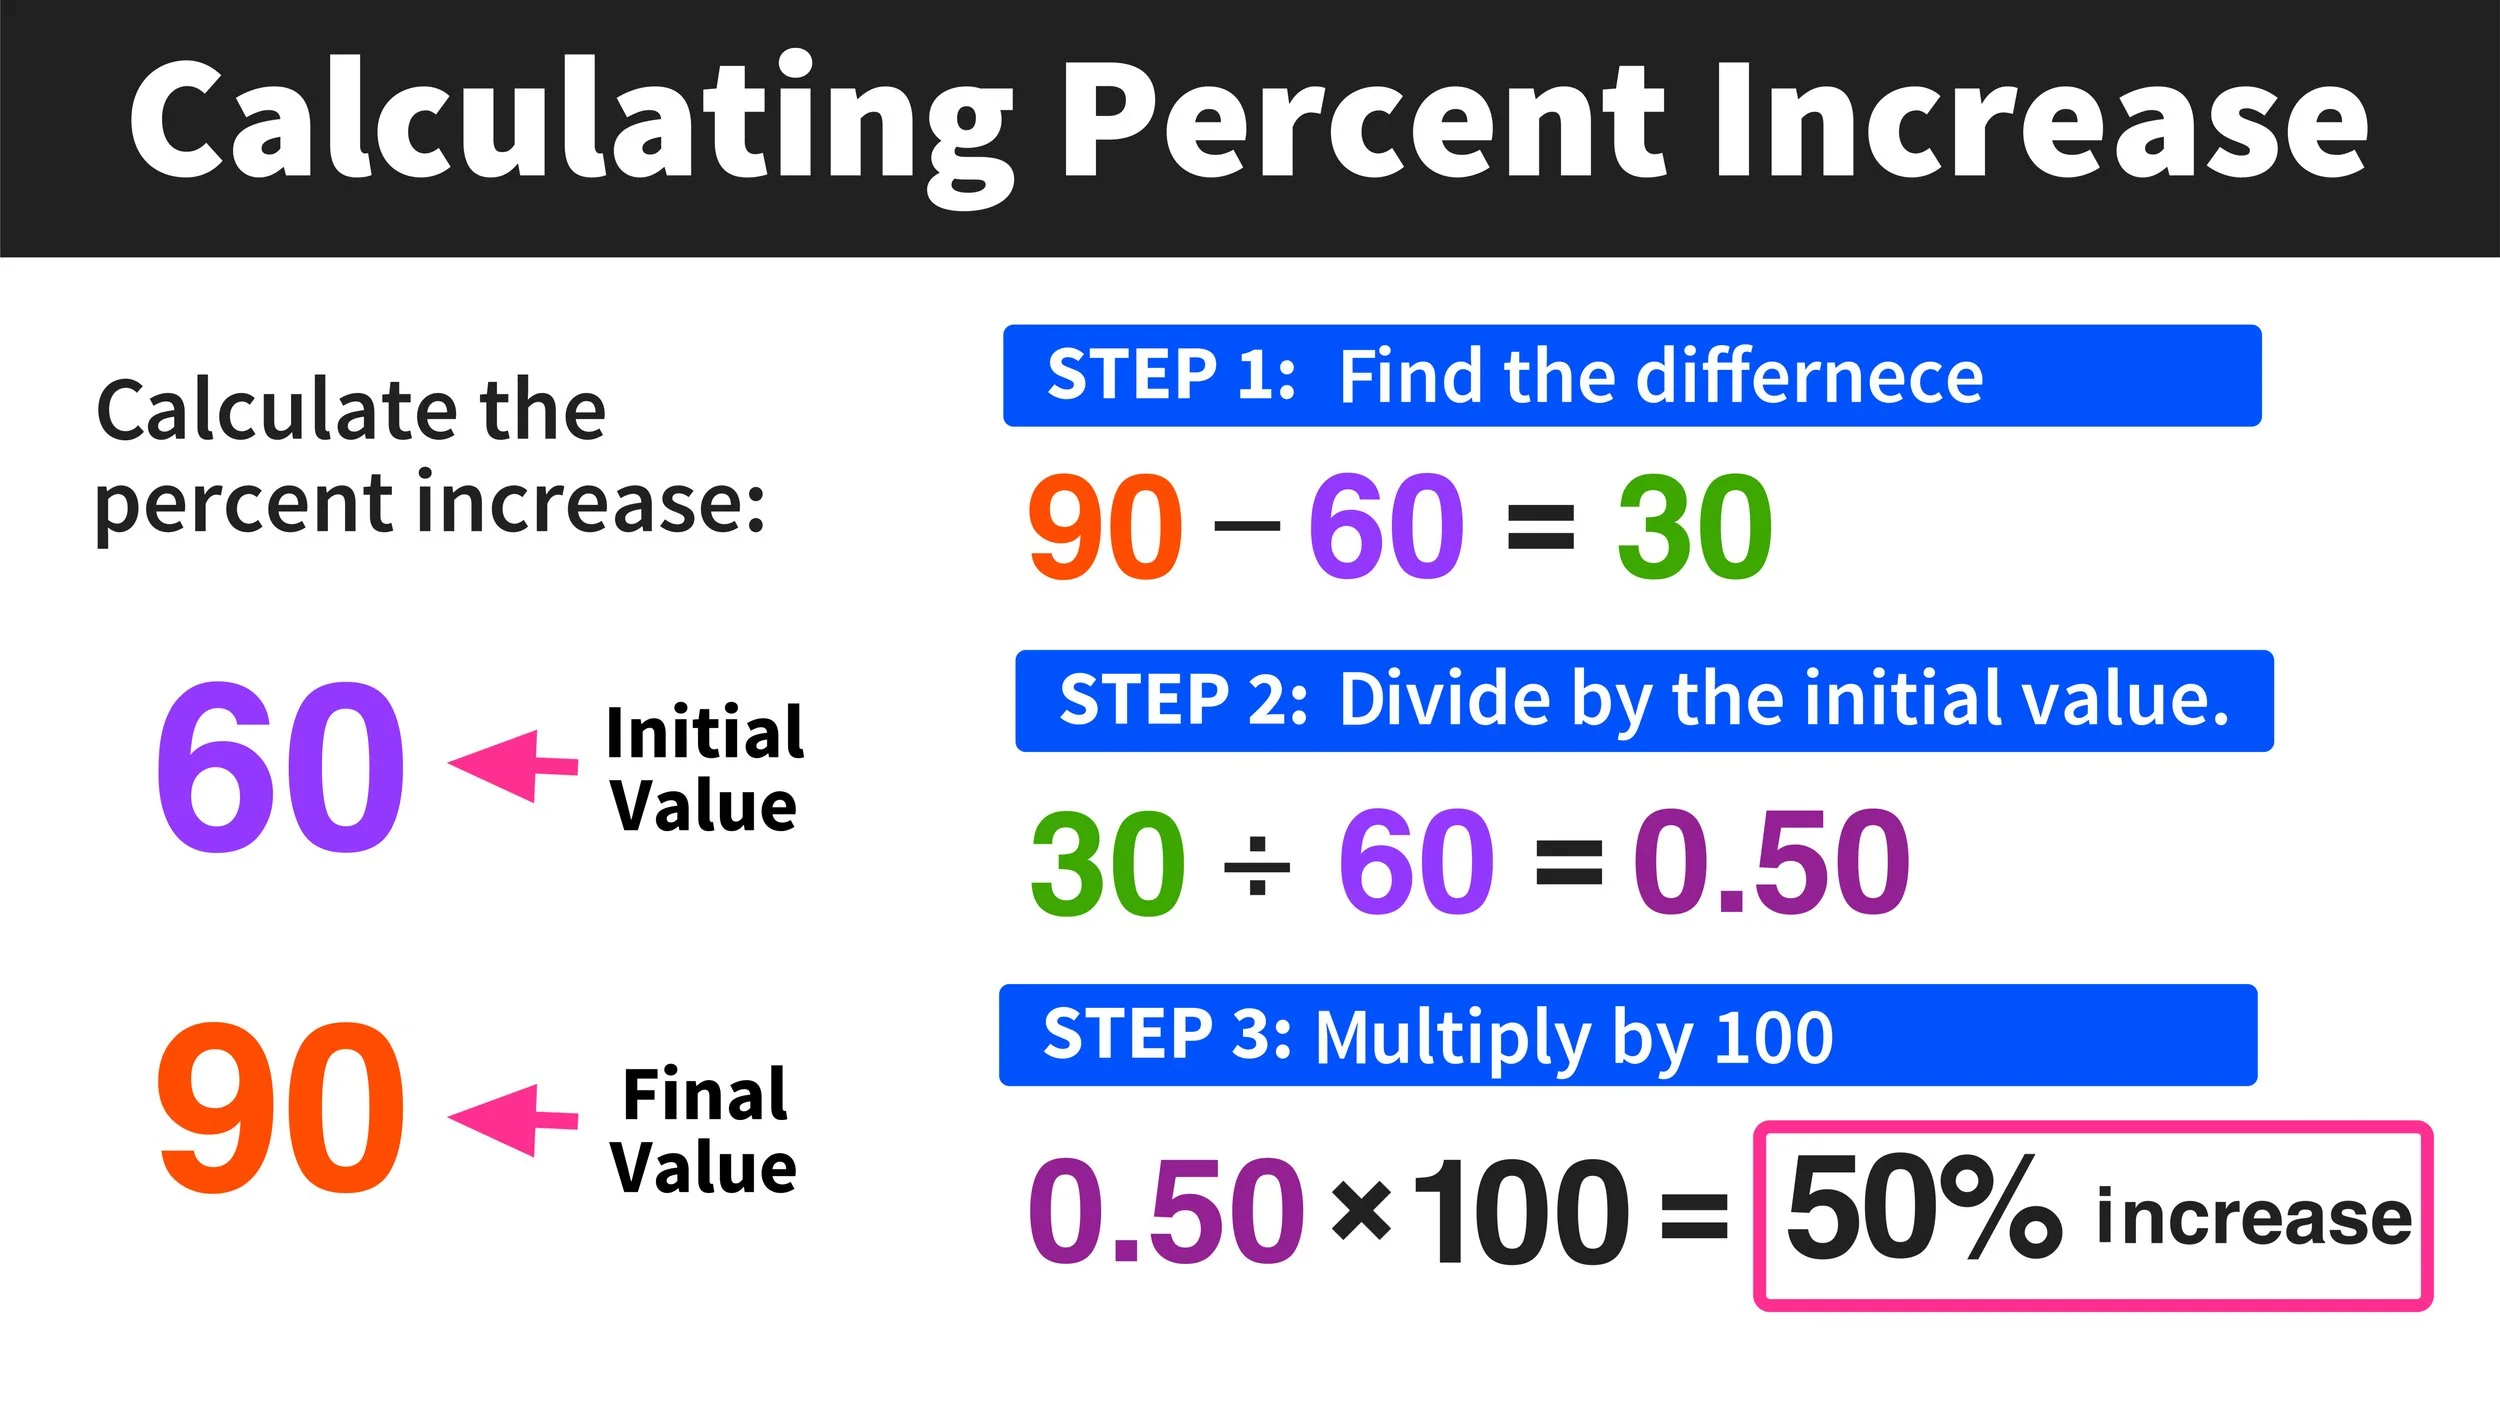
The most straightforward way to calculate a price increase is to determine the percentage change between an old price and a new price. This method yields a clear, universally understood metric.
The formula is:
$$ text{Percentage Increase} = left( frac{text{New Price} – text{Old Price}}{text{Old Price}} right) times 100 $$
Example Application:
Imagine a gallon of milk that cost $3.50 last year now costs $4.00.
-
Old Price = $3.50
-
New Price = $4.00
-
Find the absolute increase: $4.00 – $3.50 = $0.50
-
Divide the increase by the old price: $0.50 / $3.50 ≈ 0.142857
-
Multiply by 100 to get the percentage: 0.142857 * 100 ≈ 14.29%
So, the price of milk increased by approximately 14.29%.
Calculating Cumulative Price Increases
Sometimes, you need to understand how prices have increased over multiple periods, such as year-over-year, or when an item has undergone several successive price hikes. This involves understanding the compounding effect.
If you have a series of percentage increases over different periods (e.g., year 1, year 2, year 3), you cannot simply add the percentages together. You must account for the compounding nature of the increases.
The formula for cumulative percentage increase, given individual growth rates (r1, r2, r3, …), is:
$$ text{Cumulative Increase} = ((1 + r1) times (1 + r2) times dots times (1 + rn)) – 1 $$
Where ‘r’ is the decimal form of the percentage increase (e.g., 5% becomes 0.05).
Example Application:
A product increased in price by 5% in year 1, then by 7% in year 2, and by 3% in year 3.
-
r1 = 0.05
-
r2 = 0.07
-
r3 = 0.03
-
Calculate the cumulative growth factor:
$(1 + 0.05) times (1 + 0.07) times (1 + 0.03)$
$= 1.05 times 1.07 times 1.03$
$approx 1.1578$
-
Subtract 1 to find the decimal cumulative increase: $1.1578 – 1 = 0.1578$
-
Multiply by 100 for the percentage: $0.1578 times 100 = 15.78%$

The cumulative price increase over the three years is approximately 15.78%. If you had simply added the percentages (5% + 7% + 3% = 15%), you would have underestimated the true increase due to compounding.
Using Price Indexes for Broader Calculations
For a broader understanding of price increases across an economy, industry, or specific category of goods, economists and financial analysts use price indexes. The most common is the Consumer Price Index (CPI), which measures the average change over time in the prices paid by urban consumers for a market basket of consumer goods and services. Another is the Producer Price Index (PPI), which measures the average change over time in the selling prices received by domestic producers for their output.
To use a price index to calculate how much a past price would be equivalent to today (or vice versa), you can use the following formula:
$$ text{Current Price Equivalent} = text{Old Price} times left( frac{text{Current Index Value}}{text{Old Index Value}} right) $$
Example Application:
Suppose a house cost $150,000 in 1995 when the CPI was 152.4. You want to know its equivalent price in 2023, when the CPI is 304.5.
-
Old Price = $150,000
-
Old Index Value (1995 CPI) = 152.4
-
Current Index Value (2023 CPI) = 304.5
$$ text{Current Price Equivalent} = $150,000 times left( frac{304.5}{152.4} right) $$
$$ text{Current Price Equivalent} = $150,000 times 1.99868 approx $299,802 $$
This means that $150,000 in 1995 had the same purchasing power as approximately $299,802 in 2023. This calculation helps in understanding real growth versus nominal growth and the impact of inflation over long periods.
Practical Applications and Strategic Considerations
Calculating price increases isn’t just an academic exercise; it has vital implications across various financial domains.
For Businesses
Businesses regularly perform these calculations for strategic pricing, cost management, and financial forecasting.
-
Cost-Plus Pricing Adjustments: If the cost of producing a good increases, businesses need to calculate the new price required to maintain their desired profit margin.
-
Market-Driven Price Adjustments: Monitoring competitor pricing and overall market inflation helps businesses adjust their prices to remain competitive yet profitable.
-
Impact on Profit Margins: Understanding how price increases (or decreases) in raw materials or labor affect their current profit margins is crucial for financial health.
-
Communicating Price Increases: When price increases are necessary, clear and justifiable communication to customers can help retain loyalty and minimize backlash. Businesses must demonstrate value or explain the necessity transparently.
For Consumers
Consumers benefit from these calculations to manage personal finances and make informed purchasing decisions.
-
Understanding Impact on Personal Budgets: Tracking price increases for essential goods (groceries, utilities, fuel) helps individuals adjust their budgets and identify areas for potential savings.
-
Tracking Cost of Living Increases: Understanding how much prices for a basket of goods and services have risen in their area or across the country (often reflected by CPI) gives insight into their real purchasing power.
-
Comparing Prices Over Time: When making large purchases or evaluating subscription services, comparing current prices to past prices helps assess value and identify genuine deals versus perceived ones.
Financial Planning and Investing
Investors and financial planners rely on these calculations to accurately project future financial needs and evaluate investment performance.
-
Adjusting Investment Returns for Inflation: Nominal investment returns might look impressive, but adjusting them for inflation using price index calculations reveals the “real” return, which is the true increase in purchasing power.
-
Forecasting Future Expenses: For long-term financial goals like retirement or education planning, accurately forecasting future expenses requires factoring in expected price increases due to inflation. This ensures that savings targets are realistic.
-
Impact on Retirement Savings: Underestimating the impact of inflation on future costs can lead to insufficient retirement savings. Understanding cumulative price increases helps retirees ensure their nest egg maintains its value over decades.
Tools and Resources for Price Calculation
While the formulas are straightforward, practical application often benefits from readily available tools and data sources.
Spreadsheets and Software
For ongoing tracking or complex calculations involving multiple items and periods, spreadsheet software like Microsoft Excel or Google Sheets is invaluable.
-
Excel/Google Sheets: You can set up formulas to automatically calculate percentage increases, cumulative changes, and even integrate price index data if manually entered or imported. This allows for dynamic models that update as new data becomes available.
-
Accounting Software: Many business accounting platforms have built-in features to track costs and revenue, which can be leveraged to analyze price changes and their impact on profitability.
Online Calculators
For quick, one-off calculations, numerous online calculators can simplify the process.
-
Inflation Calculators: Websites like the Bureau of Labor Statistics (BLS) provide CPI inflation calculators that can quickly tell you the equivalent purchasing power of money between two different years.
-
Percentage Change Calculators: Generic math websites offer simple tools for calculating percentage increases or decreases.

Economic Data Sources
Access to reliable historical price and index data is crucial for accurate analysis.
-
Government Agencies: In the United States, the Bureau of Labor Statistics (BLS) is the primary source for CPI, PPI, and other vital economic data. Similar agencies exist in other countries.
-
Financial News Outlets and Databases: Major financial news services (e.g., Bloomberg, Reuters, Wall Street Journal) and economic databases often compile and present this data in an accessible format.
By understanding these calculation methods and leveraging available tools, individuals and businesses can gain a robust understanding of how price increases impact their financial landscape, enabling smarter decisions and more effective planning.
aViewFromTheCave is a participant in the Amazon Services LLC Associates Program, an affiliate advertising program designed to provide a means for sites to earn advertising fees by advertising and linking to Amazon.com. Amazon, the Amazon logo, AmazonSupply, and the AmazonSupply logo are trademarks of Amazon.com, Inc. or its affiliates. As an Amazon Associate we earn affiliate commissions from qualifying purchases.