
Understanding how to calculate percentage increase and decrease is a foundational skill in personal and business finance. It provides a standardized way to compare data points over time, assess performance, and make informed decisions, whether you’re evaluating investment returns, analyzing budget variances, or tracking business growth. This numerical insight transforms raw data into meaningful metrics, revealing trends and highlighting areas for attention.
The Core Formulas: Unlocking Financial Changes
At its heart, calculating a percentage change involves comparing an old value to a new value. The result indicates the relative magnitude of the change, expressed as a proportion of the original amount.
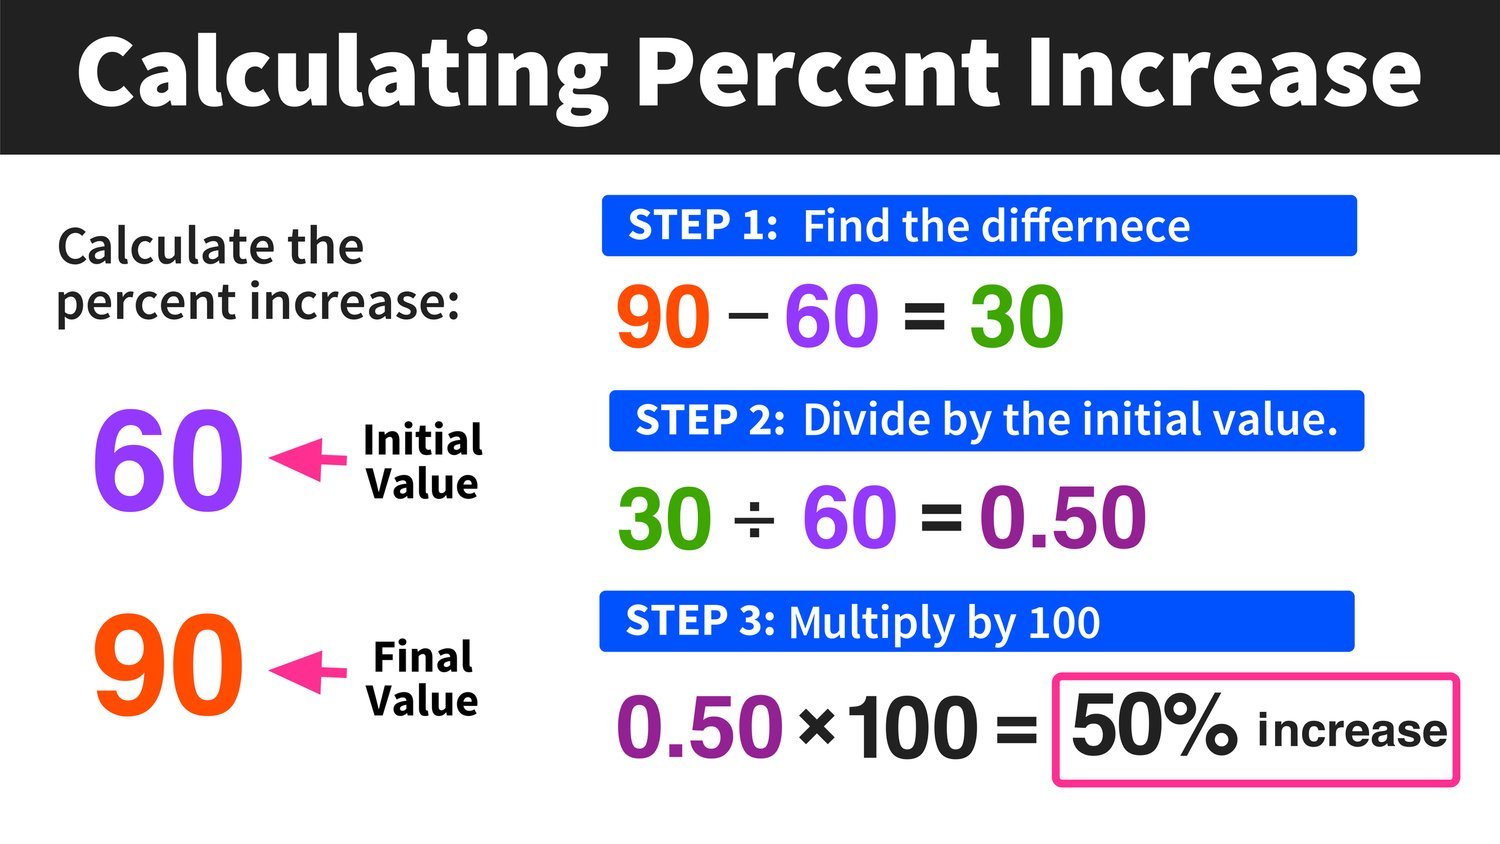
Percentage Increase Formula
When a value grows over time, we calculate a percentage increase. This is particularly useful for tracking investment gains, revenue growth, or the appreciation of assets.
The formula for percentage increase is:
$$ text{Percentage Increase} = left( frac{text{New Value} – text{Old Value}}{text{Old Value}} right) times 100% $$
Let’s break down the components:
-
New Value: The current or later data point.
-
Old Value: The initial or earlier data point.
-
$(text{New Value} – text{Old Value})$: This calculates the absolute increase.
-
Divide by Old Value: This step normalizes the absolute increase by expressing it as a fraction of the starting point.
-
Multiply by 100%: Converts the decimal fraction into a percentage.
Example: Investment Growth
Imagine you invested $1,000 in a stock, and a year later, its value rose to $1,250.
-
Old Value = $1,000
-
New Value = $1,250
-
Absolute Increase = $1,250 – $1,000 = $250
-
Percentage Increase = $($250 / $1,000) times 100% = 0.25 times 100% = 25%$
This means your investment grew by 25%.
Percentage Decrease Formula
Conversely, when a value shrinks, we calculate a percentage decrease. This is vital for monitoring cost reductions, asset depreciation, or declines in sales.
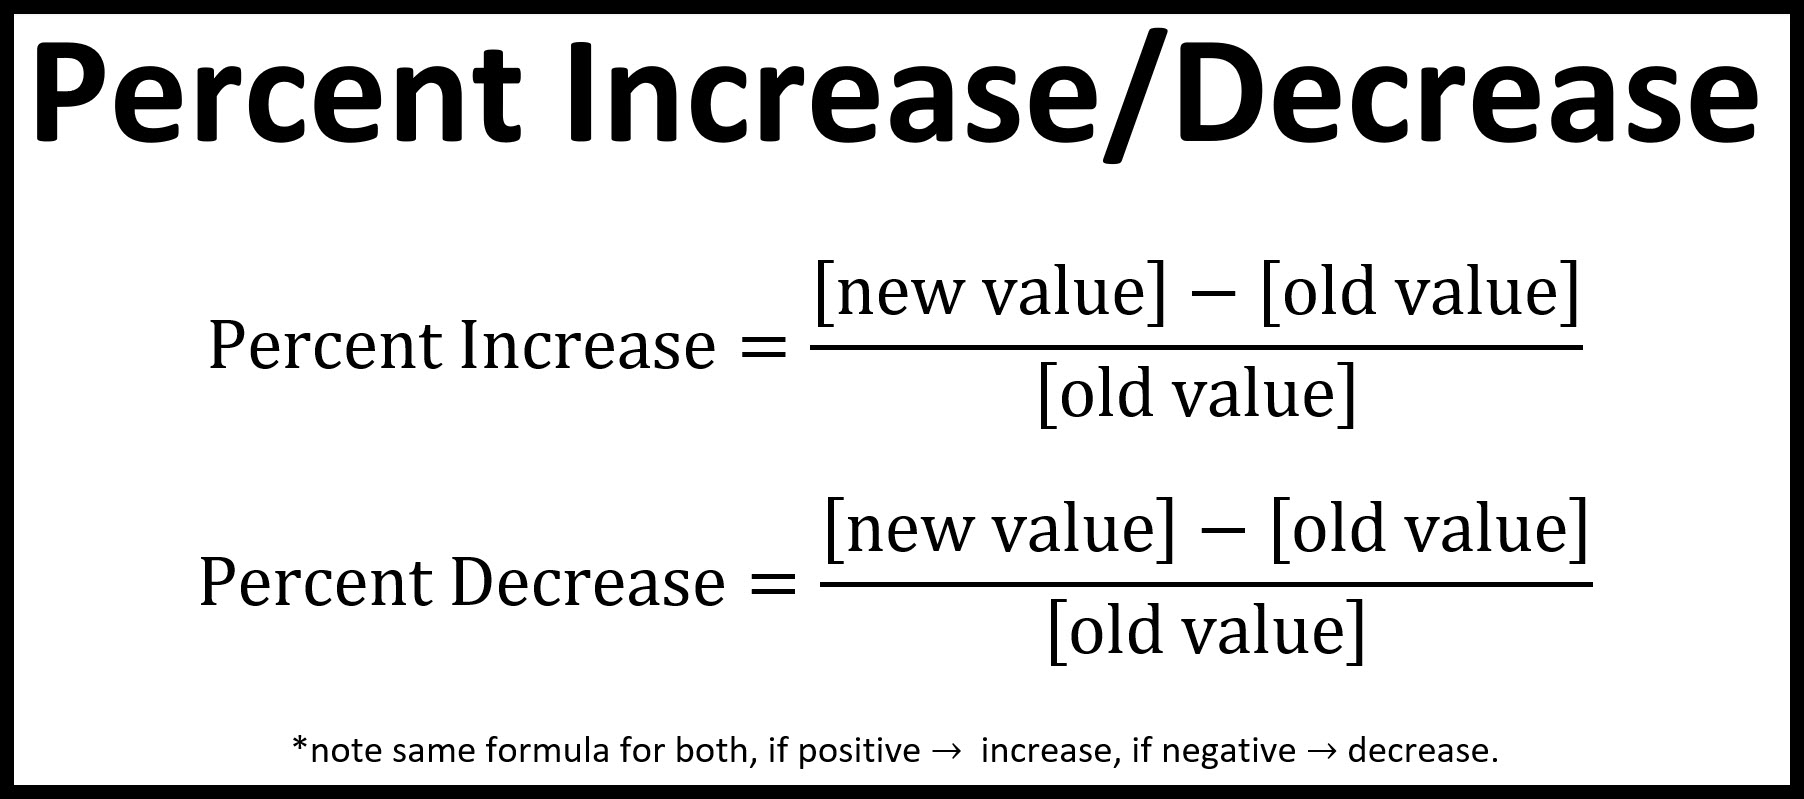
The formula for percentage decrease is:
$$ text{Percentage Decrease} = left( frac{text{Old Value} – text{New Value}}{text{Old Value}} right) times 100% $$
Key elements:
-
Old Value: The initial or earlier data point.
-
New Value: The current or later data point (which is smaller than the Old Value).
-
$(text{Old Value} – text{New Value})$: This calculates the absolute decrease.
-
Divide by Old Value: Normalizes the absolute decrease against the original amount.
-
Multiply by 100%: Converts the decimal fraction into a percentage.
Example: Cost Reduction
Suppose a business managed to reduce its monthly operational costs from $5,000 to $4,500.
-
Old Value = $5,000
-
New Value = $4,500
-
Absolute Decrease = $5,000 – $4,500 = $500
-
Percentage Decrease = $($500 / $5,000) times 100% = 0.10 times 100% = 10%$
The business achieved a 10% reduction in operational costs.
Differentiating Net Change from Percentage Change
It’s crucial to distinguish between a simple net change (absolute difference) and a percentage change. While a net change tells you the raw dollar amount increase or decrease, a percentage change provides context by relating that change back to the original value. A $100 increase might be insignificant for a $1,000,000 portfolio (0.01%), but incredibly significant for a $500 budget (20%). Percentage change offers a standardized, comparable metric regardless of the absolute scale of the values involved.
Applying Percentage Change in Personal Finance
For individuals, percentage calculations are indispensable tools for managing money effectively, tracking progress toward financial goals, and evaluating investment decisions.
Tracking Investment Portfolio Performance

One of the most common applications is assessing how well your investments are performing.
-
Stock Gains/Losses: If you buy a stock for $50 per share and it rises to $65, that’s a (($65 – $50) / $50) * 100% = 30% increase. If it drops to $40, it’s a (($50 – $40) / $50) * 100% = 20% decrease. These percentages allow for direct comparison between different investments, irrespective of their initial price.
-
Mutual Funds and ETFs: Fund performance is almost always reported as percentage returns over various periods (e.g., 1-year, 5-year, 10-year). This enables investors to compare the efficiency and growth potential of different funds.
-
Real Estate Appreciation/Depreciation: The value of a home or investment property can fluctuate. Knowing the percentage change helps homeowners understand equity growth or investors gauge returns.
Budgeting and Expense Analysis
Monitoring your spending and savings habits benefits greatly from percentage analysis.
-
Month-over-Month Spending: If your grocery bill jumped from $400 in May to $480 in June, that’s a (($480 – $400) / $400) * 100% = 20% increase. This significant percentage can prompt an investigation into why spending increased.
-
Tracking Savings Rate: Many financial advisors recommend saving a certain percentage of your income. Calculating your personal savings rate (Savings / Net Income * 100%) and monitoring its percentage increase or decrease over time helps you stay on track towards retirement or other financial goals.
-
Debt Reduction Progress: If you’re paying down a loan, calculating the percentage decrease in your outstanding balance provides a tangible measure of progress and motivation.
Evaluating Inflation’s Impact
Inflation, the rate at which the general level of prices for goods and services is rising, is often expressed as a percentage. Understanding this allows you to assess the real purchasing power of your money and investments. If your investments return 5% but inflation is 3%, your real return is only 2%.
Leveraging Percentage Change in Business Finance
For businesses, percentage changes are critical for performance management, strategic planning, and stakeholder reporting. They offer a standardized language to communicate financial health and operational efficiency.
Revenue Growth and Sales Performance
Businesses constantly monitor revenue growth to gauge market penetration and overall success.
-
Quarterly/Annual Revenue Growth: Comparing current period revenue to previous period revenue is fundamental. A 15% year-over-year revenue increase signals healthy expansion, while a percentage decrease might indicate market challenges or operational issues.
-
Sales Conversion Rates: If 100 leads result in 10 sales, that’s a 10% conversion rate. Tracking the percentage increase or decrease in this rate helps optimize sales processes and marketing efforts.
-
Average Transaction Value: Understanding the percentage change in the average amount customers spend per transaction can highlight opportunities for upselling or cross-selling strategies.
Profit Margin Analysis
Profitability is paramount, and percentage margins provide clear insights into a company’s efficiency.
-
Gross Profit Margin: (Gross Profit / Revenue) * 100%. A percentage increase indicates better cost of goods sold management or improved pricing strategies.
-
Net Profit Margin: (Net Income / Revenue) * 100%. This is the ultimate measure of profitability. Tracking its percentage change reveals the effectiveness of overall cost control and revenue generation.
-
Operating Margin: (Operating Income / Revenue) * 100%. This shows how much profit a company makes from its core operations. Monitoring its percentage fluctuations helps assess operational efficiency.
Cost Management and Efficiency
Reducing costs without sacrificing quality is a constant business objective.
-
Operational Cost Reduction: A 10% decrease in utility costs or a 5% reduction in administrative expenses directly impacts the bottom line. These percentage figures are easier to communicate and benchmark than raw dollar amounts.
-
Supplier Price Changes: When negotiating with suppliers, understanding the percentage increase or decrease in raw material costs is crucial for managing production expenses and pricing strategies.
-
Employee Productivity: While often complex, metrics like revenue per employee or profit per employee can be tracked as percentage changes to assess productivity shifts.
Market Share Growth
For publicly traded companies, market share is a key indicator of competitive strength. Measuring the percentage increase in a company’s share of its total market helps assess its strategic position and growth trajectory relative to competitors.
Best Practices and Common Pitfalls
While the formulas are straightforward, applying them effectively in financial contexts requires attention to detail and an understanding of underlying principles.
The Importance of the Base Value (Denominator)
Always ensure you are dividing by the correct “Old Value” or “original value.” This is the starting point from which the change is being measured. Using the wrong denominator will lead to inaccurate and misleading percentages. For example, if a stock drops 50% from $100 to $50, and then increases 50% from $50, it only reaches $75, not $100. The percentage change is always relative to the current base.
Avoiding Misleading Comparisons
Percentage changes can be powerful, but they can also be deceptive if not presented with full context.
-
Small Base Values: A large percentage change from a very small base number might not be as significant as it appears. For instance, a 100% increase from $1 to $2 is less impactful than a 10% increase from $1,000,000 to $1,100,000.
-
Different Time Periods: Comparing a 10% monthly increase to a 5% annual increase is like comparing apples to oranges. Always ensure consistent timeframes for comparison, or annualize figures where appropriate.
-
Compound vs. Simple Growth: When dealing with multiple periods, simple percentage changes for each period don’t account for compounding effects. For investments, annualized returns often provide a more accurate picture of long-term growth.
Utilizing Financial Tools for Accuracy
While manual calculations are valuable for understanding the concepts, leveraging technology is essential for efficiency and accuracy, especially with complex datasets.
-
Spreadsheets (Excel, Google Sheets): These are invaluable for financial analysis. Formulas like
=(New Value - Old Value) / Old Value(then format as percentage) can be quickly applied across large datasets. Conditional formatting can visually highlight significant percentage increases or decreases. -
Financial Software: Investment tracking platforms, accounting software, and budgeting apps often automate these calculations, presenting data in intuitive dashboards that show percentage changes for various financial metrics.
Mastering percentage increase and decrease calculations empowers individuals and businesses alike to gain deeper insights into their financial data. From tracking personal savings growth to analyzing complex business profitability, these fundamental calculations serve as the bedrock for sound financial decision-making, helping to illuminate trends, measure performance, and guide future strategies.
aViewFromTheCave is a participant in the Amazon Services LLC Associates Program, an affiliate advertising program designed to provide a means for sites to earn advertising fees by advertising and linking to Amazon.com. Amazon, the Amazon logo, AmazonSupply, and the AmazonSupply logo are trademarks of Amazon.com, Inc. or its affiliates. As an Amazon Associate we earn affiliate commissions from qualifying purchases.