In the world of finance, numbers are the language of progress. Whether you are a retail investor tracking the performance of your stock portfolio, a small business owner analyzing quarterly revenue, or an individual trying to optimize a household budget, understanding how to calculate percentage difference is a fundamental skill. It transforms raw data into actionable insights, allowing you to see not just that a number has changed, but the magnitude and significance of that change in relation to your financial goals.
Calculating the percentage difference allows for a standardized comparison between two values. In a vacuum, a $100 increase in profit sounds positive. However, if that $100 increase comes from a base of $10,000, it is a mere 1% growth. If it comes from a base of $200, it is a staggering 50% increase. This article provides a deep dive into the mechanics of these calculations within the “Money” niche, ensuring you have the tools to navigate personal and professional finance with precision.

Understanding the Fundamentals of Percentage Difference in Finance
To master financial literacy, one must first distinguish between various types of percentage calculations. While the terms are often used interchangeably in casual conversation, they serve distinct purposes in professional financial reporting and data analysis.
The Difference Between Percentage Change and Percentage Difference
In financial circles, we most frequently use “Percentage Change.” This measures the degree of change over time—such as the growth of an investment from one year to the next. The formula identifies an “old” value and a “new” value.
“Percentage Difference,” strictly speaking in mathematics, is often used to compare two values where neither is considered the “baseline” or “original” value. For instance, if you are comparing the price of gold in London versus New York at the same moment, you would use the percentage difference. However, in the context of money management and business growth, “percentage difference” is most commonly understood as the variance between two financial data points.
The Standard Mathematical Formula
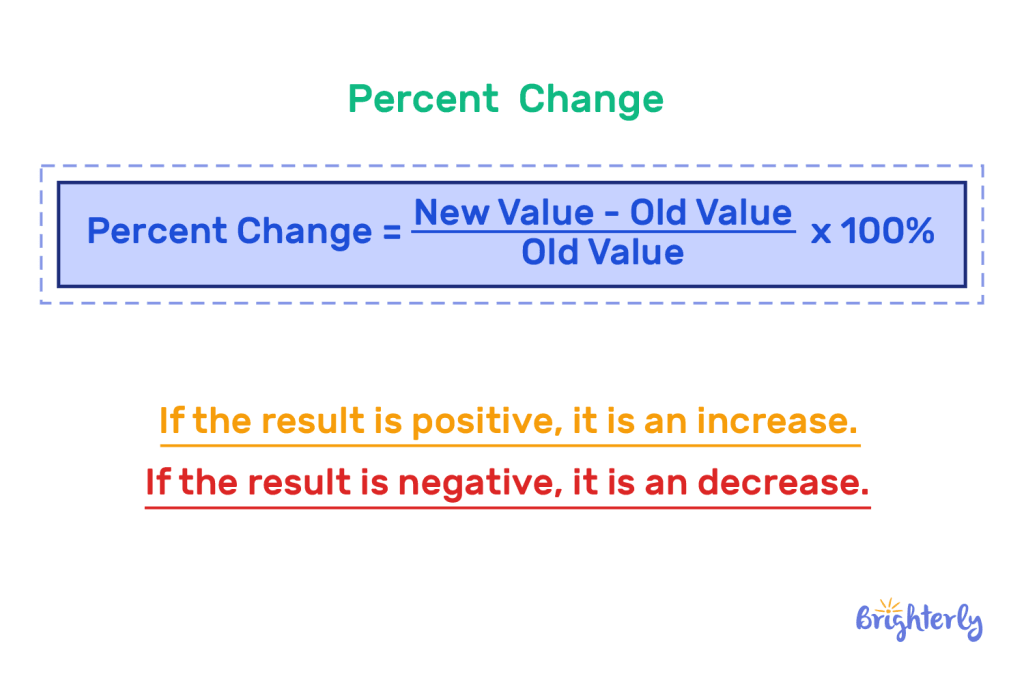
To calculate the percentage change (the most common application of percentage difference in money matters), the formula is:
((New Value – Old Value) / |Old Value|) × 100
- Subtract the original value from the new value to find the absolute change.
- Divide that result by the absolute value of the original number.
- Multiply by 100 to convert the decimal into a percentage.
If the result is positive, it indicates growth or an increase. If negative, it represents a decrease or a loss. Mastering this simple three-step process is the cornerstone of analyzing market trends and personal net worth.
Practical Applications in Personal Finance and Budgeting
For the individual looking to achieve financial independence, the ability to calculate percentage difference is essential for maintaining a lean and efficient budget. It provides a “reality check” on spending habits that raw dollar amounts might hide.
Tracking Month-over-Month Expense Variance
Static budgets often fail because they do not account for the volatility of living expenses. By calculating the percentage difference in your monthly utility bills, grocery spending, or discretionary “fun money,” you can identify “lifestyle creep.”
For example, if your dining-out expenses were $400 in January and rose to $520 in February, the percentage difference is 30%. While a $120 increase might seem manageable in isolation, a 30% jump is a red flag for any budgeter. It signals a shift in behavior that, if left unchecked, could derail long-term savings goals. Monitoring these percentages allows you to pivot quickly, adjusting your habits before the end of the fiscal quarter.
Evaluating Salary Growth and Inflation Adjustments
When negotiating a raise or considering a new job offer, the percentage difference is your most powerful metric. If you receive a 3% raise but the national inflation rate (Consumer Price Index) has risen by 5% over the same period, your “real” income has actually decreased by 2%.
By calculating the percentage difference between your wage increases and the cost of living, you gain a clearer picture of your actual purchasing power. This data-driven approach removes emotion from salary negotiations, allowing you to present a logical case for compensation based on economic benchmarks.
Using Percentage Difference to Optimize Your Investment Portfolio
In the realm of investing, percentage difference is the primary metric for measuring Risk vs. Reward. Investors use it to compare the performance of individual assets against market benchmarks and to rebalance portfolios to maintain a desired risk profile.
Comparing Asset Performance Across Different Sectors
An investor might hold shares in a technology ETF and a real estate investment trust (REIT). To determine which asset is providing the best return on capital, the investor must look at the percentage difference in their valuations over a specific period.
If the tech ETF grew from $150 to $180 (a 20% increase) while the REIT grew from $50 to $58 (a 16% increase), the tech ETF is the clear winner in terms of growth. However, by calculating the percentage difference in their dividend yields as well, the investor might find that the REIT offers a better total return. This dual-layered analysis is critical for sophisticated wealth management.
Measuring Benchmarks and Market Indices
No investment exists in a vacuum. Professional money managers always compare an individual stock’s performance to a benchmark, such as the S&P 500. If your portfolio returned 12% last year, but the S&P 500 returned 18%, the percentage difference reveals that your “Alpha”—the excess return of an investment relative to the return of a benchmark index—is negative. Understanding this gap helps investors decide whether they are better off switching to passive index funds rather than attempting to pick individual stocks.
Advanced Business Finance: Analyzing Growth and Profitability
For entrepreneurs and corporate executives, percentage difference is the pulse of the company. It is used in every board meeting to justify expenditures and celebrate successes.
Year-over-Year (YoY) Revenue Analysis
The “Year-over-Year” (YoY) calculation is perhaps the most vital use of percentage difference in business. It compares a financial metric for one period against the same period in the previous year. This accounts for seasonality—for instance, comparing December retail sales to the previous December rather than November.
If a company generated $2 million in Q3 2023 and $2.5 million in Q3 2024, the YoY growth is 25%. Investors and lenders look for consistent positive percentage differences in YoY revenue as a sign of a healthy, scaling business. Conversely, a shrinking percentage indicates market saturation or a loss of competitive advantage.
Cost-Benefit Analysis and Margin Fluctuations
Profitability isn’t just about revenue; it’s about what you keep. Calculating the percentage difference in “Cost of Goods Sold” (COGS) can reveal inefficiencies in the supply chain. If your revenue increased by 10% but your expenses increased by 15%, your profit margins are being squeezed. By applying the percentage difference formula to various line items on a P&L (Profit and Loss) statement, business owners can pinpoint exactly where money is leaking and take corrective action to protect their bottom line.
Leveraging Digital Financial Tools for Precision
While understanding the manual formula is necessary for conceptual clarity, modern financial management relies on speed and automation. Utilizing digital tools ensures that your calculations are error-free and updated in real-time.
Automating Calculations in Excel and Google Sheets
Spreadsheets are the backbone of financial analysis. To calculate the percentage difference between a value in cell A2 and a new value in cell B2, you would use the following formula:
=(B2-A2)/ABS(A2)
By dragging this formula down a column of data, you can instantly see the variance across hundreds of data points. Formatting the cell as a “Percentage” in the toolbar handles the “multiply by 100” step automatically. This is invaluable for tracking stock portfolios or managing complex business inventories.
Using Financial Calculators for Rapid Decision Making
In high-stakes environments—like a real estate auction or a fast-moving stock market—you may not have time to build a spreadsheet. Many financial calculators and mobile apps feature a “Δ%” (Delta Percent) key. This function is designed specifically to find the percentage difference between two numbers quickly.
Using these tools allows you to make “pro-rata” decisions on the fly. Whether you are calculating the “Cap Rate” difference between two properties or determining the “yield to maturity” on a bond, digital tools empower you to act with the confidence of a seasoned financial analyst.

Conclusion
The ability to calculate percentage difference is more than just a math trick; it is a vital lens through which we view our financial reality. It strips away the obfuscation of large numbers and provides a clear, proportional view of growth, loss, and stability.
By applying these principles to your personal budget, your investment strategy, and your business operations, you move from a reactive state of “checking the balance” to a proactive state of “analyzing the trend.” In the pursuit of wealth and financial security, the most important number isn’t always the one at the bottom of the page—it is the percentage of change that tells you where you are going next.
aViewFromTheCave is a participant in the Amazon Services LLC Associates Program, an affiliate advertising program designed to provide a means for sites to earn advertising fees by advertising and linking to Amazon.com. Amazon, the Amazon logo, AmazonSupply, and the AmazonSupply logo are trademarks of Amazon.com, Inc. or its affiliates. As an Amazon Associate we earn affiliate commissions from qualifying purchases.