
In a world driven by data, understanding how quantities change is paramount, especially when it comes to financial health. Whether you’re a savvy investor tracking stock performance, a small business owner monitoring sales figures, or an individual managing a personal budget, the ability to calculate percentage decrease is an indispensable skill. It allows us to not just see that a number has gone down, but to quantify the magnitude of that decline relative to its original value, providing crucial context for decision-making.
This article will demystify the process of calculating percentage decrease. We’ll explore its formula, walk through practical examples, delve into its diverse applications across personal and business finance, and discuss common pitfalls to ensure your financial analyses are both accurate and insightful.
The Cornerstone of Financial Analysis: Understanding Percentage Decrease
At its core, percentage decrease is a mathematical concept used to express the relative change between an initial value and a subsequent, smaller value. It tells us by what percentage an original quantity has diminished. In finance, this isn’t just an academic exercise; it’s a vital metric that illuminates trends, highlights areas of concern, and helps in forecasting future outcomes.
What Exactly is Percentage Decrease?
Imagine your investment portfolio shrank from $10,000 to $8,000. The absolute decrease is $2,000. While this number is informative, it doesn’t tell you the proportional impact. Was it a small dent or a significant setback? This is where percentage decrease steps in. It quantifies the $2,000 drop as a percentage of the original $10,000, revealing the true scale of the change. Without this context, comparing a $2,000 loss on a $10,000 portfolio to a $2,000 loss on a $1,000,000 portfolio would be misleading.
Why This Metric Matters in the World of Money
The relevance of percentage decrease permeates nearly every facet of financial management. For individuals, it helps in understanding the erosion of savings, the decrease in a property’s value, or the reduction in a monthly expense. For businesses, it’s critical for evaluating declining revenues, increased cost efficiencies, inventory shrinkage, or a dip in market share. Investors use it to assess drawdowns in asset values or the impact of market corrections.
Beyond mere observation, understanding percentage decrease empowers proactive decision-making. A significant percentage decrease in sales might trigger a review of marketing strategies, while a decrease in raw material costs could lead to improved profit margins. Conversely, a percentage decrease in a personal savings rate might signal the need for a budget reevaluation. It transforms raw numbers into actionable insights, providing a clearer picture of financial performance and potential risks.
Mastering the Formula: Step-by-Step Calculation
Calculating percentage decrease is a straightforward process once you understand the underlying formula and apply it systematically. It requires two numbers: an original (larger) value and a new (smaller) value.
The Universal Formula for Percentage Decrease
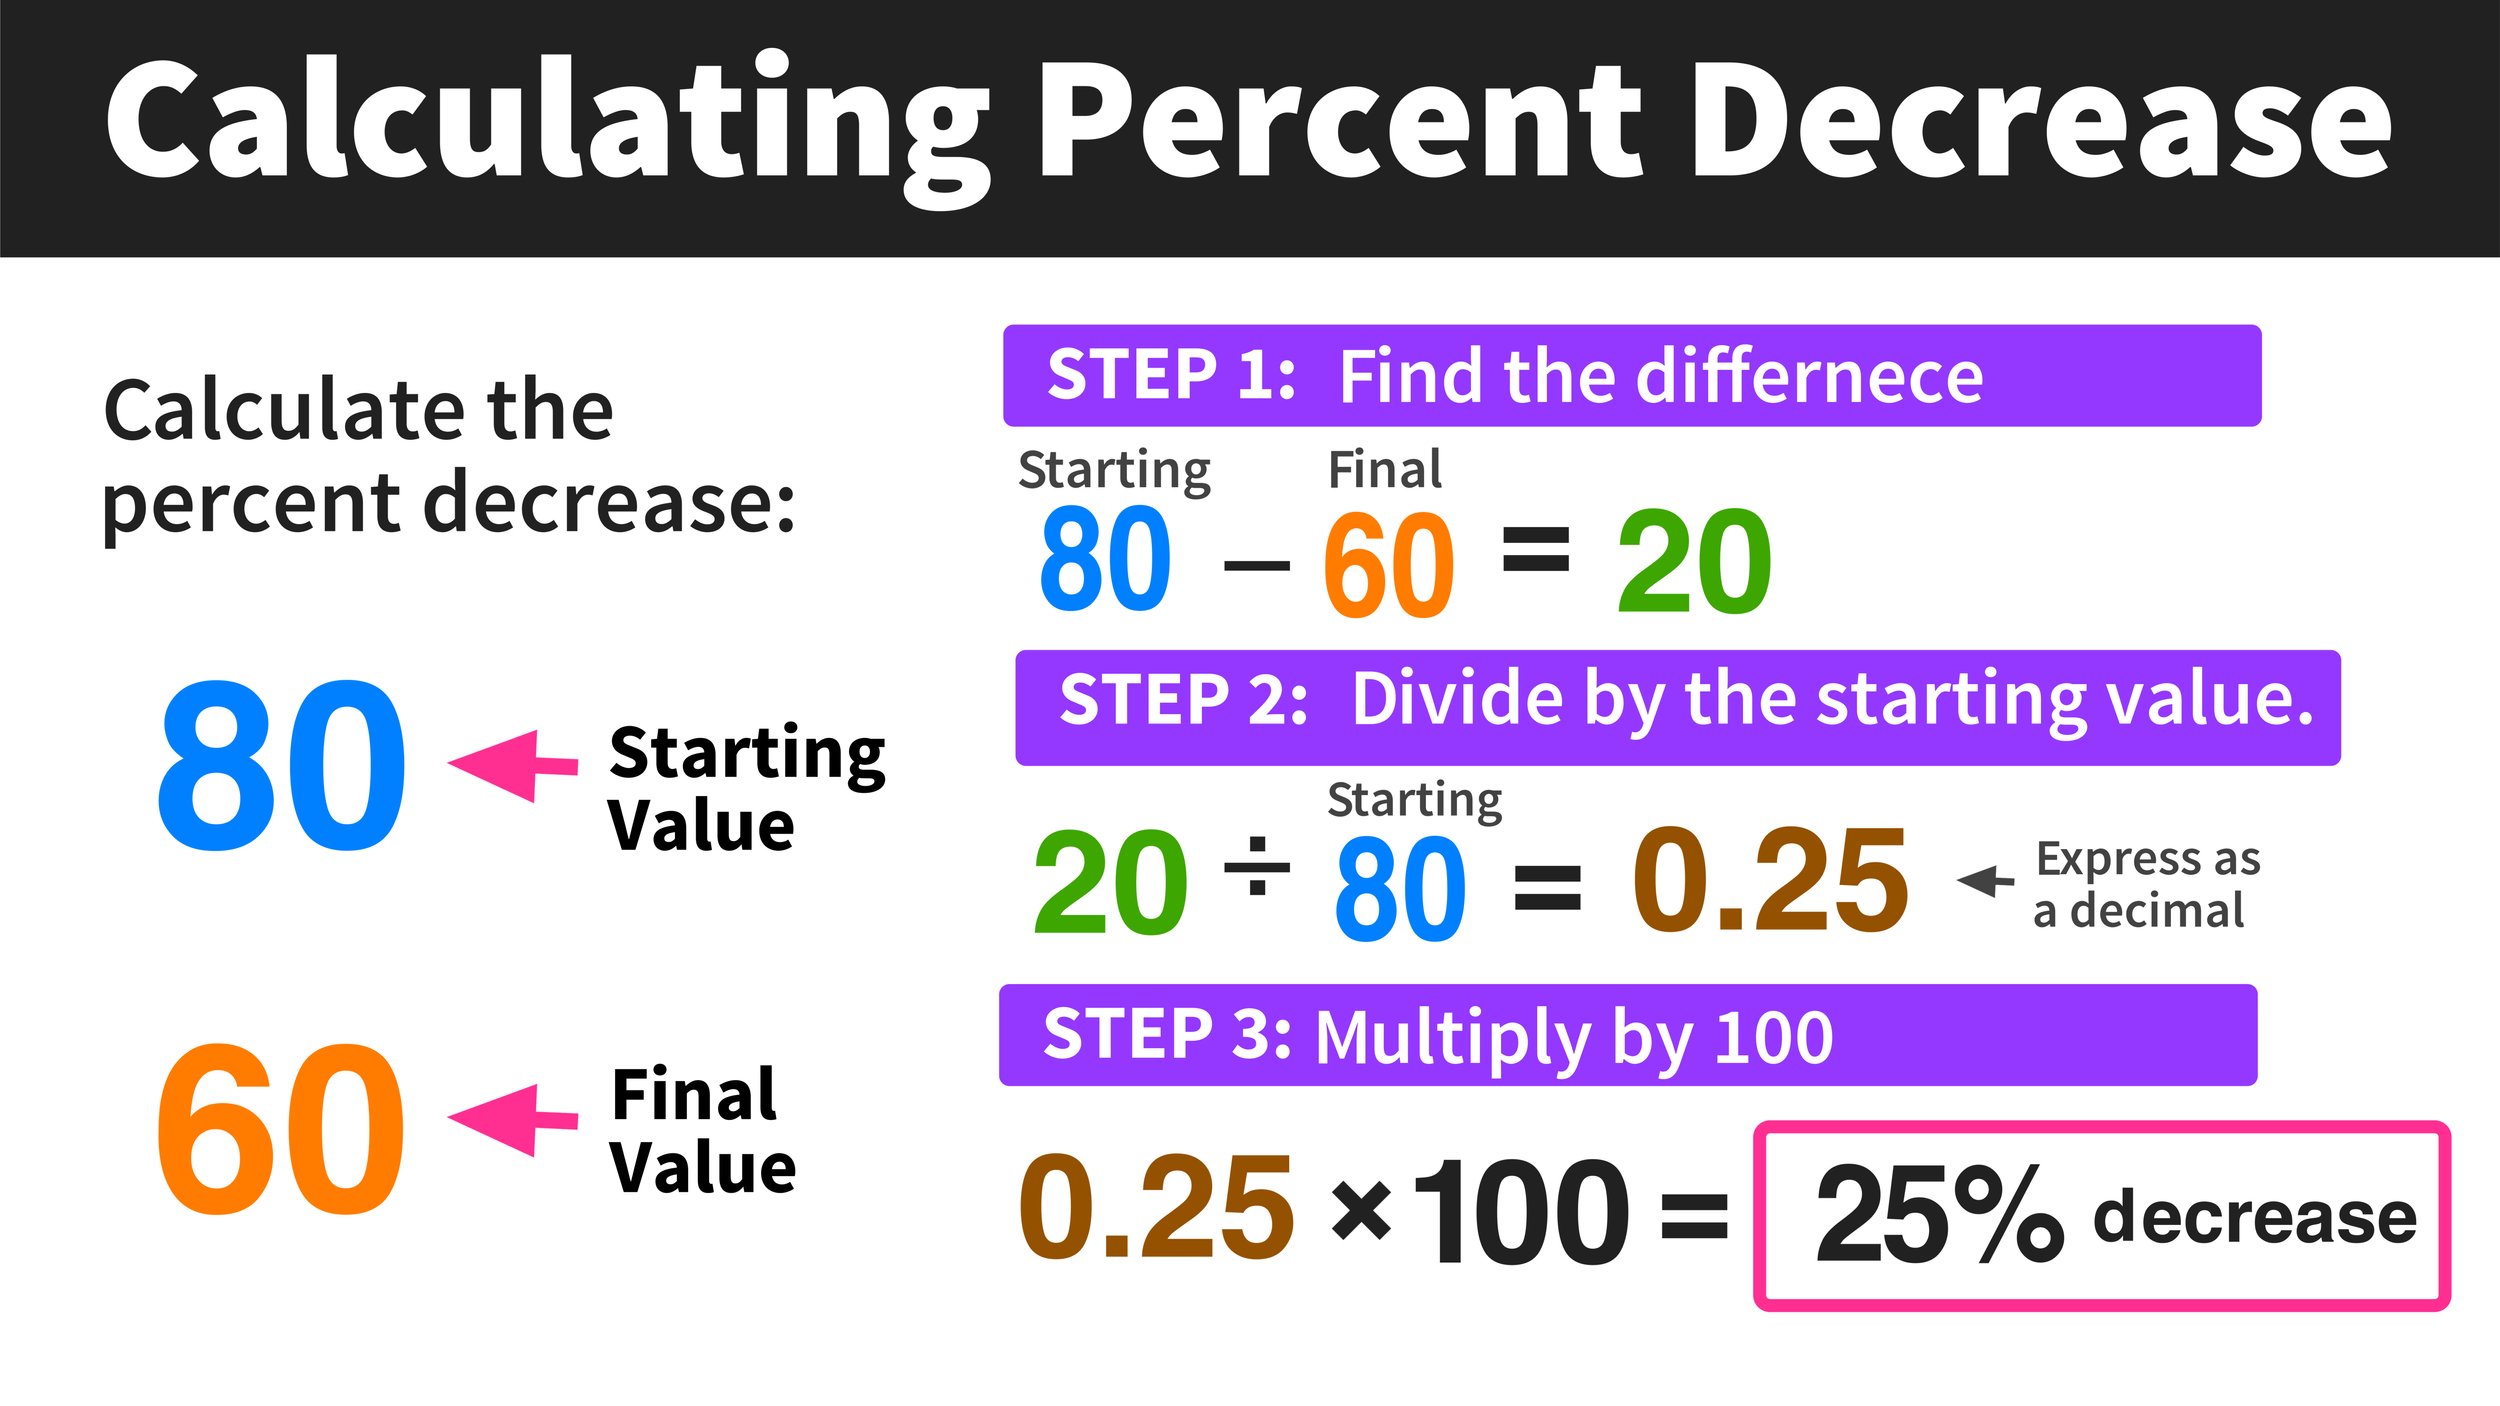
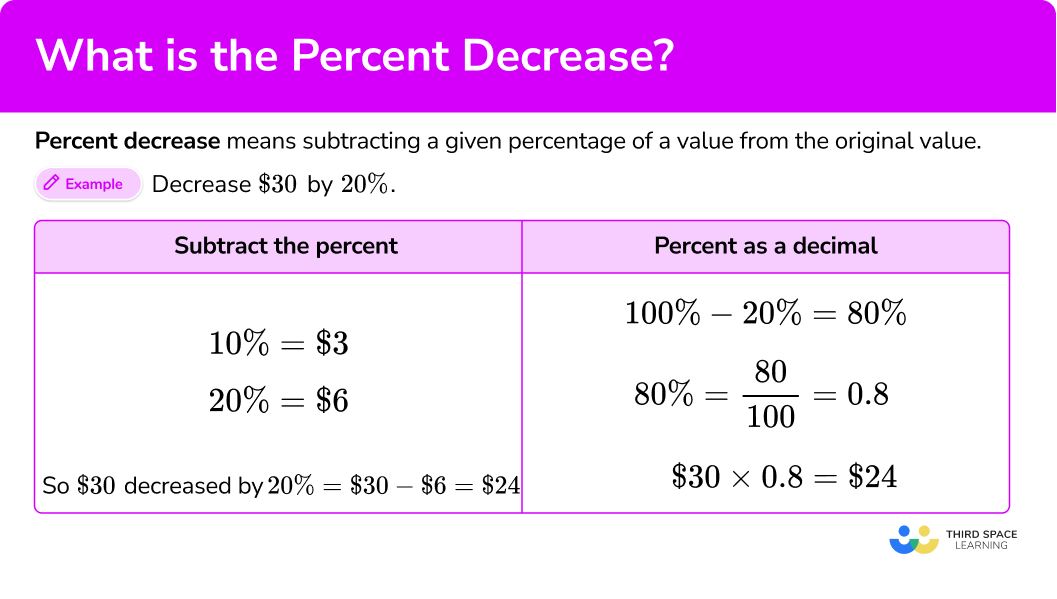
The formula for percentage decrease is as follows:
$$ text{Percentage Decrease} = frac{(text{Original Value} – text{New Value})}{text{Original Value}} times 100 $$
Let’s break down each component:
- Original Value: This is the starting point, the initial amount before the decrease occurred.
- New Value: This is the ending point, the amount after the decrease has taken place.
- ($text{Original Value} – text{New Value}$): This part calculates the absolute amount of the decrease.
- Divide by $text{Original Value}$: This step converts the absolute decrease into a decimal representing the proportion of the decrease relative to the starting point.
- Multiply by 100: This final step transforms the decimal into a percentage, making it easier to interpret.
A Practical Example: Tracking Your Personal Finances
Let’s illustrate this with a common personal finance scenario: budgeting your monthly expenses.
Suppose last month you spent $1,200 on discretionary expenses (dining out, entertainment, shopping). This month, after a concerted effort to cut back, you managed to reduce those expenses to $900. You want to know the percentage decrease in your discretionary spending.
Step 1: Identify the Original and New Values.
- Original Value (last month’s spending) = $1,200
- New Value (this month’s spending) = $900
Step 2: Calculate the Absolute Decrease.
- Absolute Decrease = Original Value – New Value
- Absolute Decrease = $1,200 – $900 = $300
Step 3: Divide the Absolute Decrease by the Original Value.
- $300 / $1,200 = 0.25
Step 4: Multiply by 100 to Express as a Percentage.
- 0.25 × 100 = 25%
Therefore, you achieved a 25% decrease in your discretionary spending this month. This concrete percentage provides a clear indicator of your success and can motivate further budgeting efforts or help you adjust future spending targets.

Real-World Applications Across the Money Spectrum
The utility of percentage decrease extends far beyond simple examples, playing a critical role in strategic financial planning and analysis across various domains.
Personal Finance: Budgeting, Savings, and Debt Management
For individuals, percentage decrease is a powerful tool for personal financial health:
- Budgeting: As seen in the example above, tracking month-over-month or year-over-year percentage decreases in specific spending categories helps identify where cost-cutting efforts are most effective or where spending habits need further adjustment.
- Savings Goals: If you aimed to save $500 this month but only managed $400, you have a percentage decrease in your savings goal attainment. This helps you analyze why and adjust your strategy.
- Debt Management: While ideally you’re looking for percentage increase in payments, understanding a percentage decrease in the rate of debt accumulation (if you’re still adding to debt) can show progress towards stability. Or, calculating the percentage decrease in the outstanding principal of a loan over time demonstrates progress in paying it off.
- Asset Depreciation: Understanding the percentage decrease in the value of assets like cars or electronics over time helps in financial planning for replacement or understanding true cost of ownership.
Business Finance: Sales, Profitability, and Operational Efficiency
In the business world, percentage decrease offers critical insights into performance and operational health:
- Sales Revenue: A percentage decrease in sales revenue from one quarter to the next can signal issues with product demand, marketing effectiveness, or competitive pressures, prompting strategic changes.
- Profitability: Monitoring percentage decreases in gross or net profit margins indicates declining efficiency, rising costs, or pricing problems that need urgent attention.
- Operating Expenses: Businesses constantly seek to reduce costs. Calculating the percentage decrease in utility bills, supply costs, or administrative overhead helps quantify efficiency improvements and measure the success of cost-cutting initiatives.
- Inventory Shrinkage: A percentage decrease in inventory (unaccounted for by sales) highlights issues like theft, damage, or poor inventory management, requiring corrective actions.
- Customer Churn: While often framed as a percentage increase in customers, the flip side is a percentage decrease in the total customer base, indicating dissatisfaction or competitive threats.
Investing: Analyzing Portfolio Performance and Market Trends
Investors rely heavily on percentage decrease to gauge performance and risk:
- Portfolio Drawdowns: When the value of an investment portfolio drops, calculating the percentage decrease from its peak value (a drawdown) is crucial for understanding risk exposure and psychological impact. A 10% drawdown feels very different from a 50% drawdown.
- Stock Price Declines: Analyzing the percentage decrease in a stock’s price helps investors understand the magnitude of market corrections or specific company downturns, influencing buy, sell, or hold decisions.
- Fund Performance: Investment funds (mutual funds, ETFs) report performance as percentage changes. A percentage decrease in a fund’s value over a period helps investors assess its underperformance against benchmarks or other funds.
- Commodity Prices: Fluctuations in commodity prices, such as oil or gold, are often expressed as percentage increases or decreases, directly impacting industries and the broader economy.
Common Pitfalls and Best Practices for Financial Accuracy
While the calculation is simple, misinterpretations or errors can lead to flawed financial conclusions.
Avoiding Calculation Errors
- Order Matters: Always ensure you’re subtracting the New Value from the Original Value in the numerator. Reversing this will give you a negative number, which, while mathematically correct, indicates a decrease, but it’s important to stick to the formula for consistent interpretation.
- Original Value in Denominator: The denominator must always be the original starting value. Using the new value will result in an incorrect percentage.
- Units Consistency: Ensure both numbers are in the same units (e.g., both in dollars, both in units sold) to avoid nonsensical results.
Context is King: Interpreting the Numbers Correctly
A percentage decrease, by itself, is only part of the story. To gain true insight, consider the following:
- Absolute Value: A 50% decrease from $10 is only $5, while a 1% decrease from $1,000,000 is $10,000. Both are decreases, but their absolute impacts are vastly different. Always consider the absolute amount of the change alongside the percentage.
- Time Period: Is the decrease over a day, a month, a year, or a decade? A 10% decrease over a year is concerning; a 10% decrease over a day might be volatile but recoverable.
- Industry Benchmarks: Is the percentage decrease in line with industry trends or is it an outlier? A 5% decrease in sales might be acceptable during a recession when competitors are seeing 10% decreases, but alarming in a booming market.
- Causality: What caused the decrease? Understanding the underlying factors (e.g., economic downturn, new competitor, internal operational issue) is far more valuable than just knowing the percentage.
Leveraging Tools for Seamless Financial Tracking
While manual calculation is fundamental, various tools can automate the process, enhancing efficiency and reducing the chance of error, especially when dealing with large datasets.
Spreadsheet Power: Excel and Google Sheets
Spreadsheets are arguably the most ubiquitous financial tools. You can easily set up a table with your original and new values and apply the formula. For example, if your original value is in cell A2 and your new value is in cell B2, the formula to calculate percentage decrease would be:
=(A2-B2)/A2
To display this as a percentage, simply format the cell to “Percentage” and adjust the decimal places as needed. This allows for dynamic tracking and analysis of multiple financial metrics over time.
Financial Calculators and Online Tools
Many online financial calculators offer specific functions for percentage change. Simply input your original and new values, and the tool will instantly provide the percentage increase or decrease. Dedicated budgeting apps and accounting software also often incorporate these calculations into their reporting features, presenting data in easy-to-understand charts and summaries. While convenient, it’s always good practice to understand the underlying calculation to verify the results or troubleshoot any discrepancies.
Conclusion: Empowering Your Financial Decisions
The ability to calculate percentage decrease between two numbers is more than just a mathematical skill; it’s a cornerstone of financial literacy and effective decision-making. From meticulously managing personal budgets to strategically guiding business operations and making informed investment choices, this metric provides crucial context to quantitative changes. By mastering the formula, understanding its diverse applications, and interpreting results wisely, you empower yourself to identify trends, pinpoint areas of concern, and navigate the complex financial landscape with greater clarity and confidence. Embrace this fundamental tool, and transform raw numbers into powerful insights that drive your financial success.
aViewFromTheCave is a participant in the Amazon Services LLC Associates Program, an affiliate advertising program designed to provide a means for sites to earn advertising fees by advertising and linking to Amazon.com. Amazon, the Amazon logo, AmazonSupply, and the AmazonSupply logo are trademarks of Amazon.com, Inc. or its affiliates. As an Amazon Associate we earn affiliate commissions from qualifying purchases.