In the intricate world of finance, numbers tell a story. But raw figures alone often lack the context needed to truly understand that narrative. A salary increase of $500 sounds good, but how good is it in relation to your previous earnings? A stock dropping by $10 might seem concerning, but what percentage of its value did it lose? This is where the crucial concepts of percent increase and percent decrease come into play. They are not just mathematical exercises; they are indispensable tools that transform raw data into actionable financial intelligence, enabling individuals and businesses alike to make informed decisions, track progress, and forecast future trends.

Whether you’re monitoring your investment portfolio, scrutinizing budget fluctuations, evaluating business growth, or simply trying to understand the impact of inflation on your purchasing power, the ability to accurately calculate and interpret percentage changes is a cornerstone of financial literacy. This guide will demystify these calculations, providing clear formulas, practical examples rooted in financial scenarios, and insights into how these percentages empower smarter financial management.
Why Understanding Percentage Change is Crucial for Your Financial Health
At its core, financial decision-making hinges on comparison. Did my income grow sufficiently to outpace inflation? Is this investment performing better than its benchmark? Has my spending on a particular category truly decreased? Absolute numbers (like a $100 increase or decrease) provide a factual data point, but they rarely offer the full picture. Percentage change, conversely, contextualizes these movements, providing a relative measure that is far more meaningful for analysis and comparison.
Unveiling the True Story Behind Your Numbers
Imagine your savings account grew by $1,000 this year. On its own, that sounds positive. But if your initial balance was $10,000, that’s a 10% increase. If your initial balance was $100,000, it’s a mere 1% increase. The absolute gain is the same, but the impact and performance are vastly different. Percentage change allows you to gauge efficiency, growth rate, and overall impact, moving beyond the superficiality of raw figures to understand the true financial narrative. It’s the difference between knowing what happened and understanding how significant it was.
From Personal Budgets to Investment Portfolios: Universal Relevance
The utility of percent increase and decrease spans every facet of financial life. For personal finance, it’s essential for:
- Budgeting: Tracking month-over-month changes in income and expenses to identify trends and areas for adjustment.
- Savings: Measuring the growth rate of your savings or emergency fund.
- Debt Management: Understanding how much your debt has decreased as you pay it off.
- Salary Negotiations: Quantifying your desired raise as a percentage of your current earnings.
In the realm of investing, it’s paramount for:
- Portfolio Performance: Calculating the return on investment (ROI) for stocks, bonds, mutual funds, or real estate.
- Market Analysis: Understanding daily, weekly, or annual changes in market indices.
- Risk Assessment: Evaluating the volatility of an asset based on historical price fluctuations.
For businesses, these calculations are fundamental to:
- Sales Growth: Measuring the increase or decrease in revenue over various periods.
- Profit Margins: Analyzing changes in profitability.
- Expense Control: Identifying areas where costs have risen or fallen.
- Forecasting: Projecting future performance based on historical percentage changes.
The Power of Context: Absolute vs. Relative Changes
Understanding the distinction between absolute and relative change is key. An absolute change is simply the difference between the final value and the initial value (Final Value – Initial Value). A relative change, expressed as a percentage, provides that crucial context by relating the absolute change back to the initial value. This makes it possible to compare changes across vastly different scales. For instance, a $1,000 increase in a $10,000 investment is a much larger relative change (10%) than a $1,000 increase in a $1,000,000 investment (0.1%). Without percentages, such comparisons would be misleading or impossible.
The Foundational Formulas: Mastering Increase and Decrease Calculations
Calculating percent increase or decrease relies on a simple, yet powerful, set of formulas. While the intent—growth versus reduction—is different, the underlying mathematical principle is similar: comparing the magnitude of change to the starting point.
The Percent Increase Formula: Step-by-Step for Growth
When a value grows over time, we calculate the percent increase. This is common when tracking investment gains, income raises, or sales growth.
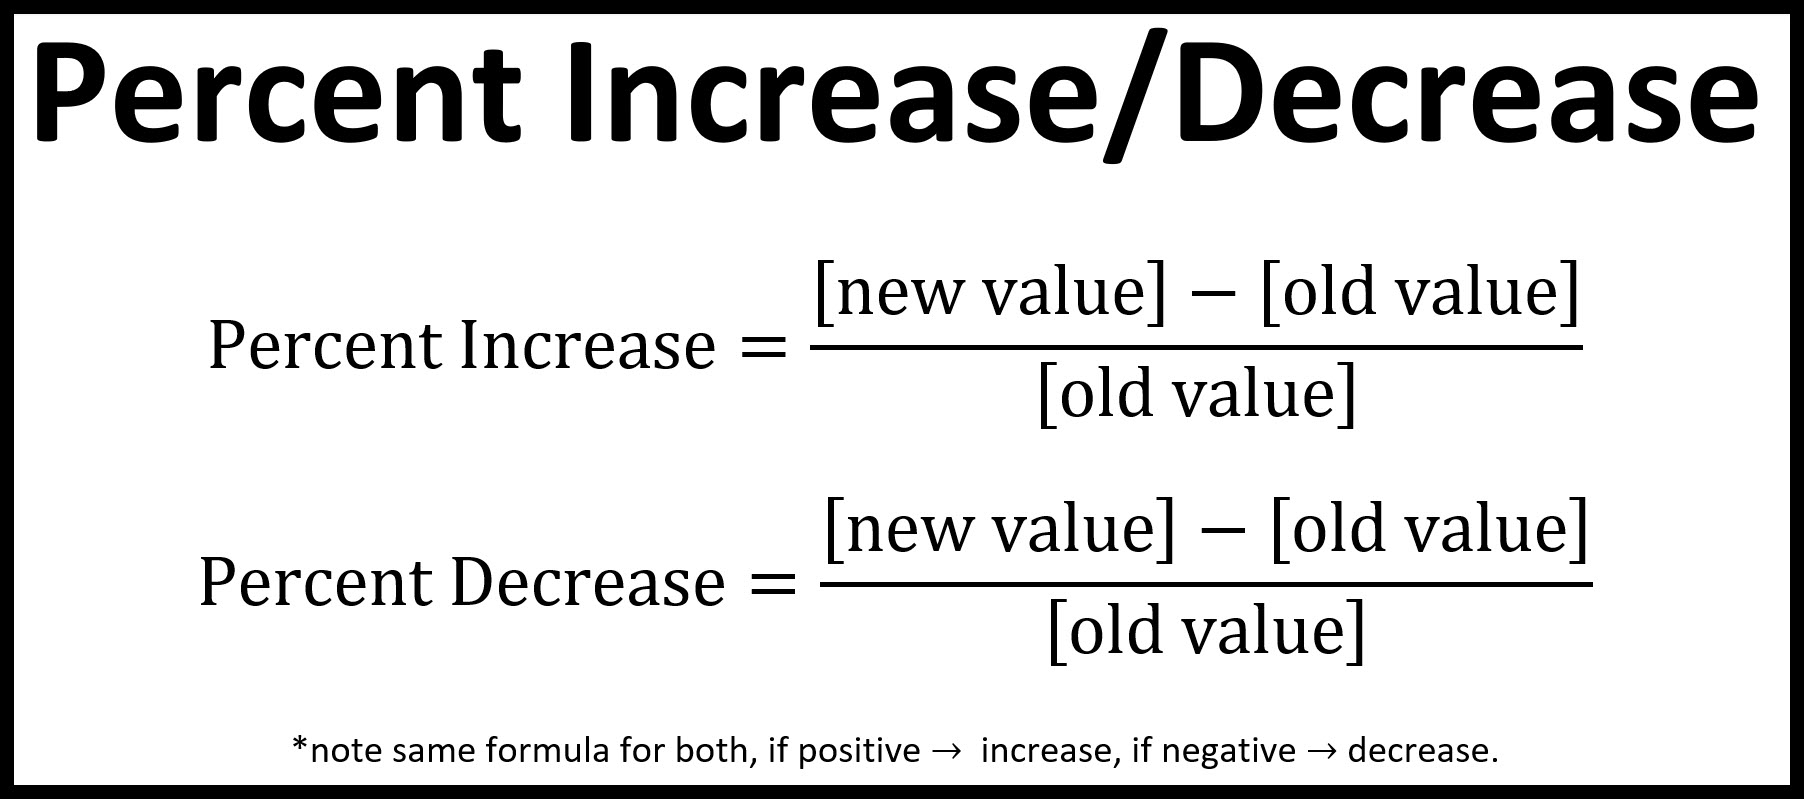
The formula is:
Percent Increase = ((Final Value – Initial Value) / Initial Value) * 100
Let’s break it down with an example:
Example: Investment Growth
Suppose you invested $5,000 in a stock (Initial Value), and it grew to $6,250 (Final Value) over a year.
- Find the absolute change: Final Value – Initial Value = $6,250 – $5,000 = $1,250
- Divide the change by the initial value: $1,250 / $5,000 = 0.25
- Multiply by 100 to express as a percentage: 0.25 * 100 = 25%
Your investment saw a 25% increase.
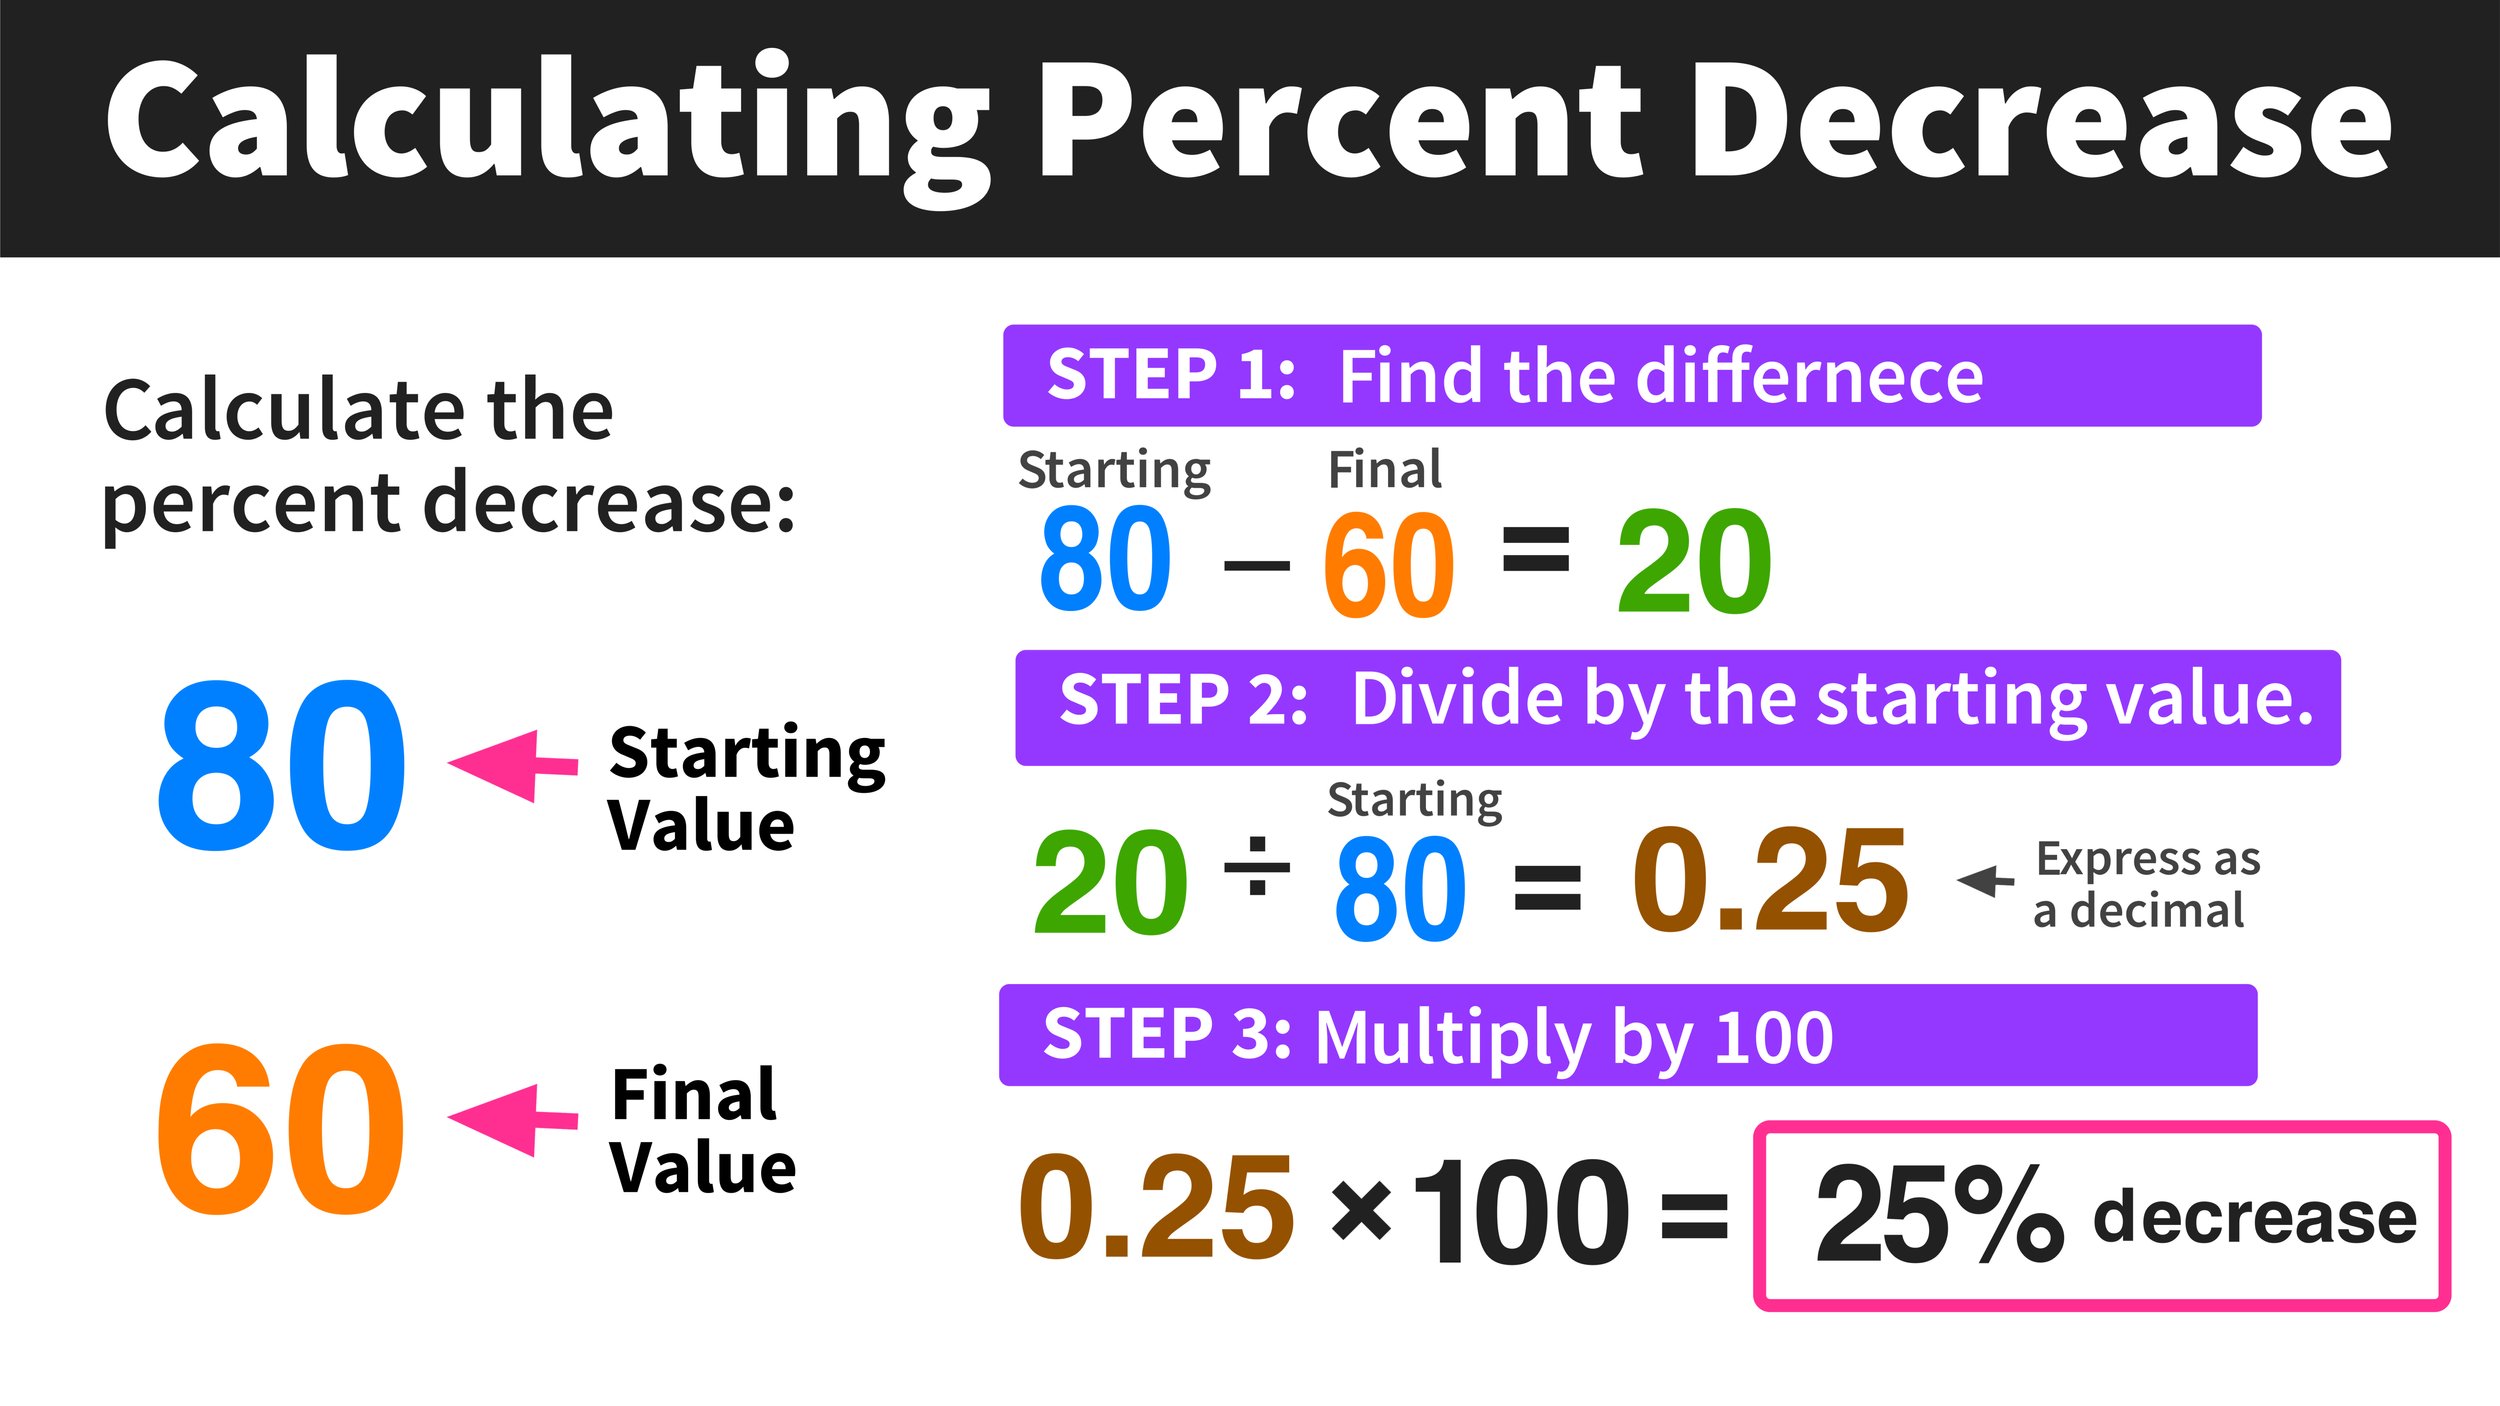
The Percent Decrease Formula: Step-by-Step for Reductions
When a value diminishes, such as a drop in expenses, a decrease in asset value, or a reduction in debt, we calculate the percent decrease.
The formula is:
Percent Decrease = ((Initial Value – Final Value) / Initial Value) * 100
Note: The difference in this formula is that the Initial Value is subtracted from the Final Value for increase, and the Final Value is subtracted from the Initial Value for decrease. This ensures the numerator is always positive before dividing by the Initial Value, resulting in a positive percentage representing the decrease.
Let’s illustrate with an example:
Example: Expense Reduction
Last month, your household spent $800 on groceries (Initial Value). This month, through careful budgeting, you reduced that to $680 (Final Value).
- Find the absolute change (reduction): Initial Value – Final Value = $800 – $680 = $120
- Divide the change by the initial value: $120 / $800 = 0.15
- Multiply by 100 to express as a percentage: 0.15 * 100 = 15%
You achieved a 15% decrease in your grocery expenses.
Common Errors and How to Avoid Them
- Mixing up Initial and Final Values: Always ensure the “Initial Value” is the starting point and the “Final Value” is the ending point for your calculation. Swapping them will result in an incorrect sign or an inverted percentage.
- Dividing by the Final Value: A common mistake is to divide the change by the final value instead of the initial value. The reference point for change is always the original amount.
- Forgetting to Multiply by 100: After dividing, the result is a decimal. To convert it into a percentage, you must multiply by 100.
- Ignoring Negative Numbers: When calculating percentage change (which can be either an increase or decrease), the general formula is
((Final Value - Initial Value) / Initial Value) * 100. A positive result indicates an increase, and a negative result indicates a decrease. However, for clarity and to avoid a negative sign for a ‘decrease’ percentage, the specific ‘Percent Decrease’ formula is often used, ensuring a positive percentage value. Be consistent in your approach.
Real-World Applications Across Your Financial Journey
The ability to calculate percent increase or decrease isn’t just an academic exercise; it’s a practical skill with profound implications for managing your money effectively across various scenarios.
Evaluating Investment Performance: Stocks, Funds, and Crypto
This is arguably one of the most common applications. When you invest, you want to know how well your money is growing.
- Stock Returns: If you bought a stock for $100 and sold it for $120, that’s a 20% increase.
- Mutual Funds: Comparing the percentage return of different funds over the same period helps you identify top performers.
- Crypto: The volatile nature of cryptocurrencies makes percentage change calculations vital for understanding daily gains or losses and managing risk. A 5% daily swing in crypto might be normal, while a 5% swing in a blue-chip stock would be highly unusual.
Managing Personal and Business Budgets: Tracking Income and Expenses
Budgeting is all about control and optimization. Percentage changes provide the insights needed to achieve this.
- Income Analysis: Has your take-home pay increased by 3% this year, while inflation is at 5%? This means your purchasing power has actually decreased by 2%.
- Expense Tracking: If your utility bill increased by 10% this month, but your income only rose by 2%, you know there’s a growing disparity that needs attention. Conversely, a 15% decrease in discretionary spending indicates successful budgeting efforts.
- Business Operating Costs: A business owner might track a 7% increase in raw material costs, prompting them to renegotiate with suppliers or adjust product pricing.
Understanding Economic Indicators: Inflation, Interest Rates, and Market Shifts
Macroeconomic factors directly impact personal and business finance, and they are almost universally expressed in percentages.
- Inflation: The Consumer Price Index (CPI) measures the average change over time in the prices paid by urban consumers for a market basket of consumer goods and services. A 3% annual inflation rate means that, on average, goods and services cost 3% more than they did last year, eroding the purchasing power of your money.
- Interest Rates: The Federal Reserve might increase the federal funds rate by 0.25%, which then influences lending rates for mortgages, car loans, and credit cards. Understanding the percentage change helps predict the impact on your borrowing costs.
- Market Shifts: Reports often highlight a “Dow Jones Industrial Average up 1.5%” or a “Nasdaq down 0.8%,” providing a quick snapshot of market sentiment and direction.
Analyzing Debt and Savings Growth
For personal financial planning, tracking the percentage change in your debt and savings balances is critical for achieving financial goals.
- Debt Reduction: If you reduced your credit card debt from $5,000 to $4,000, you achieved a 20% decrease. This metric can be incredibly motivating.
- Savings Milestones: Measuring your progress towards a savings goal (e.g., “I’ve increased my emergency fund by 30% this quarter”) provides a clear picture of your trajectory.
Beyond the Basics: Advanced Insights and Interpretations
While the core formulas are straightforward, their application can yield deeper insights when considering more complex financial scenarios.
The Impact of Compounding: Understanding Multi-Period Changes
A single percentage change tells you about one period. But in finance, money often compounds. When an investment grows by 10% each year for three years, it doesn’t simply grow by 30%. The 10% gain in year two is calculated on the new, higher balance from year one. This is the power of compounding. For multi-period growth, the Compound Annual Growth Rate (CAGR) is often used.
CAGR = ((Ending Value / Beginning Value)^(1 / Number of Years)) - 1
This single percentage rate describes the smoothed annual growth rate over multiple periods, providing a more accurate picture than simply averaging annual percentage changes.
Adjusting for Inflation: Calculating Real Returns
Nominal returns are the raw percentage gains on your investments. However, inflation erodes purchasing power. To understand the true increase in your wealth, you need to calculate real returns.
Real Return ≈ Nominal Return - Inflation Rate (For small percentages)
Real Return = (((1 + Nominal Return) / (1 + Inflation Rate)) - 1) * 100 (More precise formula)
If your investment grows by 7% (nominal return) but inflation is 3%, your real return is roughly 4%. This calculation is vital for ensuring your money is truly growing in value over time, not just in nominal terms.
Strategic Decision-Making: Forecasting and Goal Setting
Percentage changes are invaluable for strategic planning.
- Forecasting: If your business has consistently grown sales by an average of 8% annually, you can use this percentage to project future revenue.
- Goal Setting: If you want to double your investment in 7 years, you can calculate the required annual percentage return using the Rule of 72 (72 / Years = Annual Rate, or 72 / Rate = Years). This helps set realistic expectations and informs investment choices.
- Risk Assessment: Analyzing historical percentage volatility of different assets helps investors understand potential downside risk and upside potential, guiding portfolio diversification.
Tools and Techniques for Efficient Calculation
While understanding the manual calculation is essential, modern financial management benefits greatly from leveraging available tools.
Harnessing Spreadsheets: Excel and Google Sheets Functions
Spreadsheets are financial powerhouses. They make calculating percentage changes incredibly efficient, especially for large datasets.
- Simple Percentage Change: If you have an initial value in cell A2 and a final value in B2, you can use the formula
=(B2-A2)/A2(for change as a decimal) or=(B2-A2)/A2*100(for percentage). Format the cell as a percentage. - Auto-filling: Once you set up the formula for one row, you can drag it down to apply it to hundreds or thousands of rows, instantly calculating percentage changes across your entire financial data.
Leveraging Online Financial Calculators and Apps
For quick, one-off calculations or specific financial scenarios, online calculators are a convenient solution. Websites of financial institutions, investment platforms, and personal finance blogs often host specialized calculators for investment returns, loan payments, savings growth, and general percentage changes. Many mobile banking or budgeting apps also incorporate these functionalities, allowing you to track your financial health on the go.
When to Use Mental Math vs. Detailed Calculations
For rough estimates or quick checks, mental math can be useful. For instance, estimating 10% of a number is easy (just move the decimal one place to the left). If your expenses were $500 and now they’re $550, you can quickly see that’s a 10% increase. However, for precision, critical financial decisions, or when dealing with larger, more complex numbers, always rely on detailed calculations using a calculator or spreadsheet to avoid errors.
In conclusion, the ability to calculate and interpret percent increase or decrease is more than just a mathematical skill; it’s a fundamental pillar of financial literacy. It empowers you to dissect your financial data, understand trends, measure performance, and ultimately make more informed decisions that contribute to your personal wealth growth and financial stability. By mastering these formulas and applying them consistently, you gain a powerful lens through which to view and navigate your financial world.
aViewFromTheCave is a participant in the Amazon Services LLC Associates Program, an affiliate advertising program designed to provide a means for sites to earn advertising fees by advertising and linking to Amazon.com. Amazon, the Amazon logo, AmazonSupply, and the AmazonSupply logo are trademarks of Amazon.com, Inc. or its affiliates. As an Amazon Associate we earn affiliate commissions from qualifying purchases.