In the realms of personal finance, corporate accounting, and strategic investing, precision is the currency of success. Whether you are comparing the performance of two stocks, evaluating the efficiency of different business units, or assessing the competitiveness of various high-yield savings accounts, understanding the nuances of mathematical comparison is essential. One of the most critical, yet frequently misunderstood, tools in a financial toolkit is the calculation of percent difference.
While many individuals conflate “percent change” with “percent difference,” the two serve distinct roles in financial analysis. Percent difference is utilized to compare two independent values that represent the same category to determine how much they deviate from one another. In this guide, we will explore the exact methodology for calculating percent difference, its practical applications in wealth management, and how it can be used to drive smarter business decisions.

The Fundamental Formula: Understanding Percent Difference in Financial Terms
To make informed financial decisions, one must first master the underlying mathematics. Percent difference is specifically designed to compare two numbers where neither is considered the “baseline” or the “original” value. This makes it distinct from percent increase or decrease, which measures the evolution of a single data point over time.
Percent Difference vs. Percent Change
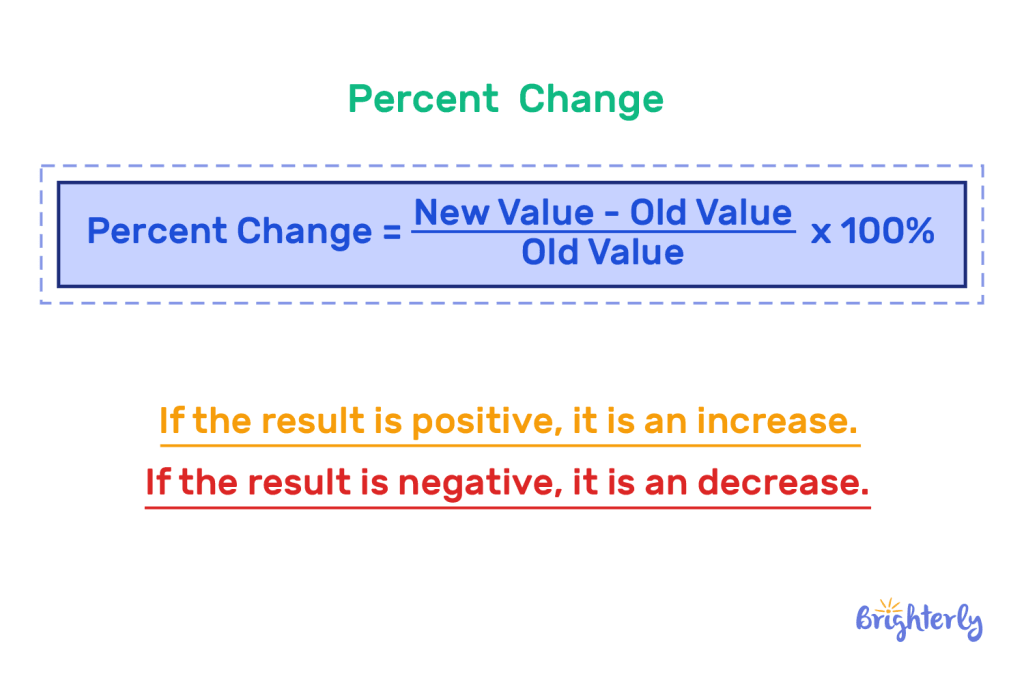
In the context of the money niche, the distinction between these two is vital. Percent change (e.g., “The S&P 500 rose by 10% this year”) looks at a chronological progression. Percent difference, however, looks at a horizontal comparison. For example, if you are comparing the interest rates of two different lending institutions, you are looking for the percent difference between two concurrent options.
The formula for percent difference is as follows:
Percent Difference = |Value A – Value B| / [(Value A + Value B) / 2] × 100
In simpler terms, you take the absolute difference between the two values, divide that by the average of the two values, and then multiply by 100 to get the percentage.
The Step-by-Step Calculation Methodology
Let’s apply this to a real-world financial scenario. Imagine you are a business owner comparing the insurance premiums of two different providers. Provider A quotes you $5,000 annually, while Provider B quotes $5,500.
- Find the Absolute Difference: Subtract one from the other. $|5,500 – 5,000| = 500$.
- Find the Average: Add the two values and divide by two. $(5,500 + 5,000) / 2 = 5,250$.
- Divide the Difference by the Average: $500 / 5,250 = 0.0952$.
- Convert to a Percentage: Multiply by 100 to get $9.52%$.
By identifying a 9.52% difference, a business owner can better weigh whether the additional services offered by Provider B justify the nearly 10% premium increase relative to the average cost.
Practical Applications in Personal Finance and Budgeting
For the individual focused on wealth accumulation, percent difference is a powerful tool for optimizing cash flow. High-level budgeting is not just about tracking where money goes; it is about analyzing the efficiency of every dollar spent.
Comparing Expense Variances
When performing a forensic audit of your monthly expenses, you might compare similar categories. For instance, if you spent $400 on dining out in January and your neighbor, who has a similar lifestyle, spent $600, calculating the percent difference (40%) provides a clear metric of your relative frugality or your neighbor’s relative excess. In a professional financial planning context, we use these metrics to establish benchmarks for “lifestyle creep.”
Evaluating High-Yield Savings and Debt Interest Rates
In a fluctuating interest rate environment, savers often find themselves choosing between multiple financial institutions. If “Bank X” offers a 4.2% APY and “Bank Y” offers a 4.5% APY, the nominal difference is 0.3%. However, calculating the percent difference allows an investor to see the relative gain in yield.
While 0.3% sounds small, the percent difference between the two rates is approximately 6.89%. For a high-net-worth individual moving $1,000,000 in liquidity, a nearly 7% relative difference in interest income represents thousands of dollars in “found money” annually. This calculation shifts the perspective from “only a fraction of a percent” to “a significant relative increase in return.”
Leveraging Percent Difference for Smarter Investing
In the world of investing, the ability to compare two assets side-by-side is what separates the retail amateur from the seasoned analyst. Percent difference allows for a neutralized comparison of assets that may have different price points but similar market roles.
Analyzing Stock Volatility and Market Trends
Investors often use percent difference to compare the volatility of two competing stocks within the same sector. If Stock A has a daily price swing of $5 and Stock B has a daily swing of $15, the raw numbers are misleading if Stock A is priced at $50 and Stock B is priced at $500. By applying percentage-based comparisons, an investor can determine which asset is truly more volatile relative to its value.
Furthermore, when comparing the dividend yields of two “Dividend Aristocrats,” percent difference helps in assessing the “yield gap.” If one utility company yields 3.8% and another yields 4.2%, understanding the 10% relative difference in income potential can influence a portfolio’s long-term compounding trajectory.
Real Estate Valuations and Comparative Market Analysis (CMA)
Real estate investors rely heavily on percent difference when conducting a Comparative Market Analysis. When two properties in the same neighborhood have different square footage or amenities, the “price per square foot” becomes the standard unit of measurement. If Property A is $300/sq. ft. and Property B is $330/sq. ft., the percent difference calculation (9.52%) tells the investor how much of a premium they are paying for Property B. This metric is crucial during negotiations; if the property’s features do not justify a nearly 10% deviation from the local average, the investor has a mathematical basis for a lower offer.
Advanced Business Metrics: Using Percent Difference for Growth Analysis
For entrepreneurs and C-suite executives, percent difference is an indispensable KPI (Key Performance Indicator). It is used to measure departmental efficiency, marketing channel effectiveness, and competitive positioning.
Benchmarking Against Industry Competitors
A company does not exist in a vacuum. To understand market health, a CFO must compare the company’s profit margins against the industry average. If your firm operates at a 15% net margin while the industry average is 12%, the percent difference is roughly 22.2%. This indicates a significant competitive advantage in operational efficiency. Conversely, if your margins are 22% lower than the industry average, it signals an urgent need to audit COGS (Cost of Goods Sold) or overhead expenses.
Assessing Revenue Streams and Profitability Margins
Businesses often run “A/B tests” on pricing strategies or marketing campaigns. If “Campaign Alpha” generates $10,000 in sales and “Campaign Beta” generates $12,500, the percent difference of 22.2% provides a clear indication of which strategy should receive the lion’s share of the next quarter’s budget.
Using percent difference in this context removes emotional bias from business decisions. Instead of saying “Campaign Beta felt more successful,” the management team can state, “Campaign Beta outperformed the average of our current strategies by over 20%,” providing a data-driven mandate for scaling.

Conclusion: Mastering the Math for Financial Freedom
The journey toward financial independence and business mastery is paved with data. While basic addition and subtraction are enough to survive, the ability to calculate and interpret percent difference is what allows you to thrive. It transforms raw numbers into actionable insights, allowing you to see the relative value in every investment, expense, and business venture.
By consistently applying this formula, you can identify “yield leaks” in your savings, overvaluations in your portfolio, and inefficiencies in your business operations. In the final analysis, money is a game of margins. Whether those margins are found in a 0.3% interest rate spread or a 10% difference in real estate pricing, the math remains the same. Mastering the percent difference calculation is not just an academic exercise—it is a strategic necessity for anyone serious about optimizing their financial future.
aViewFromTheCave is a participant in the Amazon Services LLC Associates Program, an affiliate advertising program designed to provide a means for sites to earn advertising fees by advertising and linking to Amazon.com. Amazon, the Amazon logo, AmazonSupply, and the AmazonSupply logo are trademarks of Amazon.com, Inc. or its affiliates. As an Amazon Associate we earn affiliate commissions from qualifying purchases.