In the world of finance, numbers tell a story, but percentages often reveal the plot’s true drama. Whether you’re tracking the growth of your investments, analyzing budget variances, comparing interest rates, or evaluating a business’s performance, understanding how to calculate the difference in percentage between two numbers is an indispensable skill. It allows for a standardized comparison that absolute figures simply cannot provide, transforming raw data into actionable insights. This guide will demystify the process, offering a clear, professional, and engaging roadmap to mastering this crucial financial calculation.
Understanding the Importance of Percentage Differences in Finance
At its core, financial analysis is about comparison: how much did this grow? How much did that shrink? Is this change significant? Absolute numbers can be misleading without context. A $100 increase might be negligible for a million-dollar portfolio but transformative for a $500 personal savings account. Percentages provide that essential context, normalizing comparisons across different scales and timeframes.

Why Percentages Matter More Than Absolute Numbers
Consider two companies: Company A’s profits increased by $100,000, and Company B’s profits increased by $10,000. On the surface, Company A appears to have performed ten times better. However, if Company A started with $10 million in profits and Company B with $100,000, the picture changes dramatically. Company A’s profit grew by only 1% ($100,000/$10,000,000), while Company B’s profits soared by 10% ($10,000/$100,000). The percentage difference reveals Company B’s far more impressive relative growth. This concept is fundamental to evaluating return on investment (ROI), year-over-year growth, budget adherence, and countless other financial metrics. Without percentage analysis, crucial insights can remain hidden, leading to suboptimal financial decisions.
Common Financial Scenarios Requiring Percentage Analysis
The applications of percentage differences are ubiquitous in finance:
- Investment Performance: Calculating the return on investment (ROI) for stocks, bonds, or mutual funds over a period.
- Budgeting: Monitoring how much expenses have increased or decreased against planned amounts or previous periods.
- Loan and Savings Rates: Comparing interest rate changes on mortgages, savings accounts, or credit cards.
- Business Growth: Assessing revenue growth, profit margin changes, or market share shifts.
- Economic Indicators: Understanding inflation rates, GDP growth, or unemployment rate fluctuations.
Each scenario benefits from the clarity and standardization that percentage calculations bring to complex financial data.
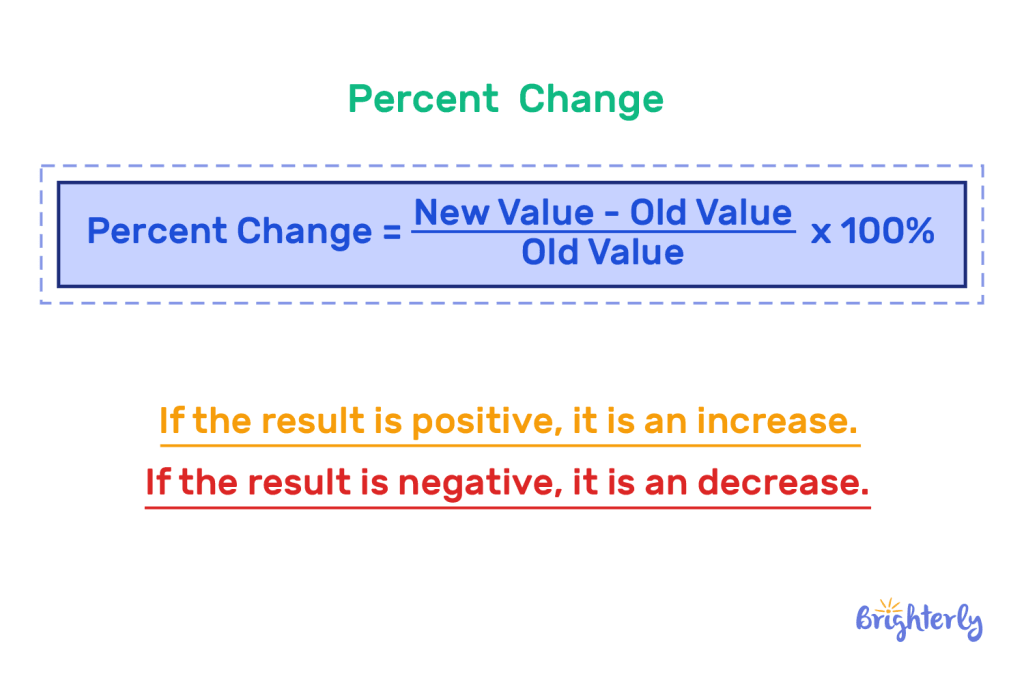
The Fundamental Formula for Percentage Change
Calculating the difference in percentage between two numbers is straightforward once you understand the core formula and its components. This formula can be applied universally, whether you’re looking at an increase or a decrease.
Step-by-Step Breakdown of the Calculation
The general formula for percentage change is:
Percentage Change = ((New Value – Old Value) / Old Value) * 100
Let’s break down each component:
- New Value (or Final Value): This is the number you are comparing to. It represents the later, current, or target value.
- Old Value (or Initial Value): This is the number you are comparing from. It represents the earlier, original, or baseline value.
- Difference (New Value – Old Value): This calculates the absolute change between the two numbers. A positive result indicates an increase, while a negative result indicates a decrease.
- Division by Old Value: Dividing the difference by the Old Value expresses the change as a proportion relative to the starting point. This is crucial for normalization.
- Multiplication by 100: Finally, multiplying the result by 100 converts the decimal proportion into a percentage.
Differentiating Between Increase and Decrease
The formula inherently handles both increases and decreases:
- Percentage Increase: If the New Value is greater than the Old Value, the
(New Value - Old Value)component will be positive, resulting in a positive percentage change. For example, if a stock went from $50 to $60, the change is(($60 - $50) / $50) * 100 = (10 / 50) * 100 = 0.2 * 100 = 20% increase. - Percentage Decrease: If the New Value is less than the Old Value, the
(New Value - Old Value)component will be negative, resulting in a negative percentage change. For example, if a stock went from $60 to $50, the change is(($50 - $60) / $60) * 100 = (-10 / 60) * 100 = -0.1667 * 100 = -16.67% decrease.
It’s important to interpret the sign of the result correctly. A negative sign signifies a decrease, while a positive sign (or no sign) signifies an increase.
Practical Example: Stock Price Fluctuation
Imagine you purchased shares of Company XYZ for $120 each. Six months later, the share price is $138. What is the percentage increase in your investment?
- Old Value (Initial Price) = $120
- New Value (Current Price) = $138
Percentage Change = (($138 – $120) / $120) * 100
Percentage Change = ($18 / $120) * 100
Percentage Change = 0.15 * 100
Percentage Change = 15%
Your investment in Company XYZ shares increased by 15%. Now, what if the price later dropped from $138 to $115?
- Old Value (Previous Price) = $138
- New Value (Current Price) = $115
Percentage Change = (($115 – $138) / $138) * 100
Percentage Change = (-$23 / $138) * 100
Percentage Change = -0.16666… * 100
Percentage Change = -16.67%
The price decreased by 16.67%. Notice that a 15% increase is not perfectly offset by a 15% decrease when the base value changes. This highlights the importance of always using the correct “Old Value” as the denominator.
Advanced Applications and Interpretations in Business and Personal Finance
Beyond simple price changes, percentage differences are the backbone of more sophisticated financial analysis tools, offering deeper insights into performance and trends.
Analyzing Investment Returns and Portfolio Performance
- Return on Investment (ROI): This is a direct application of percentage change. If you invest $10,000 and it grows to $12,500, your ROI is (($12,500 – $10,000) / $10,000) * 100 = 25%. This allows you to compare the profitability of different investments regardless of their initial cost.
- Compound Annual Growth Rate (CAGR): For investments over multiple periods, CAGR uses percentage change to smooth out volatility and show the average annual growth rate. While the formula is more complex (involving exponents), its foundation is still the comparison of an initial and final value expressed as a percentage.
- Portfolio Rebalancing: Understanding percentage allocations helps maintain your desired asset mix. If stocks were 60% of your portfolio and bonds 40%, but stocks have grown significantly, their percentage might now be 70%. Calculating this difference informs your decision to sell some stocks and buy more bonds to restore your target allocation.
Evaluating Budget Variances and Expense Growth
For businesses and individuals alike, budgets are plans, and actual spending often deviates. Percentage differences quantify these variances:
- Budget vs. Actual: If a department budgeted $50,000 for marketing but spent $60,000, the percentage variance is (($60,000 – $50,000) / $50,000) * 100 = 20% over budget. This highlights areas needing closer scrutiny.
- Year-over-Year (YoY) Expense Growth: Comparing current year expenses to the previous year’s expenses helps identify trends. If utility costs increased from $2,000 last year to $2,300 this year, that’s a 15% increase. Understanding these trends is crucial for forecasting and cost control.
- Revenue Growth: Businesses constantly track revenue percentage increases (or decreases) to gauge market acceptance and operational efficiency. A consistent 10% YoY revenue growth is a strong indicator of a healthy business.
Understanding Price Changes and Inflation Rates
The concept of inflation is entirely built on percentage changes in prices over time. Governments and economists track the Consumer Price Index (CPI), which measures the average change over time in the prices paid by urban consumers for a market basket of consumer goods and services. A reported inflation rate of 3% means that, on average, the cost of goods and services has increased by 3% over a specific period. This directly impacts purchasing power and is vital for financial planning, wage negotiations, and investment strategies. Similarly, understanding the percentage change in real estate values or commodity prices is critical for investors and consumers.
Assessing Loan Interest Rate Shifts
Interest rates are expressed as percentages, and their changes significantly impact borrowers and savers. If your variable-rate mortgage interest rate changes from 3.5% to 4.25%, the absolute difference is 0.75 percentage points. However, the percentage change in the interest rate itself is (($4.25 – $3.5) / $3.5) * 100 = 21.43%. This distinction is important for understanding the magnitude of the shift.
Leveraging Financial Tools for Seamless Calculations
While manual calculation is fundamental, financial professionals and savvy individuals often use software and tools to automate and streamline these computations, especially when dealing with large datasets or complex scenarios.
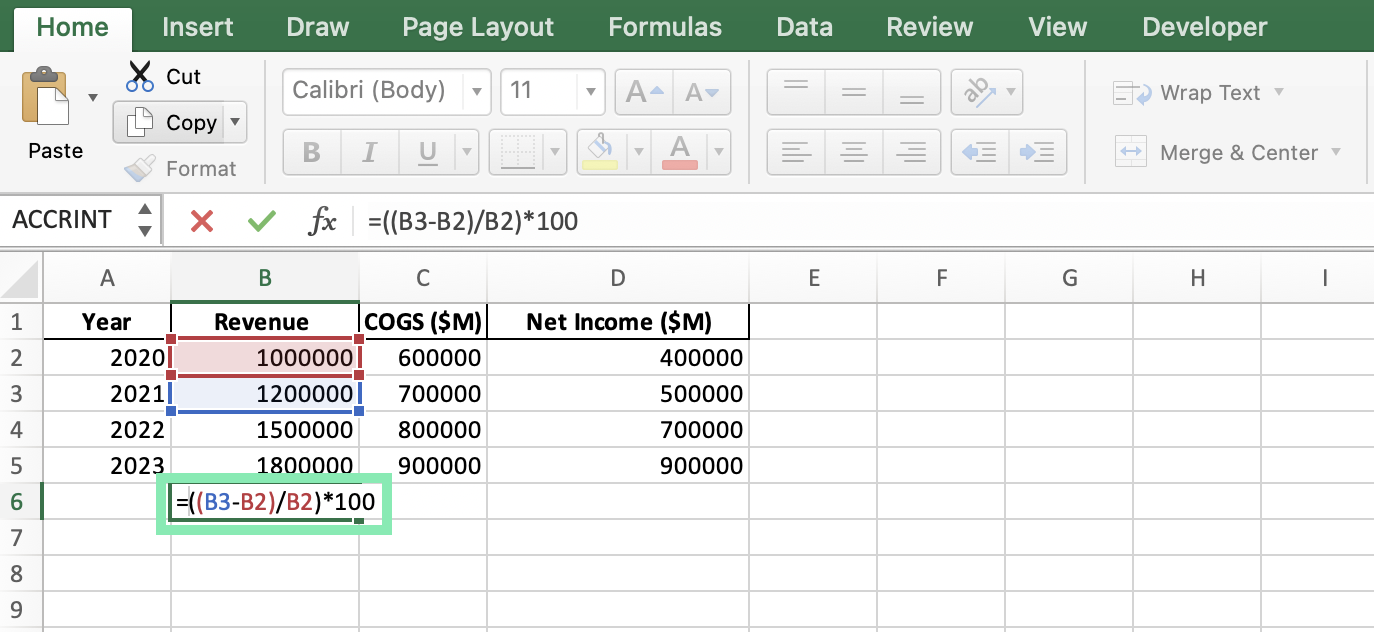
Spreadsheet Software (Excel, Google Sheets) for Automation
Spreadsheets are arguably the most widely used financial tool. They make percentage calculations trivial:
- Basic Formula: If your Old Value is in cell A1 and your New Value in B1, the formula
=((B1-A1)/A1)*100in cell C1 will give you the percentage change. - Formatting: You can directly apply percentage formatting by using the formula
=(B1-A1)/A1and then clicking the “%” style button in the toolbar. This automatically multiplies by 100 and adds the percentage symbol. - Data Analysis: Spreadsheets excel at applying these formulas across rows or columns of financial data, allowing for quick analysis of trends, variances, and performance across multiple assets or time periods.
Online Calculators and Financial Apps
Numerous online percentage change calculators and financial apps are available for quick, one-off calculations. These tools are convenient for personal finance, rapid checks, or when a full spreadsheet is overkill. Many banking apps and investment platforms also incorporate percentage change displays directly into their interfaces to show portfolio gains/losses or transaction summaries.
Programming for Complex Financial Models
For advanced financial modeling, particularly in areas like algorithmic trading, quantitative analysis, or large-scale risk management, programming languages like Python or R are invaluable. They allow for the creation of sophisticated scripts that can process vast amounts of financial data, calculate myriad percentage changes, and build predictive models. While beyond the scope of everyday personal finance, these tools represent the pinnacle of leveraging technology for financial percentage analysis.
Common Pitfalls and Best Practices
Even with a clear formula, misinterpretations can occur. Adhering to best practices ensures accuracy and meaningful analysis.
Avoiding Misinterpretations of Percentage Points vs. Percentage Change
This is a critical distinction, especially in discussions about interest rates or survey results. If an interest rate increases from 5% to 6%, it’s a 1 percentage point increase. However, the percentage change in the interest rate itself is (($6 – $5) / $5) * 100 = 20%. Always be clear whether you are referring to percentage points (absolute difference between two percentages) or the percentage change (relative difference).
Ensuring Consistent Base Values
As demonstrated with the stock price example, the “Old Value” (denominator) must be the correct starting point for your calculation. Using the wrong base value will lead to an incorrect and misleading percentage. For instance, when comparing month-over-month growth, ensure you’re always comparing to the immediately preceding month, not an arbitrary earlier month unless explicitly stated.
The Contextual Nature of Financial Percentages
A 10% increase sounds great, but is it good in context? A 10% investment return might be excellent in a bear market but underperforming in a bull market where competitors are seeing 20% returns. Always consider industry benchmarks, economic conditions, and individual goals when interpreting percentage differences. They are powerful indicators but rarely tell the complete story in isolation.
Mastering the calculation and interpretation of percentage differences between two numbers is not just a mathematical exercise; it’s a fundamental pillar of financial literacy and sound decision-making. By understanding the core formula, applying it to diverse financial scenarios, and leveraging available tools, you empower yourself to navigate the complexities of personal finance, investment, and business with greater confidence and insight.
aViewFromTheCave is a participant in the Amazon Services LLC Associates Program, an affiliate advertising program designed to provide a means for sites to earn advertising fees by advertising and linking to Amazon.com. Amazon, the Amazon logo, AmazonSupply, and the AmazonSupply logo are trademarks of Amazon.com, Inc. or its affiliates. As an Amazon Associate we earn affiliate commissions from qualifying purchases.