
In the intricate world of finance, numbers tell a story. But raw figures alone often lack the context needed to truly understand performance, growth, or decline. This is where the concept of percentage change becomes indispensable. Far more than just a mathematical operation, calculating change percentage is a fundamental skill that empowers individuals and businesses to make informed decisions, track progress, and strategically plan for the future. From assessing investment returns and analyzing business performance to managing personal budgets and understanding economic trends, mastering this calculation is a cornerstone of financial literacy. This guide will delve into the mechanics, applications, and profound importance of percentage change within the financial realm, transforming a simple formula into a powerful analytical tool.
Understanding the Essence of Change Percentage
Before diving into calculations, it’s vital to grasp what percentage change represents and why it holds such significant weight in financial analysis. It’s the universal language for comparing values over time or against a benchmark, providing a standardized measure of relative difference.
What is Percentage Change? Defining the Metric
At its core, percentage change quantifies the relative difference between an initial (old) value and a final (new) value, expressed as a percentage. It answers the question: “How much has a value increased or decreased in relation to its starting point?” Unlike an absolute change, which merely provides the raw numerical difference, percentage change standardizes this difference, making it comparable across different scales and magnitudes. For instance, a $100 increase might seem small for a multi-million dollar corporation but monumental for a small startup. Expressed as a percentage, these changes reveal their true proportional impact.
This metric is particularly powerful because it normalizes data. Whether you’re comparing the growth of a penny stock versus a blue-chip company, or the rise in gas prices versus the increase in your grocery bill, expressing these changes as percentages allows for an “apples-to-apples” comparison of impact and significance, irrespective of the absolute dollar amounts involved.
Why Percentage Change Matters in Finance: Beyond Raw Numbers
In financial contexts, relying solely on absolute numbers can be misleading. Imagine an investment portfolio that increased by $10,000. On the surface, this sounds excellent. However, if the initial investment was $100,000, a $10,000 gain represents a 10% return, which is respectable. But if the initial investment was $1,000,000, the same $10,000 gain is a mere 1% return, indicating potentially poor performance. The percentage change instantly provides this critical context.
For investors, it’s the primary metric for evaluating returns on investment (ROI), comparing the performance of different assets, and assessing portfolio growth. For businesses, it’s crucial for tracking revenue growth, profit margins, cost reductions, and market share shifts. Personal finance individuals use it to monitor budget adherence, savings growth, and debt reduction progress. Without percentage change, financial analysis would be a labyrinth of uncontextualized figures, hindering effective decision-making and strategic foresight. It allows us to differentiate between significant growth and negligible movement, highlighting areas of success or concern that absolute numbers might obscure.
The Core Formula: Unlocking Financial Insights
The elegance of percentage change lies in its straightforward formula, which serves as the bedrock for all financial analysis involving relative shifts. Understanding and applying this formula correctly is the key to unlocking a wealth of insights.
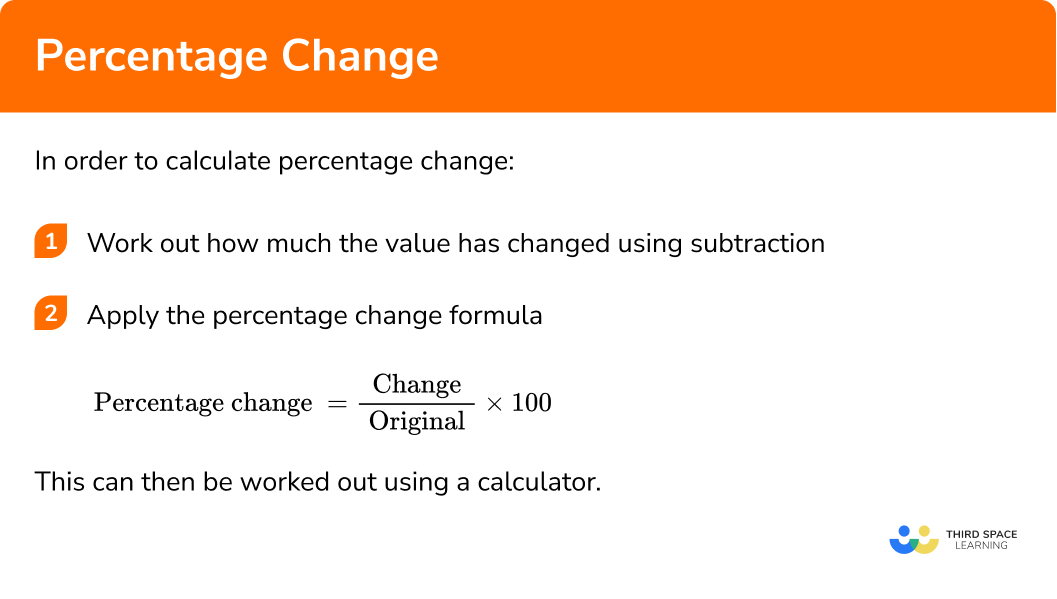
Deconstructing the Basic Formula: (Final Value – Initial Value) / Initial Value * 100%
The universal formula for calculating percentage change is as follows:
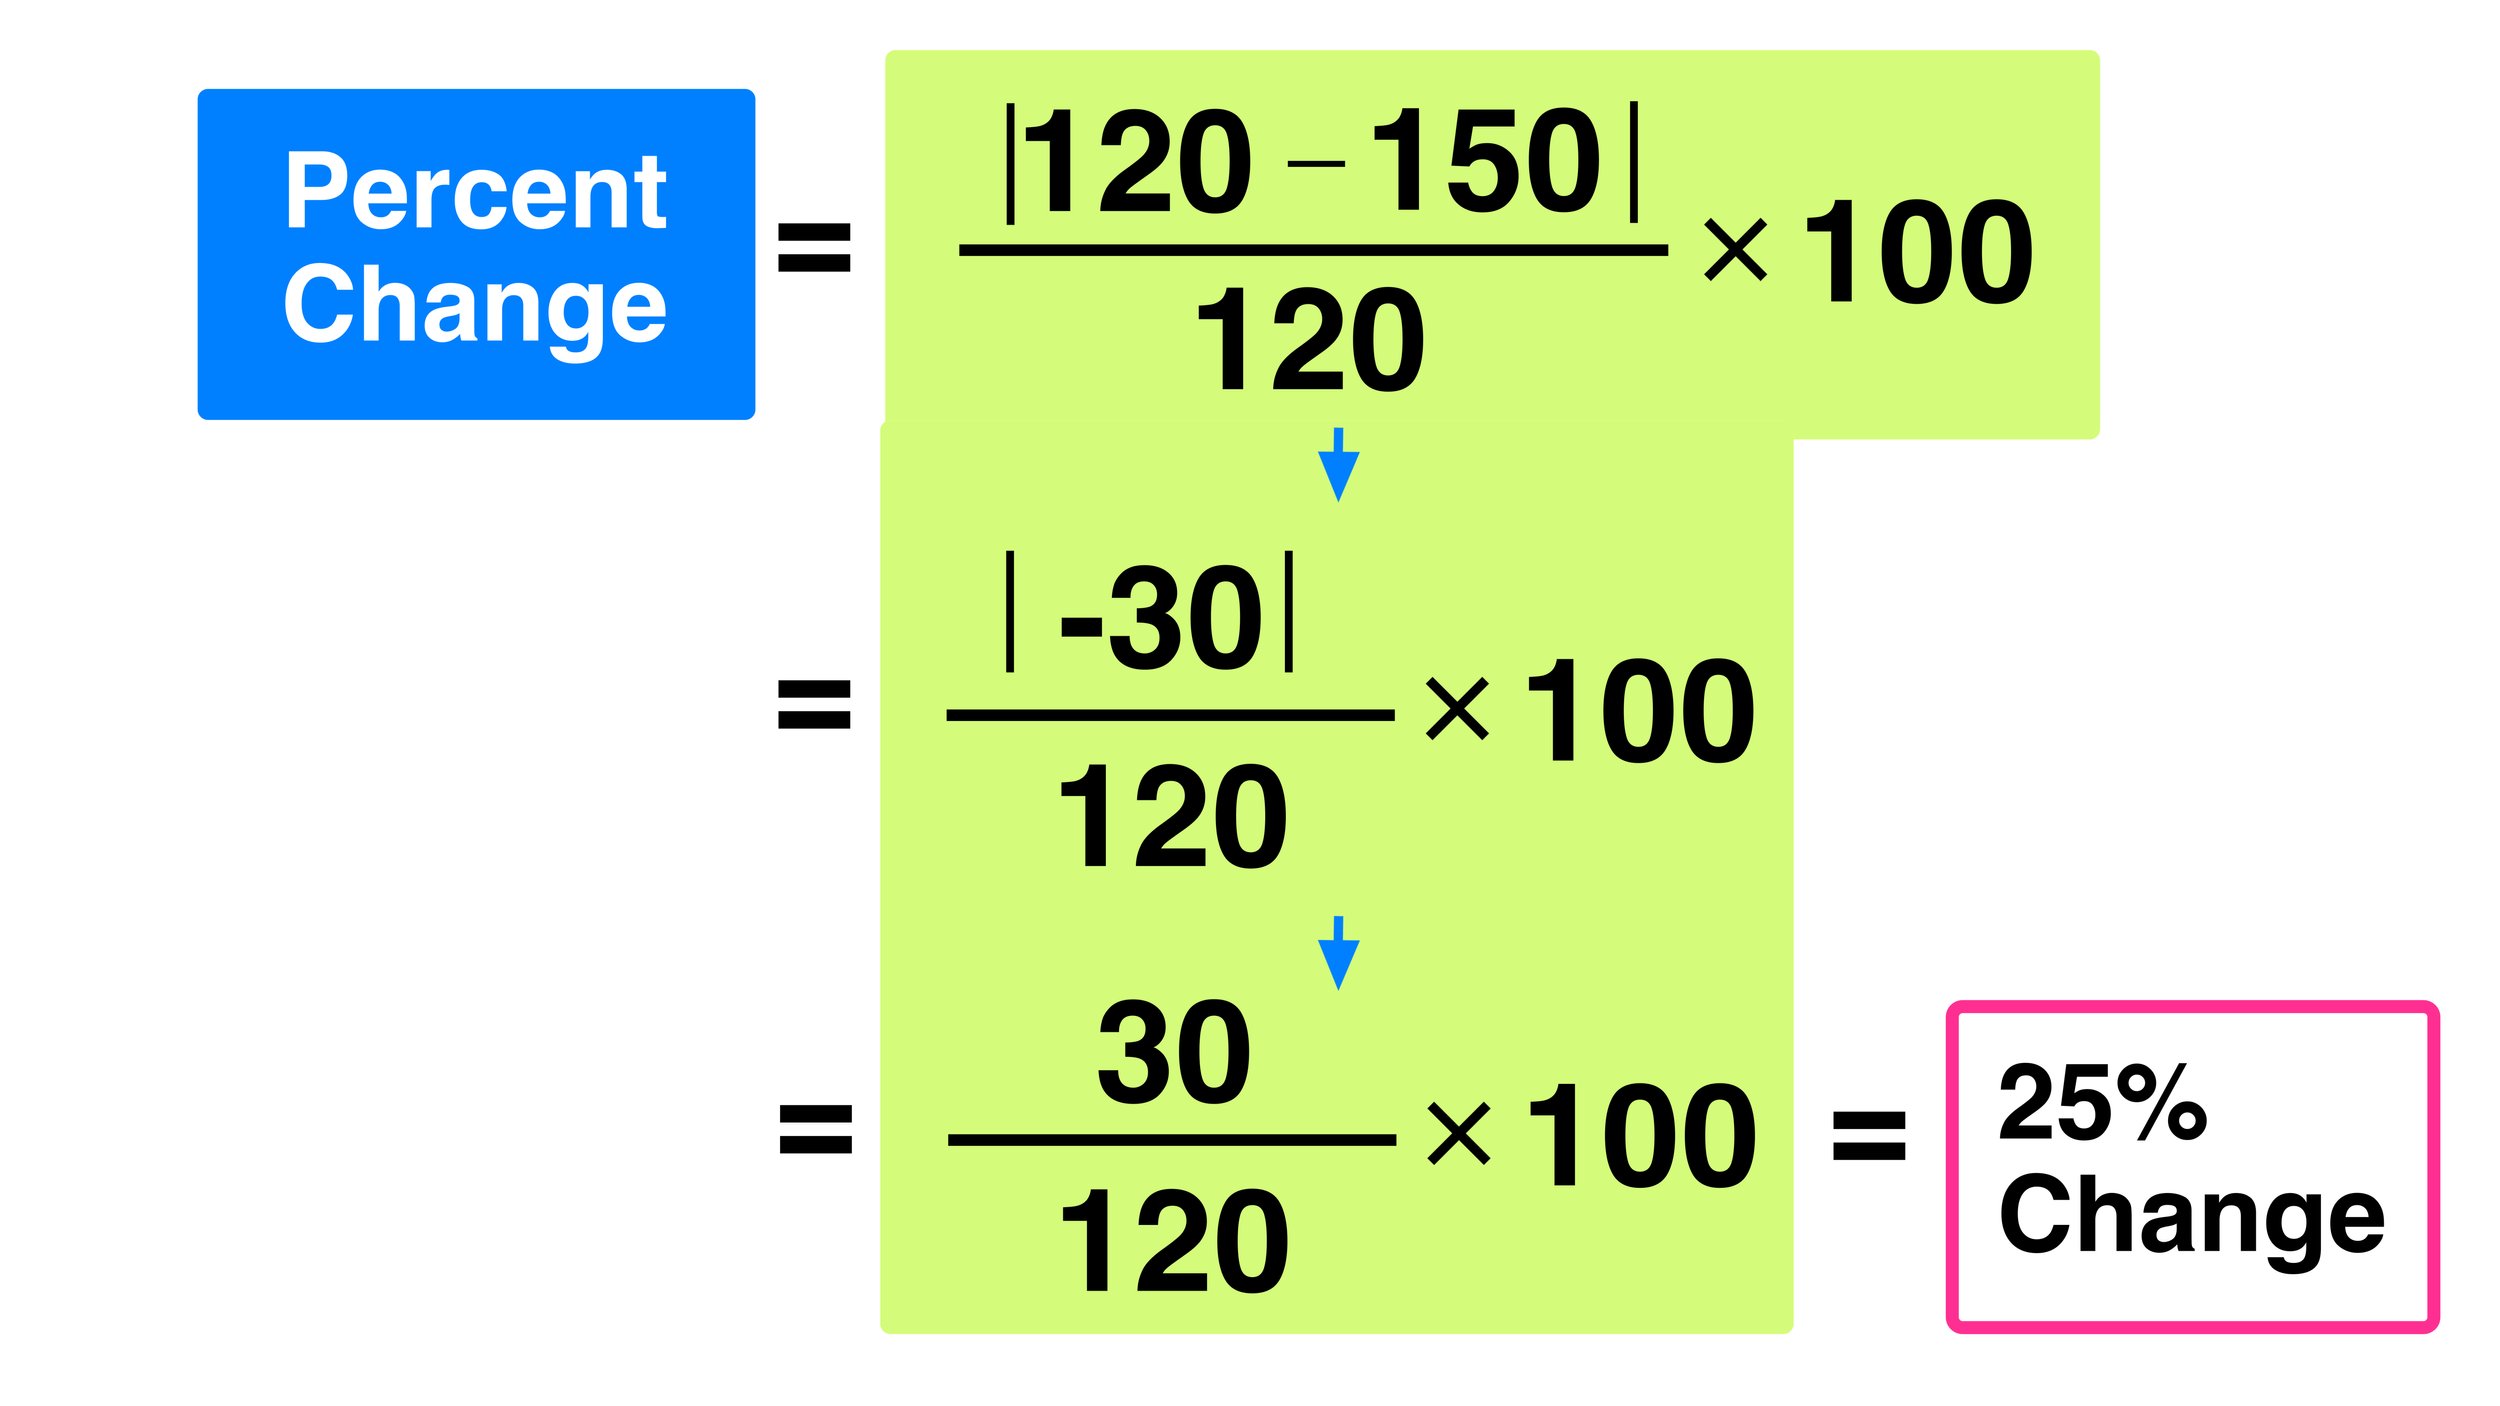
Percentage Change = [ (Final Value – Initial Value) / Initial Value ] * 100%
Let’s break down each component:
- Final Value (New Value): This is the value at the end of the period you are measuring, or the most recent value.
- Initial Value (Old Value): This is the value at the beginning of the period you are measuring, or the reference point from which the change is calculated.
- Difference (Final Value – Initial Value): This first step calculates the absolute numerical change between the two values. If the final value is greater than the initial value, the difference will be positive, indicating an increase. If the final value is less than the initial value, the difference will be negative, indicating a decrease.
- Division by Initial Value: Dividing the absolute difference by the initial value is what normalizes the change. It expresses the change as a fraction (or ratio) of the starting point. This is the crucial step that transforms an absolute difference into a relative one.
- Multiplication by 100%: Finally, multiplying the resulting fraction by 100 converts it into a percentage, making it easily understandable and comparable.
It’s important to remember that the initial value cannot be zero. If the initial value is zero, the calculation is undefined, as division by zero is not possible. In such rare financial cases, it often indicates a new venture or a start from nothing, where other metrics might be more appropriate.
Navigating Positive and Negative Changes: Growth vs. Decline
The sign of the percentage change immediately tells a critical story:
- Positive Percentage Change (e.g., +15%, 0.15): A positive result indicates an increase or growth in the value from the initial point to the final point. In finance, this is generally a desirable outcome, signifying gains in investments, revenue growth, or a reduction in debt (when analyzing debt levels as a “negative” value).
- Negative Percentage Change (e.g., -8%, -0.08): A negative result indicates a decrease or decline in the value. This often signals losses in investments, a drop in sales, or an increase in expenses. Understanding the magnitude of a negative change is just as important as a positive one, as it can highlight areas needing urgent attention or strategic adjustments.
For example, if a stock price goes from $50 to $55, the change is (55-50)/50 * 100% = +10%. This is growth. If it goes from $50 to $45, the change is (45-50)/50 * 100% = -10%. This is a decline. The formula intrinsically captures both scenarios, providing a clear numerical representation of the financial trend.
Step-by-Step Calculation: Practical Applications in Finance
The real power of the percentage change formula comes alive through its practical application across various financial scenarios. Let’s walk through common examples in personal and business finance.
Example 1: Tracking Investment Growth and Portfolio Performance
One of the most frequent uses of percentage change is in evaluating investment returns.
Scenario: You invested $5,000 in a mutual fund on January 1st. By December 31st of the same year, the value of your investment grew to $5,750. What is your percentage return?
Steps:
- Identify Initial Value: $5,000
- Identify Final Value: $5,750
- Calculate Difference: $5,750 – $5,000 = $750
- Divide by Initial Value: $750 / $5,000 = 0.15
- Multiply by 100%: 0.15 * 100% = 15%
Interpretation: Your investment grew by 15% over the year. This 15% figure is far more useful for comparing your fund’s performance against benchmarks (like the S&P 500’s return) or other investment options than the raw $750 gain.
Scenario (Decline): Another stock you owned was worth $1,200, but due to market volatility, it dropped to $1,080.
Steps:
- Identify Initial Value: $1,200
- Identify Final Value: $1,080
- Calculate Difference: $1,080 – $1,200 = -$120
- Divide by Initial Value: -$120 / $1,200 = -0.10
- Multiply by 100%: -0.10 * 100% = -10%
Interpretation: Your stock experienced a 10% loss. This immediately tells you the proportional impact of the decline on your capital.
Example 2: Analyzing Business Revenue and Profit Fluctuations
Businesses constantly monitor key performance indicators (KPIs) using percentage change to understand operational health and strategic effectiveness.
Scenario: A small business generated $150,000 in revenue last quarter. This quarter, their revenue increased to $180,000. What is the percentage increase in revenue?

Steps:
- Initial Revenue: $150,000
- Final Revenue: $180,000
- Difference: $180,000 – $150,000 = $30,000
- Divide by Initial Revenue: $30,000 / $150,000 = 0.20
- Multiply by 100%: 0.20 * 100% = 20%
Interpretation: The business achieved a strong 20% growth in revenue this quarter. This metric is critical for reporting to stakeholders, forecasting future performance, and identifying successful marketing or sales strategies.
Scenario (Profit Decline): Last year, a company had a net profit of $50,000. Due to increased operational costs, this year’s net profit is $45,000.
Steps:
- Initial Profit: $50,000
- Final Profit: $45,000
- Difference: $45,000 – $50,000 = -$5,000
- Divide by Initial Profit: -$5,000 / $50,000 = -0.10
- Multiply by 100%: -0.10 * 100% = -10%
Interpretation: The company’s net profit declined by 10%. This signals a potential issue with cost management or pricing strategy that warrants further investigation.
Example 3: Assessing Personal Budget Variances and Spending Habits
On a personal level, percentage change is invaluable for managing finances and achieving financial goals.
Scenario: You budgeted $400 for groceries last month, but you ended up spending $460. By what percentage did you exceed your budget?
Steps:
- Initial (Budgeted) Value: $400
- Final (Actual Spent) Value: $460
- Difference: $460 – $400 = $60
- Divide by Initial Value: $60 / $400 = 0.15
- Multiply by 100%: 0.15 * 100% = 15%
Interpretation: You overspent your grocery budget by 15%. This insight is crucial for adjusting future spending habits or revising your budget categories.
Scenario (Savings Growth): You started with $1,000 in your emergency fund and managed to save an additional $200 this month, bringing the total to $1,200.
Steps:
- Initial Savings: $1,000
- Final Savings: $1,200
- Difference: $1,200 – $1,000 = $200
- Divide by Initial Savings: $200 / $1,000 = 0.20
- Multiply by 100%: 0.20 * 100% = 20%
Interpretation: Your emergency fund grew by 20% this month. Celebrating such percentage milestones can be a great motivator for continued savings discipline.
Common Pitfalls and Advanced Considerations
While the percentage change formula is straightforward, its application in finance comes with nuances. Awareness of these considerations enhances the accuracy and insightfulness of your financial analysis.
Avoiding Misinterpretations: Context is King
A percentage change alone, without context, can still be misleading. For instance, a small startup increasing its revenue from $1,000 to $2,000 shows a 100% increase. A large corporation increasing its revenue from $1 billion to $1.1 billion shows a 10% increase. While the startup’s percentage change is numerically higher, the corporation’s absolute increase ($100 million) is far greater. Both are significant in their respective contexts.
Always consider:
- The base value: A large percentage change from a very small initial base might not be as impactful as a smaller percentage change from a very large base.
- The timeframe: Is the change over a day, a month, a year, or a decade? A 10% daily change is vastly different from a 10% annual change.
- Industry benchmarks: How does the percentage change compare to industry averages, competitors, or broader economic indicators? A 5% revenue growth might be stellar in a stagnant industry but poor in a rapidly expanding one.
- The cause of change: Was the change organic, or due to a one-time event (e.g., a large asset sale for a business)?
Compounding vs. Simple Changes: Understanding Long-Term Growth
When dealing with changes over multiple periods, it’s crucial to distinguish between simple and compound percentage changes.
- Simple Change: This is what we’ve discussed so far, a single percentage change over one period.
- Compound Change: This refers to changes where the base value itself changes over successive periods. For example, investment returns often compound, meaning returns in one period are added to the principal, and the next period’s returns are calculated on this new, larger principal.
For instance, if an investment grows by 10% in Year 1 and another 10% in Year 2:
- Initial: $100
- End of Year 1: $100 * (1 + 0.10) = $110
- End of Year 2: $110 * (1 + 0.10) = $121
The overall change from $100 to $121 is (121-100)/100 * 100% = 21%. This is greater than a simple 10% + 10% = 20% because of compounding. Understanding this difference is fundamental for calculating annualized returns (CAGR – Compound Annual Growth Rate) and projecting long-term investment growth.
When to Use Absolute vs. Relative Change: Choosing the Right Metric
While percentage change (relative change) is often preferred for normalization and comparability, there are instances where absolute change is more relevant.
- Absolute Change: The raw numerical difference (Final Value – Initial Value). Useful for understanding the exact dollar impact, especially when the initial values are very similar or when you’re primarily concerned with the actual cash flow. For example, knowing that your mortgage payment increased by $50 tells you the precise extra cash you need, regardless of the percentage.
- Relative Change (Percentage Change): As discussed, excellent for comparing performance across different scales.
The best practice is often to consider both. A fund might have an absolute gain of $1,000 (absolute change) but only represent a 0.5% return (relative change) on a $200,000 portfolio. Conversely, a $100 gain might be a 50% return on a $200 investment. Both pieces of information contribute to a comprehensive financial picture.
Leveraging Change Percentage for Smarter Financial Decisions
The ability to accurately calculate and critically interpret percentage change is not just an academic exercise; it’s a practical skill that underpins robust financial decision-making across all levels.
Strategic Planning for Investors and Businesses
For investors, understanding percentage change is paramount for:
- Portfolio Rebalancing: Identifying which assets have overperformed or underperformed (based on percentage change) helps in reallocating funds to maintain desired asset allocation.
- Risk Assessment: Analyzing the percentage volatility (standard deviation of percentage changes) of investments helps gauge risk.
- Goal Tracking: Monitoring the percentage growth of investment accounts towards specific financial goals (retirement, house down payment).
- Comparing Investment Vehicles: Evaluating the percentage returns of different stocks, bonds, mutual funds, or real estate opportunities to choose the best fit for their objectives.
Businesses leverage percentage change for:
- Budgeting and Forecasting: Projecting future revenues and expenses based on historical percentage growth or decline rates.
- Performance Benchmarking: Comparing their own percentage growth in sales, profits, or market share against industry competitors.
- Identifying Trends: Spotting consistent percentage increases in costs or decreases in customer acquisition, indicating areas for strategic intervention.
- Pricing Strategies: Analyzing the percentage change in material costs to adjust product pricing and maintain profit margins.
Empowering Personal Financial Management
On a personal level, this calculation tool provides immense power:
- Budget Adherence: Tracking percentage overspending or underspending in budget categories to refine spending habits.
- Debt Reduction: Monitoring the percentage decrease in debt balances (e.g., credit card debt, student loans) to stay motivated and on track.
- Savings Goals: Observing the percentage growth of emergency funds, retirement accounts, or specific savings targets to ensure progress.
- Net Worth Tracking: Periodically calculating the percentage change in your overall net worth (assets minus liabilities) provides a holistic view of your financial health over time. A consistent positive percentage change in net worth is a strong indicator of financial progress.
Utilizing Financial Tools and Software for Automation
While understanding the manual calculation is essential, most modern financial management is aided by technology. Spreadsheets (like Excel or Google Sheets), personal finance apps, and professional financial software (for businesses and investors) often automate percentage change calculations.
- Spreadsheets: Functions like
(B2-A2)/A2can quickly calculate percentage change across vast datasets. - Personal Finance Apps: Many apps automatically display percentage changes for your budget categories, investment portfolio values, and debt levels.
- Investment Platforms: Brokerage accounts and robo-advisors prominently feature percentage returns for your overall portfolio and individual holdings.
These tools don’t negate the need to understand the underlying calculation but rather free you to focus on the interpretation and strategic implications. By leveraging these tools, individuals and businesses can gain real-time insights into their financial performance, allowing for quicker adjustments and more agile decision-making.
In conclusion, the ability to calculate change percentage is not merely a mathematical exercise; it is a fundamental pillar of financial literacy. It transforms raw numbers into meaningful insights, providing the context necessary for informed decisions in investing, business operations, and personal financial management. Mastering this simple formula and understanding its nuances empowers you to track progress, identify trends, and strategically navigate the ever-evolving landscape of your financial journey.
aViewFromTheCave is a participant in the Amazon Services LLC Associates Program, an affiliate advertising program designed to provide a means for sites to earn advertising fees by advertising and linking to Amazon.com. Amazon, the Amazon logo, AmazonSupply, and the AmazonSupply logo are trademarks of Amazon.com, Inc. or its affiliates. As an Amazon Associate we earn affiliate commissions from qualifying purchases.