
In the intricate world of personal and business finance, understanding how to calculate amount percentages isn’t merely a mathematical exercise; it’s a fundamental skill that underpins informed decision-making, strategic planning, and effective financial management. From deciphering discounts and interest rates to analyzing investment returns and profit margins, percentages provide a universally understood language for comparing proportions, tracking growth, and evaluating performance. Without a solid grasp of this concept, individuals and businesses alike risk misinterpreting crucial financial data, leading to suboptimal choices and missed opportunities.
This article delves into the core mechanics of percentage calculation, framed specifically within the context of money management. We’ll explore why percentages are indispensable, break down the foundational formulas, and apply these concepts to real-world financial scenarios. Furthermore, we’ll examine how modern financial tools simplify these calculations and discuss best practices for interpreting percentage data accurately, ensuring you’re equipped to navigate the complexities of your financial landscape with confidence and precision.
The Indispensable Role of Percentages in Financial Literacy
Percentages are far more than just numbers; they are powerful analytical tools that normalize data, allowing for meaningful comparisons across different scales. In finance, this normalization is crucial for assessing everything from individual budget allocations to national economic growth rates. Without the ability to convert raw amounts into proportional percentages, comparing an investment return of $500 on a $5,000 portfolio with a $50,000 return on a $1,000,000 portfolio would be a much more arduous and less intuitive task. Percentages simplify this, immediately revealing the efficiency and relative performance of different financial activities.
Understanding Financial Health and Growth
For individuals, percentages are key indicators of financial health. What percentage of your income goes towards housing? What percentage of your savings is allocated to an emergency fund? These figures offer immediate insights into your spending habits, debt levels, and financial security. For businesses, percentages are vital for tracking growth, evaluating profitability, and understanding market share. A company’s sales growth of 15% year-over-year or a gross profit margin of 30% tells a compelling story about its operational efficiency and market position, far more succinctly than raw dollar figures alone. They enable stakeholders to gauge progress against targets, identify areas for improvement, and forecast future performance.
Making Informed Spending and Investment Decisions
Every financial decision, from purchasing a discounted item to allocating funds across an investment portfolio, benefits from percentage-based analysis. A “25% off” sale immediately quantifies the savings relative to the original price, helping consumers assess the true value proposition. In investing, understanding percentage returns (e.g., compound annual growth rate or CAGR) allows investors to compare the performance of different assets over various periods, guiding their decisions towards maximizing wealth. Moreover, debt interest rates, expressed as percentages, directly influence the total cost of borrowing, making it imperative to understand how they impact your financial obligations. Percentages empower individuals and businesses to make choices that align with their financial goals, ensuring resources are deployed effectively and efficiently.
Core Principles of Percentage Calculation
At its heart, calculating a percentage is about determining a part’s proportion relative to a whole, expressed as a fraction of 100. This universal framework applies whether you’re calculating a sales tax, a discount, an interest rate, or a growth rate. Mastering a few fundamental formulas unlocks the ability to confidently tackle almost any percentage-related financial query.
The Foundational Formula: Part / Whole * 100
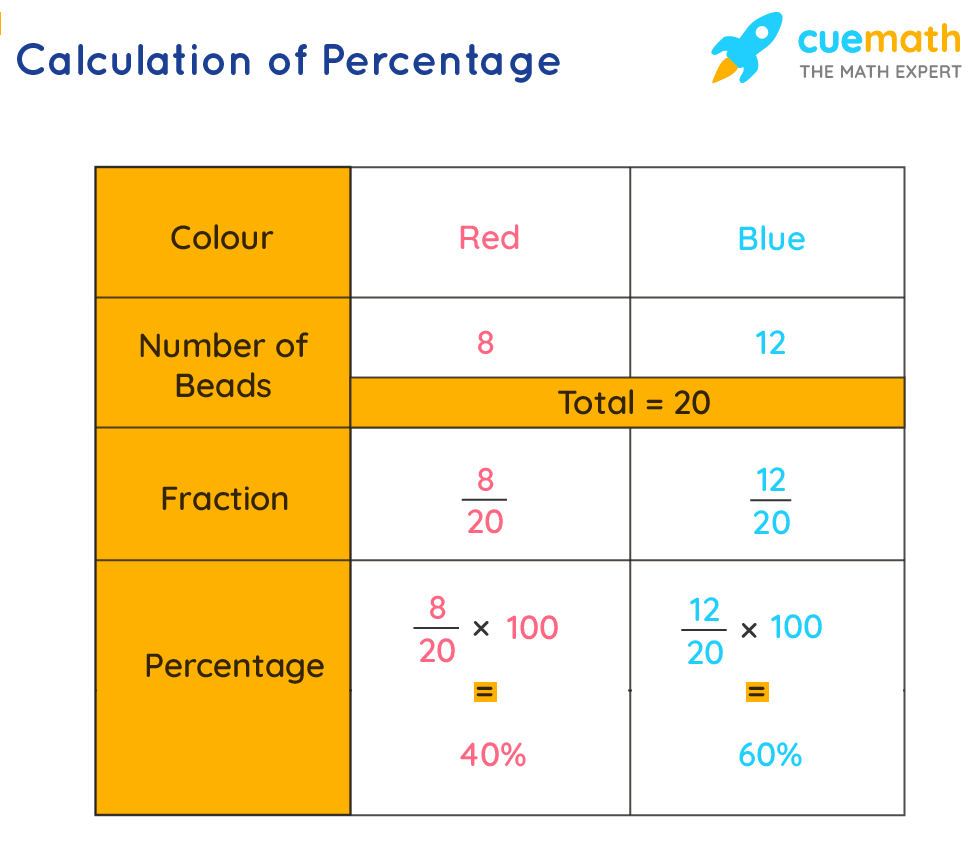
The most basic and essential formula for calculating a percentage is:
Percentage = (Part / Whole) * 100
Here, “Part” represents the specific amount you are interested in, and “Whole” is the total amount or the base from which the part is derived. Multiplying by 100 converts the decimal fraction into a percentage, making it easier to understand and compare.
Example: If you spent $300 on groceries from a monthly budget of $2,000, the percentage spent on groceries would be:
($300 / $2,000) * 100 = 0.15 * 100 = 15%
This formula is the bedrock upon which all other percentage calculations are built, providing a clear, consistent method for expressing proportional relationships.
Calculating a Percentage of a Total Amount
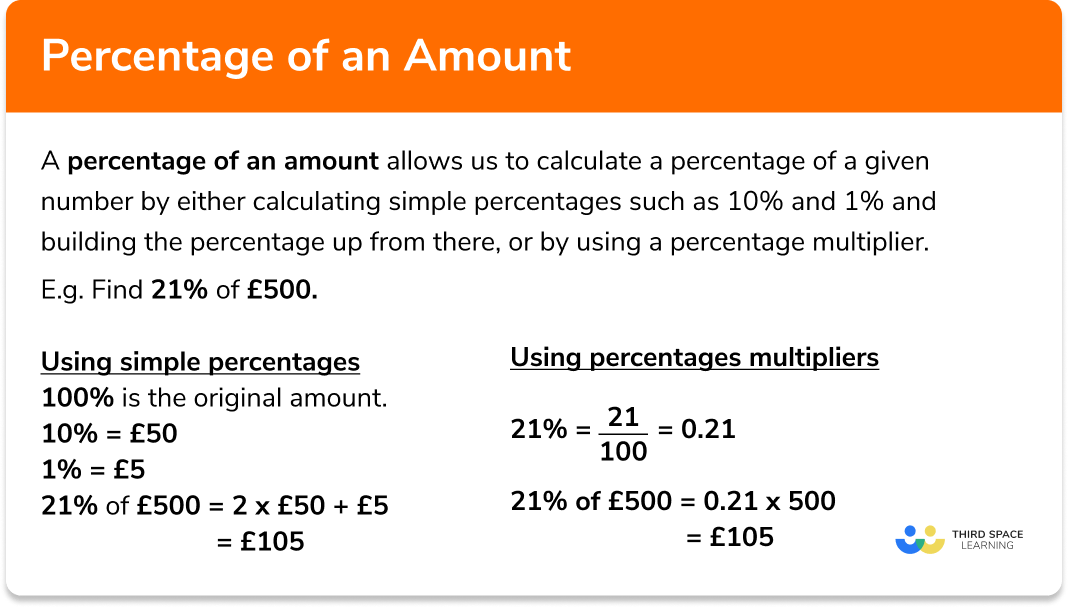
Often, you’ll need to find a specific percentage of a given total amount. This is common when calculating taxes, discounts, commissions, or interest. The formula for this is a rearrangement of the foundational one:
Amount = Percentage (as a decimal) * Total Amount
To use this, first convert the percentage into a decimal by dividing it by 100. For instance, 20% becomes 0.20.
Example: If you want to calculate a 15% tip on a $60 restaurant bill:
Tip Amount = 0.15 * $60 = $9
This calculation is fundamental for budgeting (allocating a percentage of income to savings), sales forecasting (estimating a percentage of total sales for a specific product), and understanding the impact of interest on loans and investments.
Determining Percentage Change: Growth and Decline
Financial analysis frequently requires understanding how an amount has changed over time. This “percentage change” can indicate growth (an increase) or decline (a decrease) and is crucial for tracking investment performance, business growth, or inflation rates. The formula for percentage change is:
Percentage Change = [(New Value – Old Value) / Old Value] * 100
- If the result is positive, it indicates a percentage increase.
- If the result is negative, it indicates a percentage decrease.
Example (Growth): Your investment portfolio grew from $10,000 to $12,000 over a year.
Percentage Change = [($12,000 – $10,000) / $10,000] * 100 = ($2,000 / $10,000) * 100 = 0.20 * 100 = 20% increase
Example (Decline): Your stock value dropped from $50 per share to $45 per share.
Percentage Change = [($45 – $50) / $50] * 100 = (-$5 / $50) * 100 = -0.10 * 100 = -10% decrease
Understanding percentage change is paramount for evaluating the performance of assets, assessing the impact of economic trends, and making forward-looking financial projections. It provides context that raw dollar changes often cannot convey.
Real-World Financial Applications of Percentages
The theoretical understanding of percentage calculation truly comes to life when applied to practical financial scenarios. From managing household budgets to navigating complex investment portfolios, percentages are the common thread that connects diverse financial activities.
Personal Finance: Budgeting, Savings, and Debt
In personal finance, percentages are the backbone of effective money management.
- Budgeting: Crafting a budget often involves allocating percentages of your income to various categories like housing (e.g., 30%), food (e.g., 15%), transportation (e.g., 10%), and savings (e.g., 20%). The popular 50/30/20 rule (50% needs, 30% wants, 20% savings/debt repayment) is entirely percentage-based, offering a simple yet powerful framework for financial discipline.
- Savings: Calculating your savings rate as a percentage of your income helps you track progress toward financial goals, such as retirement or a down payment on a home. Understanding compound interest, which is calculated as a percentage of your principal plus accumulated interest, highlights the exponential power of early and consistent saving.
- Debt: The interest rates on loans (mortgages, credit cards, personal loans) are expressed as percentages. Calculating the total interest paid over the life of a loan or understanding the impact of a high Annual Percentage Rate (APR) on credit card debt is critical for managing liabilities and minimizing financial burdens.
Investing: Return on Investment (ROI) and Portfolio Allocation
For investors, percentages are the primary metric for performance analysis and strategic planning.
- Return on Investment (ROI): This is perhaps one of the most fundamental percentage calculations in investing. ROI measures the profitability of an investment relative to its cost:
ROI = [(Current Value of Investment – Cost of Investment) / Cost of Investment] * 100
A positive ROI indicates a profit, while a negative ROI signifies a loss. Comparing ROIs of different investments helps investors identify the most lucrative opportunities. - Portfolio Allocation: Modern portfolio theory emphasizes diversification, which is achieved by allocating specific percentages of your total investment capital across different asset classes (e.g., stocks, bonds, real estate, commodities). For example, an investor might aim for a 60% stock / 40% bond allocation, adjusting these percentages based on their risk tolerance and time horizon. Rebalancing a portfolio involves returning it to its target percentage allocations.
- Yields: Dividend yield (dividends per share / stock price) and bond yield (annual interest payment / bond price) are percentage metrics that indicate the income generated by an investment relative to its current market value, providing crucial insights for income-focused investors.
Business Finance: Profit Margins and Sales Growth
In the corporate world, percentages are indispensable for operational analysis, financial reporting, and strategic decision-making.
- Profit Margins: Businesses extensively use various profit margins, all expressed as percentages, to assess their profitability:
- Gross Profit Margin = [(Revenue – Cost of Goods Sold) / Revenue] * 100
- Operating Profit Margin = [(Operating Income / Revenue)] * 100
- Net Profit Margin = [(Net Income / Revenue)] * 100
These metrics indicate how efficiently a company converts sales into profits at different stages of its operations, providing critical insights into pricing strategies, cost control, and overall business health.
- Sales Growth: Tracking sales growth as a percentage year-over-year (YOY) or quarter-over-quarter (QOQ) is vital for assessing market demand, the effectiveness of marketing strategies, and overall business expansion.
- Market Share: Expressed as a percentage, market share (a company’s sales / total industry sales) measures a company’s competitive position within its industry, informing strategic decisions regarding expansion, product development, and competitive pricing.
Leveraging Financial Tools for Percentage Calculations
While understanding the manual calculation is crucial, modern financial tools significantly streamline the process, enhancing both efficiency and accuracy, especially with complex datasets.
Spreadsheets (Excel, Google Sheets) for Complex Calculations
Spreadsheet software like Microsoft Excel or Google Sheets are arguably the most powerful and versatile tools for financial percentage calculations. They allow users to:
- Automate calculations: Input formulas once, and they automatically update as underlying data changes.
- Handle large datasets: Easily calculate percentages across hundreds or thousands of rows of financial transactions, sales figures, or investment portfolios.
- Perform scenario analysis: Quickly see the impact of changing variables (e.g., different interest rates, varying growth percentages) on overall financial outcomes.
- Visualize data: Create charts and graphs that represent percentage data visually, making trends and comparisons more apparent.
Basic formulas like= (A2/B2)*100for percentage, or=(C2-D2)/D2*100for percentage change, become incredibly powerful when applied across entire financial models.
Online Calculators and Mobile Apps
For quick, specific percentage calculations, a plethora of online calculators and mobile apps are readily available. These include:
- Basic Percentage Calculators: For simple “X percent of Y” or “X is what percent of Y” questions.
- Tip Calculators: Automatically calculate tip amounts and split bills.
- Loan Calculators: Determine monthly payments, total interest paid, and amortization schedules based on loan principal, interest rate, and term, all of which are percentage-driven.
- Investment Calculators: Project future investment growth, calculate ROI, or determine compound interest earnings.
These tools are user-friendly and provide instant results, making them ideal for everyday financial decisions or on-the-go analysis.
Understanding Financial Reports and Statements
Publicly traded companies and even many small businesses present their financial health through reports like income statements, balance sheets, and cash flow statements. These documents are replete with percentage data:
- Common-Size Analysis: This technique involves expressing each line item on an income statement or balance sheet as a percentage of a base figure (e.g., total revenue for income statement, total assets for balance sheet). This allows for easy comparison of financial performance across different companies or over different periods, regardless of their absolute size.
- Financial Ratios: Many critical financial ratios (e.g., debt-to-equity ratio, current ratio, quick ratio) are inherently percentage-based or can be interpreted as such, providing insights into liquidity, solvency, and operational efficiency.
Learning to read and interpret these percentage-laden reports is a crucial skill for investors, business owners, and financial analysts alike, enabling them to glean deeper insights into a company’s performance and financial position.
Common Pitfalls and Best Practices
While percentages are invaluable, their misapplication or misinterpretation can lead to significant financial errors. Adopting best practices ensures accuracy and effective understanding.
Avoiding Misinterpretations of Percentage Data
One of the most common errors is confusing percentage points with percentages. A stock that rises from 10% to 12% market share has increased by 2 percentage points, but that represents a 20% percentage increase in its market share (since (12-10)/10 * 100 = 20%). Similarly, consecutive percentage changes are not additive. A 10% increase followed by a 10% decrease does not return you to the original amount (e.g., $100 + 10% = $110; $110 – 10% = $99). Always calculate percentage changes from the new base amount for each step.
Another pitfall is using percentages without understanding the base. A “100% growth” sounds impressive, but if it’s from $10 to $20, it’s less impactful than 10% growth on a $1 million base. Always consider the absolute amounts alongside the percentages for a complete picture.
The Importance of Context in Financial Percentages
Percentages are most insightful when viewed within their appropriate context.
- Timeframe: Is a 5% investment return good? It depends on the timeframe. 5% in one month is excellent; 5% over five years is poor. Always align percentages with their associated periods.
- Industry Benchmarks: A 15% profit margin might be exceptional for a grocery store but abysmal for a software company. Compare financial percentages against industry averages and competitors to gauge true performance.
- Inflation: When evaluating returns or growth, consider the impact of inflation. A 3% investment return in an economy with 3% inflation means your purchasing power hasn’t increased, despite a positive nominal percentage return.

Developing a Proactive Financial Mindset
Beyond mere calculation, developing a proactive financial mindset involves habitually thinking in percentages. When considering a purchase, ask yourself what percentage of your monthly income it represents. When reviewing investment performance, always look at the percentage return, not just the dollar amount. This shift in perspective cultivates a deeper understanding of financial proportionality and impact. It encourages critical thinking about risk, reward, and allocation, moving beyond simple arithmetic to strategic financial planning. By consistently applying percentage analysis to your financial life, you empower yourself to make more robust, insightful, and ultimately, more successful financial decisions.
In conclusion, the ability to calculate amount percentages is an indispensable skill in the realm of finance. It provides a standardized, intuitive method for analyzing financial data, comparing performance, and making informed decisions across personal, investment, and business contexts. By mastering the core formulas, leveraging modern financial tools, and adopting a disciplined approach to interpretation, anyone can transform raw financial figures into actionable insights, paving the way for greater financial clarity and success.
aViewFromTheCave is a participant in the Amazon Services LLC Associates Program, an affiliate advertising program designed to provide a means for sites to earn advertising fees by advertising and linking to Amazon.com. Amazon, the Amazon logo, AmazonSupply, and the AmazonSupply logo are trademarks of Amazon.com, Inc. or its affiliates. As an Amazon Associate we earn affiliate commissions from qualifying purchases.