
Understanding the Basics of Inflation
Inflation is a fundamental economic concept that refers to the rate at which the general level of prices for goods and services is rising, and consequently, the purchasing power of currency is falling. In simpler terms, it means your money buys less today than it did yesterday. This seemingly abstract concept has profound implications for every individual’s personal finance, investment strategies, and for businesses managing their costs and pricing.
The primary reason inflation matters is its direct impact on purchasing power. If your income remains stagnant while prices rise, your real income effectively decreases. This erodes the value of savings, makes future planning more complex, and necessitates careful consideration in budgeting and investment decisions. For investors, understanding inflation is crucial for distinguishing between nominal returns (the stated return) and real returns (the return after accounting for inflation), which dictates the actual growth of their wealth.
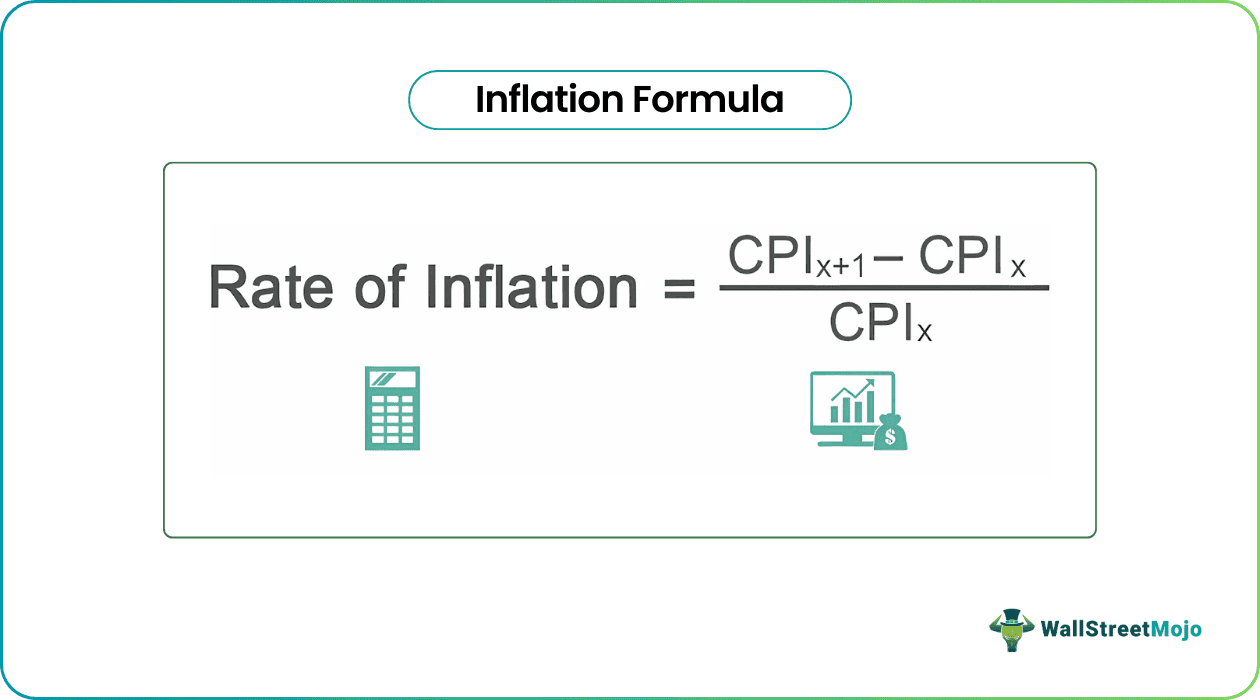
Various types of inflation exist, often driven by different economic forces. Demand-pull inflation occurs when aggregate demand in an economy outpaces aggregate supply, pushing prices upward. Cost-push inflation, conversely, happens when the cost of producing goods and services increases (e.g., due to rising raw material prices or wages), and these higher costs are passed on to consumers. Built-in inflation, also known as wage-price spiral, arises from people’s expectations of future inflation, leading workers to demand higher wages and businesses to raise prices in anticipation. Accurately measuring these changes over time is paramount, and this is typically done through the use of various price indexes.
Key Metrics and Data Sources for Inflation Calculation
Governments and economic institutions worldwide employ sophisticated methods to measure inflation, primarily relying on various price indexes. These indexes track the average change in prices over time for a representative “basket” of goods and services.
The Consumer Price Index (CPI)
The Consumer Price Index (CPI) is arguably the most widely recognized and frequently cited measure of inflation. Produced by national statistical agencies (such as the Bureau of Labor Statistics – BLS in the United States), the CPI measures the average change over time in the prices paid by urban consumers for a market basket of consumer goods and services. This basket is a diverse collection, including food, housing, apparel, transportation, medical care, recreation, education, and communication.
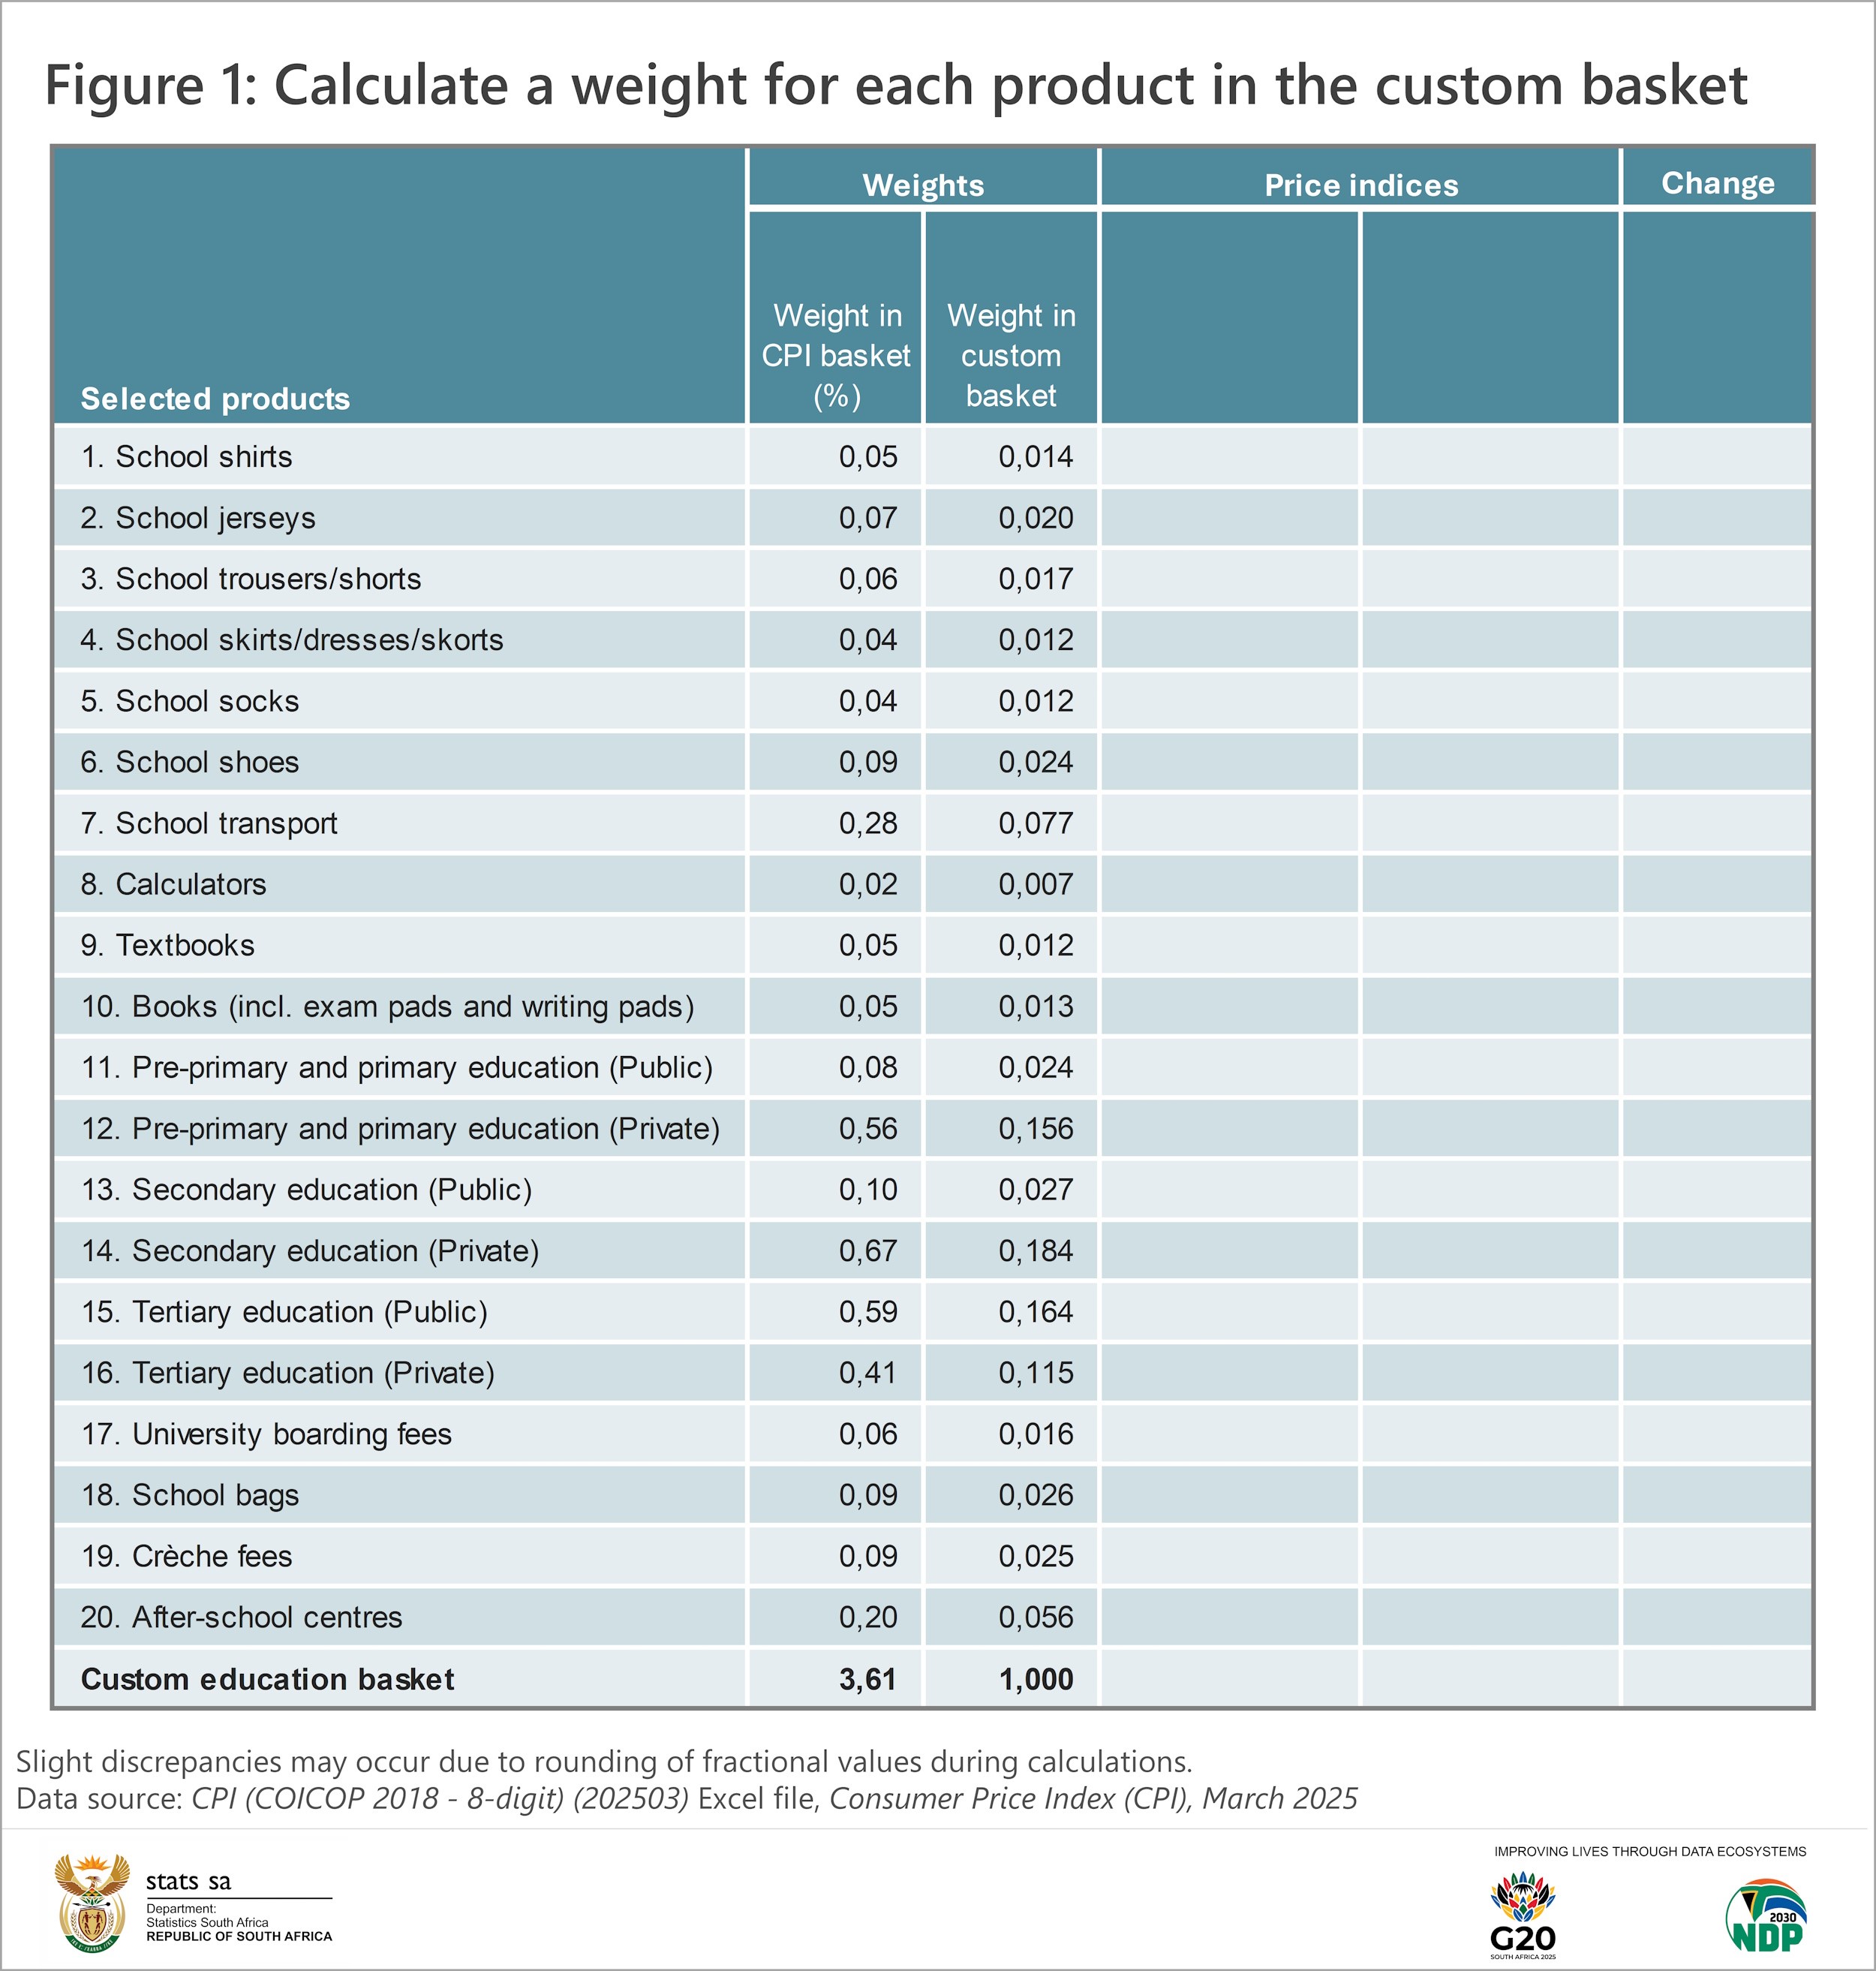
The construction of the CPI involves a detailed process. Statistical agencies conduct ongoing surveys of consumer spending to determine what goods and services typical households purchase and in what proportions. These proportions are then used as “weights” to calculate the average price change. For instance, if housing constitutes a larger portion of household spending than apparel, changes in housing prices will have a greater impact on the overall CPI. Data collectors regularly survey thousands of retail stores, service establishments, rental units, and healthcare providers to obtain price quotes.
While comprehensive, the CPI has certain limitations. One common criticism is the “substitution bias,” where consumers tend to substitute away from goods that have become relatively more expensive towards cheaper alternatives. The fixed-basket approach of the CPI may not fully capture this immediate consumer response. Additionally, difficulties arise in accounting for quality changes (e.g., a car might cost more today, but it also comes with more features and better safety) and new goods entering the market. Despite these, the CPI remains an invaluable tool for tracking inflation, informing monetary policy, and adjusting wages, pensions, and social security benefits. You can access detailed CPI data directly from the BLS website for the U.S., or equivalent national statistical agencies in other countries.
The Producer Price Index (PPI)
Another crucial inflation metric is the Producer Price Index (PPI). Unlike the CPI, which measures price changes from the consumer’s perspective, the PPI tracks the average change over time in the selling prices received by domestic producers for their output. It covers prices from various stages of production, including crude materials, intermediate goods, and finished goods.
The PPI is particularly important because it can act as a leading indicator for consumer inflation. Increases in prices at the producer level often eventually get passed on to consumers in the form of higher retail prices. By monitoring the PPI, economists and policymakers can gain insights into potential future inflationary pressures before they fully manifest at the consumer level.
Personal Consumption Expenditures (PCE) Price Index
The Personal Consumption Expenditures (PCE) Price Index is another key measure of inflation, particularly favored by the U.S. Federal Reserve for its monetary policy decisions. The PCE index is derived from data within the national income and product accounts, covering a broader scope of goods and services than the CPI, including expenditures made on behalf of households by employers or government programs (e.g., medical care provided by employers).
A significant reason for the Fed’s preference for PCE over CPI is that it is a “chain-weighted” index, meaning it accounts for changes in consumer spending patterns and substitutions more readily. If consumers switch from buying a more expensive product to a cheaper substitute, the PCE index’s weighting adjusts more quickly than the CPI’s fixed basket, providing a more accurate reflection of actual consumer spending and inflation. The PCE also covers a wider range of services, which have become an increasingly dominant part of modern economies.
Step-by-Step: Calculating Your Own Inflation Rate (Simplified Approach)
While official indexes provide aggregate data, you might want to understand how inflation specifically impacts your personal finances. Calculating your own personal inflation rate can offer valuable insights.
Identify Your Personal “Basket”
The first step is to identify the major categories of goods and services you regularly spend money on. This will form your personal “basket.” Common categories include:
-
Housing (rent/mortgage, utilities, maintenance)
-
Food (groceries, dining out)
-
Transportation (fuel, public transport, car payments, insurance)
-
Healthcare (insurance premiums, prescriptions, doctor visits)
-
Personal Care (toiletries, haircuts)
-
Clothing and Apparel
-
Education
-
Entertainment and Recreation
-
Miscellaneous (subscriptions, personal care items)
Once you have these categories, estimate the percentage of your monthly or annual income you allocate to each. These percentages will serve as your weights. For instance, if you spend 30% of your income on housing and 15% on food, housing will have twice the weight of food in your personal inflation calculation.
Track Prices Over Time
This is the most challenging but crucial part. For a simplified personal calculation, you don’t need to track thousands of items like statistical agencies do. Instead, focus on specific items or services within your main categories that represent your typical consumption.
-
For food: Track the price of a specific brand of milk, bread, or a common grocery item you frequently buy.
-
For fuel: Note the average price per gallon/liter you pay monthly.
-
For utilities: Keep records of your electricity, gas, and water bills over different periods.
-
For housing: Your rent or mortgage payment is usually stable, but track property taxes or homeowner’s association fees.
-
For services: Note the price of a standard haircut, a gym membership, or a streaming service.

You’ll need at least two data points: the price of an item at an earlier point in time (PriceOld) and its price at a later point in time (PriceNew).
The Simple Inflation Formula
To calculate the inflation rate for a single item, use this formula:
Inflation Rate = ((Price_New - Price_Old) / Price_Old) * 100
Example:
If a gallon of milk cost $3.00 last year (PriceOld) and costs $3.30 today (PriceNew):
Inflation Rate = ((3.30 - 3.00) / 3.00) * 100
Inflation Rate = (0.30 / 3.00) * 100
Inflation Rate = 0.10 * 100
Inflation Rate = 10%
Applying to Your Basket (Weighted Average)
Once you’ve calculated the individual inflation rate for representative items or services within each of your expenditure categories, you can calculate your overall personal inflation rate using the weights you assigned earlier.
-
Calculate the inflation rate for each category: If you have multiple items in a category, you can average their inflation rates, or pick the most representative one.
-
Multiply each category’s inflation rate by its assigned weight. (Remember to use the decimal form of the weight, e.g., 30% as 0.30).
-
Sum these weighted inflation rates to get your personal inflation rate.
Example Table:
| Category | Your Weight (%) | Category Inflation Rate (%) | Weighted Inflation Rate |
| :————- | :————– | :————————– | :———————- |
| Housing | 30% | 5% | 0.30 * 5% = 1.5% |
| Food | 15% | 8% | 0.15 * 8% = 1.2% |
| Transportation | 10% | 12% | 0.10 * 12% = 1.2% |
| Healthcare | 20% | 6% | 0.20 * 6% = 1.2% |
| Other | 25% | 4% | 0.25 * 4% = 1.0% |
| Total | 100% | | Sum = 6.1% |
In this example, your personal inflation rate is 6.1%. This figure may differ significantly from the national average, highlighting how individual spending patterns dictate personal economic experience.
Practical Implications and Using Inflation Data
Understanding how to calculate and interpret inflation data is not merely an academic exercise; it has tangible impacts across personal and business finance.
Impact on Personal Finance
For individuals, knowing the inflation rate helps in several key areas. When planning for retirement, it’s crucial to factor in how much purchasing power your savings will lose over decades due to inflation. This dictates how much you need to save and what real rate of return your investments must achieve to maintain your desired lifestyle. Inflation also informs budgeting; if your living costs are rising faster than your income, you need to adjust your spending or seek ways to increase earnings. For those with significant cash savings, inflation erodes their value, making inflation-protected securities or investing in assets that tend to appreciate with inflation (like real estate or certain commodities) more attractive.
Impact on Investing
Investors must constantly consider inflation to differentiate between nominal and real returns. A 7% nominal return on an investment might sound good, but if inflation is 5%, your real return is only 2%. This significantly alters your wealth accumulation trajectory. Inflation can impact different asset classes uniquely. Fixed-income investments (like bonds) are particularly vulnerable as their fixed coupon payments lose value over time, while equities, real estate, and commodities might offer better inflation hedges under certain conditions. Understanding inflationary trends helps investors allocate capital more effectively to preserve and grow real wealth.
Business Finance Perspective
Businesses utilize inflation data for critical decisions. It influences pricing strategies; companies must balance absorbing rising input costs with passing them on to consumers to maintain profitability without losing market share. Cost management becomes paramount during inflationary periods, necessitating efficiency improvements and strategic sourcing. Inflation also plays a role in wage negotiations, as employees seek pay raises that at least keep pace with the cost of living. For long-term planning, such as capital expenditure decisions or evaluating project viability, businesses must forecast future inflation rates to ensure the real value of future revenues and costs.
Limitations and Nuances in Inflation Measurement
While official and personal inflation calculations offer valuable insights, it’s important to recognize their limitations and nuances.
Firstly, there’s often a disconnect between individual experiences and aggregate national inflation rates. Your personal basket of goods and services might differ substantially from the national average, meaning your cost of living could be rising faster or slower than the reported CPI. For example, if you spend a disproportionately high amount on healthcare, and healthcare costs are surging, your personal inflation rate could be higher than the national average even if other categories are stable.
Secondly, quality adjustments are notoriously difficult to incorporate accurately. A car from 20 years ago costs less than a car today, but the modern vehicle often includes advanced safety features, technology, and fuel efficiency improvements. Is the price increase purely inflation, or partly due to increased quality? Statistical agencies use complex hedonic adjustments to try and account for these improvements, but they are subject to debate.
Substitution bias is another factor. As mentioned with the CPI, if the price of beef rises, consumers might switch to chicken. A fixed-basket index might overstate inflation by assuming consumers continue buying beef at the higher price. Modern indexes like the PCE attempt to mitigate this through chain-weighting.
Finally, geographical variations mean that the cost of living and, consequently, the rate of inflation, can differ significantly from one region or city to another within the same country. What’s true for a metropolitan area might not hold for a rural one. These nuances underscore that while official inflation figures provide a crucial macroeconomic overview, a personalized understanding often offers a more relevant picture for individual financial decision-making.
aViewFromTheCave is a participant in the Amazon Services LLC Associates Program, an affiliate advertising program designed to provide a means for sites to earn advertising fees by advertising and linking to Amazon.com. Amazon, the Amazon logo, AmazonSupply, and the AmazonSupply logo are trademarks of Amazon.com, Inc. or its affiliates. As an Amazon Associate we earn affiliate commissions from qualifying purchases.