
Investing in the stock market is often described as a journey toward long-term wealth, but for many, that journey feels like a roller coaster. The primary source of anxiety for most investors is the “crash”—a sudden, dramatic drop in stock prices that can wipe out years of gains in a matter of days or weeks. While the fear of a crash is ever-present, understanding the historical frequency, the underlying causes, and the statistical probability of these events is essential for anyone looking to build a sustainable investment portfolio. To navigate the financial markets successfully, one must distinguish between routine volatility and the systemic failures that define a true market crash.

Understanding the Cycles of Market Volatility
Before determining how often markets crash, it is necessary to define what constitutes a crash versus other forms of market movement. Volatility is a feature of the market, not a bug. However, the terminology used by financial analysts often confuses casual investors.
Corrections, Bear Markets, and Crashes
A “market correction” is generally defined as a decline of 10% or more from a recent peak. These are remarkably common and are often viewed by institutional investors as healthy “resets” that prevent the market from becoming overvalued. A “bear market” is more severe, characterized by a decline of 20% or more over a period of time, usually accompanied by widespread pessimism and a slowing economy.
A “stock market crash,” however, is a more sudden and visceral event. While there is no single numerical threshold that defines a crash, it is typically characterized by a double-digit percentage drop within a very short window—sometimes just a few hours or days. Crashes are often the catalyst that pushes a market from a correction into a full-blown bear market.
The Psychological Component
The frequency of crashes is often tied to human psychology as much as economic data. Markets are driven by two primary emotions: greed and fear. When greed dominates, asset prices detach from their intrinsic value, creating a bubble. When the bubble bursts, fear takes over, leading to panic selling. This herd mentality accelerates the downward spiral, turning a standard downturn into a crash. Understanding that crashes are often the result of psychological “tipping points” helps investors realize why they are so difficult to predict using math alone.
A Historical Timeline: Examining Past Crashes
History provides the most reliable dataset for understanding how often we should expect the floor to fall out of the market. While the modern financial era is often dated back to the mid-20th century, the patterns of boom and bust have existed for hundreds of years.
The Great Depression (1929)
The most infamous crash in history began in October 1929. The Dow Jones Industrial Average dropped nearly 25% in two days. This wasn’t just a market event; it was the precursor to a decade-long economic catastrophe. It took the market 25 years to return to its pre-1929 highs. This event established the blueprint for modern financial regulation, including the creation of the SEC.
Black Monday (1987)
On October 19, 1987, the Dow Jones plummeted by 22.6% in a single day. Unlike 1929, this crash was not tied to a fundamental economic collapse. Instead, it was fueled by “program trading” (early algorithmic trading) and a lack of liquidity. This event taught the financial world about the dangers of automated selling and led to the implementation of “circuit breakers,” which pause trading if prices drop too rapidly.
The Dot-Com Bubble (2000)
The turn of the millennium saw a massive inflation of tech stocks. Many companies with no revenue but “high potential” reached astronomical valuations. When the bubble burst in early 2000, the Nasdaq Composite lost nearly 77% of its value over the next two years. This was a slow-motion crash that decimated a specific sector before dragging down the broader market.
The Great Recession (2008)
Triggered by the collapse of the subprime mortgage market and the subsequent failure of Lehman Brothers, the 2008 financial crisis saw the S&P 500 lose approximately 50% of its value from peak to trough. This crash was systemic, threatening the very foundations of the global banking system and requiring unprecedented government intervention.
The COVID-19 Flash Crash (2020)
In March 2020, the onset of the global pandemic triggered the fastest bear market in history. The S&P 500 dropped 30% in just 22 days. However, unlike previous crashes, the recovery was equally swift, fueled by massive fiscal stimulus and a rapid shift toward a digital economy.
The Mechanics of a Crash: What Triggers the Descent?
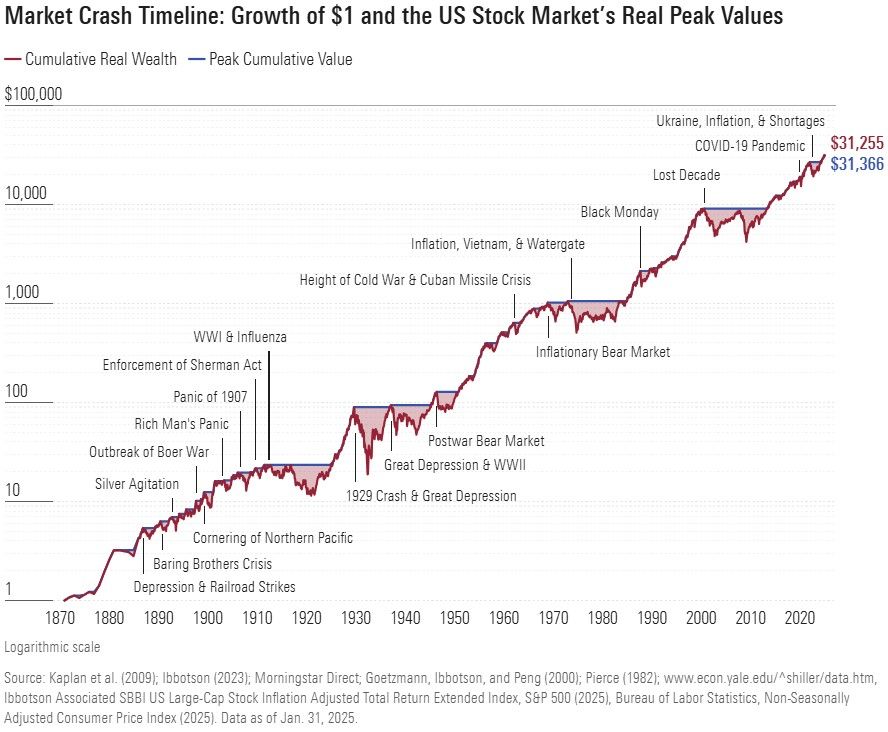
Market crashes rarely happen in a vacuum. They are typically the result of a “perfect storm” of economic, geopolitical, and technical factors. By identifying these triggers, investors can better understand the environment that precedes a crash.
Speculative Bubbles and Overvaluation
The most common precursor to a crash is an “expensive” market. When the Price-to-Earnings (P/E) ratios of stocks reach historical highs, the market becomes fragile. Any negative news can act as a pin to the bubble. Whether it is tulips in the 1600s or internet startups in the 1990s, when prices are driven by speculation rather than earnings, a crash is almost inevitable.
Monetary Policy and Interest Rates
The Federal Reserve and other central banks play a pivotal role in market stability. When interest rates are low, “easy money” flows into stocks, driving up prices. If the Fed raises rates too quickly to combat inflation, borrowing becomes expensive, corporate profits shrink, and investors move their money from risky stocks to safer bonds. Many historical crashes have been preceded by a rapid tightening of monetary policy.
Black Swan Events
Coined by Nassim Nicholas Taleb, a “Black Swan” is an unpredictable event that has a massive impact. The 9/11 attacks, the 2020 pandemic, or a sudden geopolitical conflict are examples. These events cause “shocks” to the system that traditional financial models cannot account for, leading to immediate and severe price drops as the market attempts to price in a new, uncertain reality.
Frequency Statistics: Calculating the Odds
If we look at the S&P 500 from its inception, we can begin to see a statistical rhythm to market declines. While past performance is not a guarantee of future results, the averages are illuminating for long-term planning.
The Law of Averages
On average, a market correction (10% drop) occurs about once a year. A bear market (20% drop) occurs roughly every seven years. A true “crash” (a sudden drop of 20% or more in a very short period) is rarer, occurring perhaps once every 10 to 15 years.
Since 1928, there have been approximately 27 bear markets. Given that this spans nearly a century, the math suggests that an investor should expect to live through several significant market collapses during their lifetime. If you have a 40-year investment horizon, you will likely encounter at least four or five major market downturns.
The Duration of Recovery
What matters more than the frequency of the crash is the duration of the recovery. Historically, the average bear market lasts about 289 days, or roughly 10 months. The recovery time to return to previous highs varies wildly—from a few months in 2020 to several years following 2008. The key takeaway is that every single crash in the history of the U.S. stock market has eventually been followed by a new all-time high. The frequency of crashes is offset by the fact that the market spends significantly more time in an upward trend than a downward one.
Investment Strategies for High-Volatility Environments
Knowing that a crash is statistically inevitable at some point in your investing career, the goal should not be to avoid the crash—which is nearly impossible to time—but to survive it.
Asset Allocation and Diversification
The most effective defense against a market crash is a well-diversified portfolio. Not all asset classes move in tandem. While stocks may crash, high-quality bonds, gold, or real estate may hold their value or even appreciate. By spreading risk across different sectors and geographies, an investor reduces the impact of a crash in any single area.
The Power of Dollar-Cost Averaging
For the disciplined investor, a market crash is actually an opportunity. Through dollar-cost averaging—investing a fixed amount of money at regular intervals regardless of price—you naturally buy more shares when prices are low and fewer when prices are high. This strategy removes the emotional burden of trying to “time the bottom” and turns market volatility into a mechanism for lowering your average cost per share.
Maintaining an Emergency Fund
The reason most people lose money during a crash is that they are forced to sell their investments at the bottom to cover living expenses. By maintaining a robust emergency fund (3–6 months of expenses in a liquid savings account), you ensure that you never have to liquidate your portfolio during a downturn. This allows you to wait for the eventual recovery, keeping your long-term wealth strategy intact.

Emotional Discipline and the Long View
The stock market is a device for transferring money from the impatient to the patient. When a crash occurs, the media cycle often intensifies the sense of doom, leading many to panic and exit the market. However, historical data shows that the best days in the market often follow the worst days. If an investor misses just the ten best days of the market over a 20-year period, their total returns can be cut in half. Staying invested through the crash is often the most difficult, yet most rewarding, financial decision one can make.
aViewFromTheCave is a participant in the Amazon Services LLC Associates Program, an affiliate advertising program designed to provide a means for sites to earn advertising fees by advertising and linking to Amazon.com. Amazon, the Amazon logo, AmazonSupply, and the AmazonSupply logo are trademarks of Amazon.com, Inc. or its affiliates. As an Amazon Associate we earn affiliate commissions from qualifying purchases.