The sheer scale of the global financial system is often difficult to comprehend. When we discuss the “stock market,” we are not referring to a single entity, but a vast, interconnected web of exchanges, trillions of data points, and the collective valuation of thousands of corporations worldwide. For the individual investor, understanding how much money is in the stock market is more than a curiosity; it is a fundamental lesson in global economics, liquidity, and the distribution of wealth.
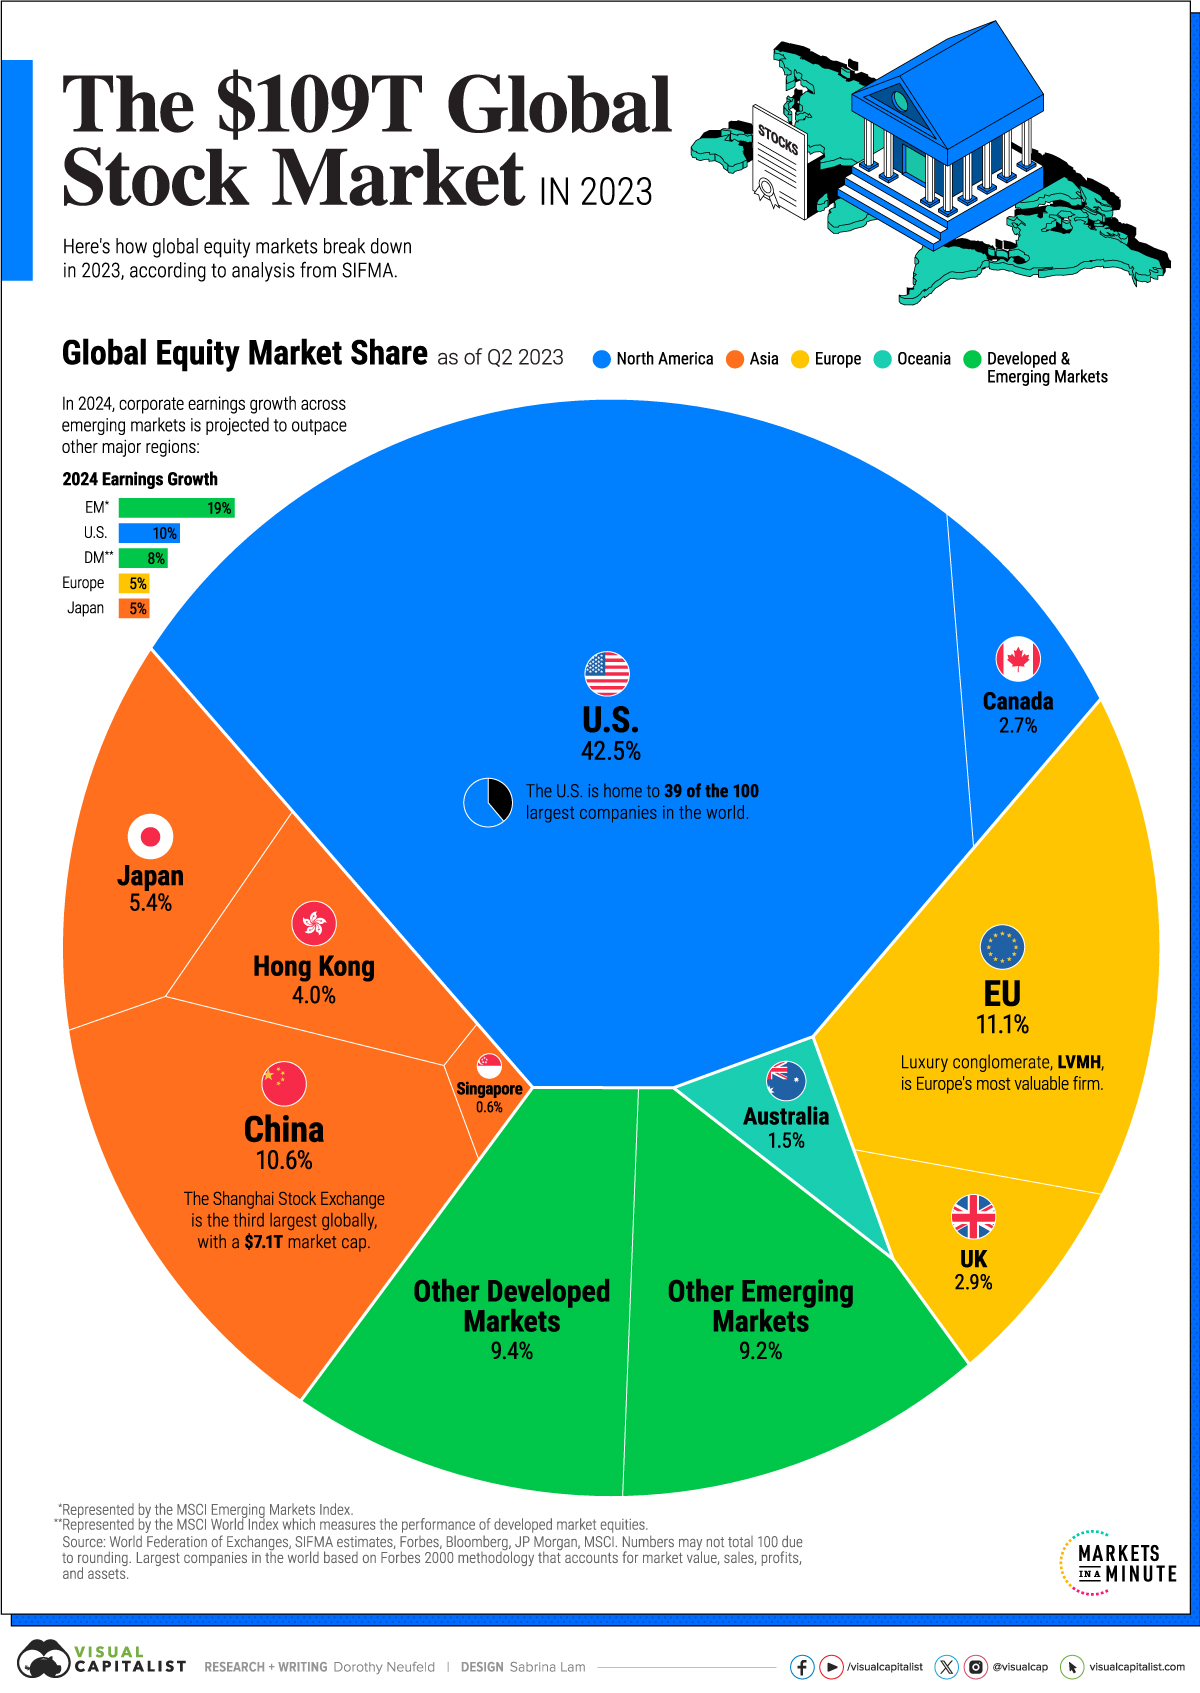
As of the current fiscal landscape, the total value of all publicly traded companies globally fluctuates between $100 trillion and $120 trillion. However, this number is a moving target, influenced by daily trading volumes, geopolitical shifts, and the underlying health of the world’s major economies.

Defining the Scope: The Concept of Global Market Capitalization
To answer how much money is in the stock market, we must first define “Market Capitalization.” This is the primary metric used to determine the size of a company or an entire exchange. It is calculated by multiplying the total number of a company’s outstanding shares by the current market price of one share. When we aggregate these figures across every public company in the world, we arrive at the global market cap.
What is Market Cap and Why Does it Shift?
Market capitalization is the “sticker price” of the corporate world. It represents the public’s perception of a company’s current worth and future potential. Because share prices change every second, the “total money” in the stock market is never a static figure. For instance, a major sell-off in the technology sector can erase trillions of dollars in perceived wealth within a few days, even if the physical assets of those companies—their buildings, patents, and products—remain unchanged.
The Current Global Valuation
While the figure sits near the $110 trillion mark today, it is important to place this in a historical context. At the turn of the millennium, the global market cap was significantly lower. The explosion of the digital economy, coupled with the expansion of emerging markets in Asia and South America, has led to an exponential increase in total market value over the last two decades. This growth reflects both the genuine expansion of global productivity and the inflationary pressures that drive asset prices higher.
Regional Dominance: Where the Capital is Concentrated
The distribution of wealth in the stock market is remarkably top-heavy. While there are over 60 major stock exchanges worldwide, a handful of them command the vast majority of the world’s capital. Understanding where this money lives is crucial for understanding global economic influence.
The United States: The Global Financial Hub
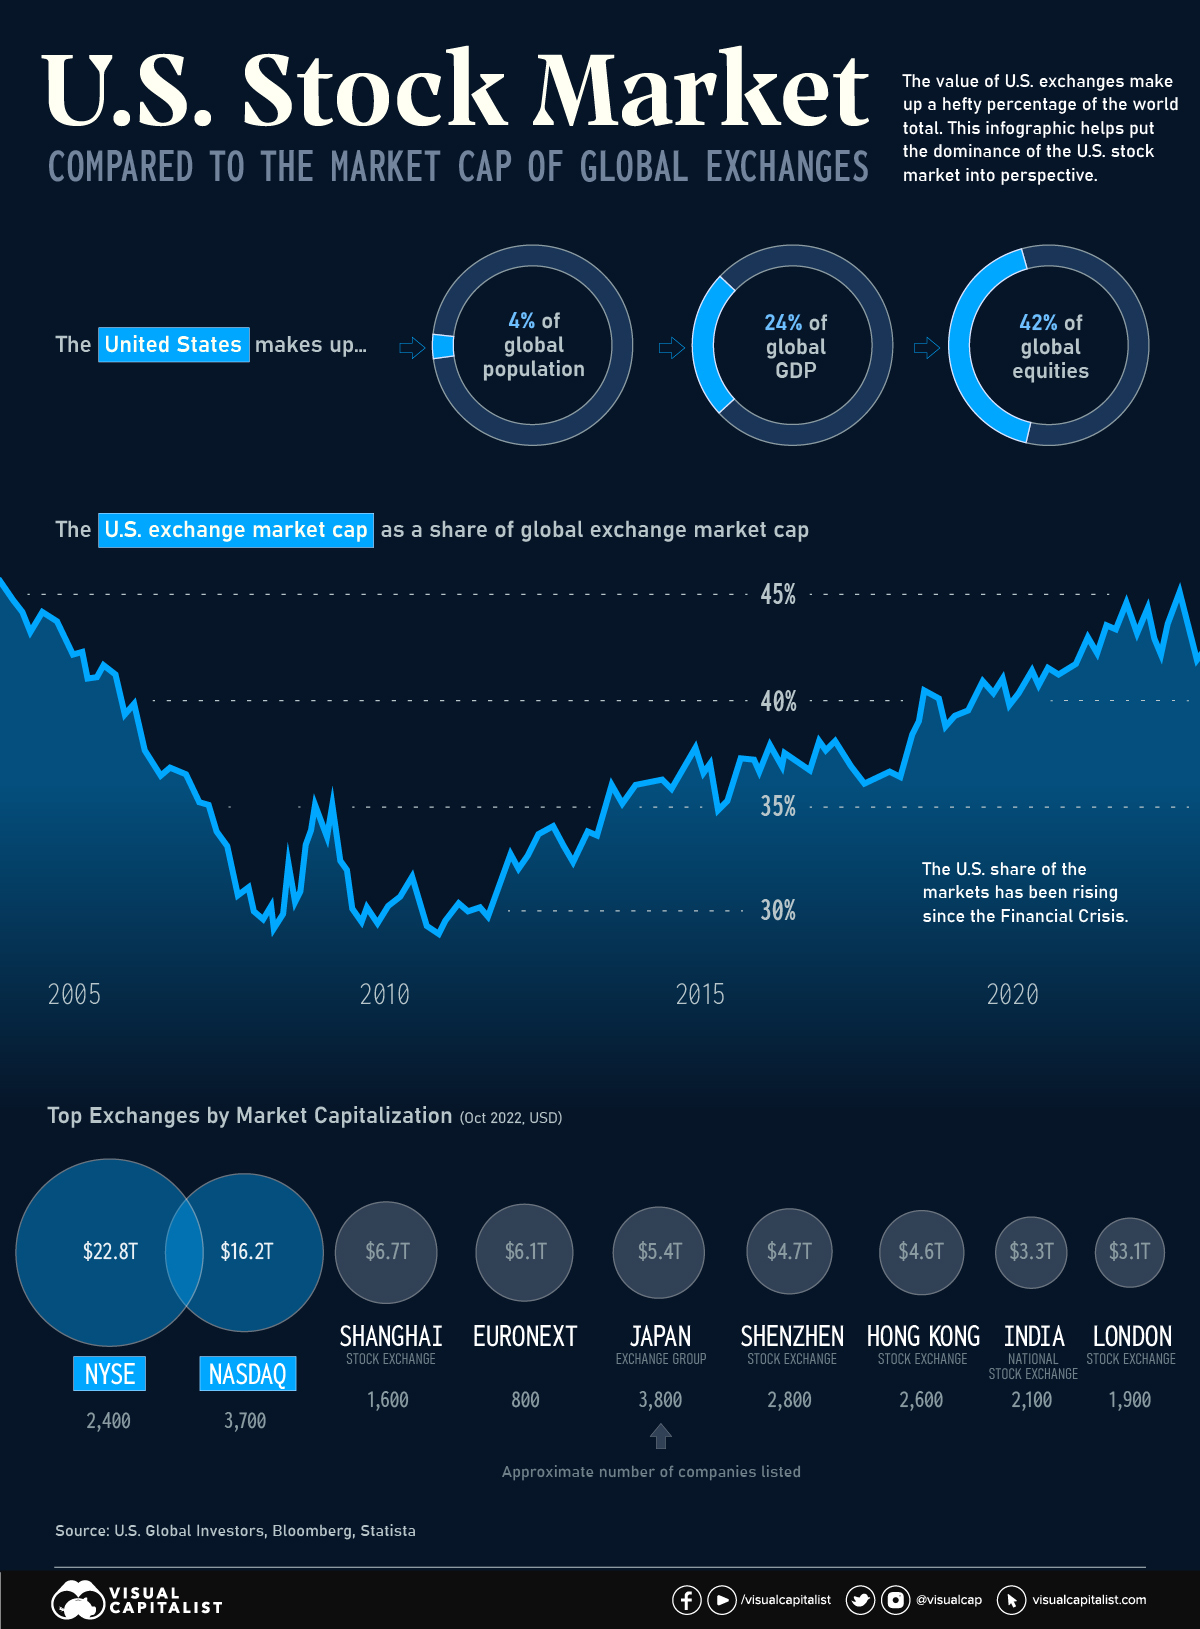
The United States remains the undisputed leader in equity markets. The New York Stock Exchange (NYSE) and the NASDAQ are the two largest exchanges in the world. Together, they represent nearly 40% to 45% of the entire global stock market value. This dominance is driven by the presence of “mega-cap” companies—trillion-dollar entities like Apple, Microsoft, Amazon, and Alphabet. The concentration of capital in the U.S. is so significant that the performance of the S&P 500 index is often used as a proxy for the health of the entire global financial system.
Emerging Markets and the Rise of Asia
While the U.S. holds the lion’s share, the landscape is shifting toward the East. The Shanghai Stock Exchange, the Shenzhen Stock Exchange, and the Hong Kong Stock Exchange have grown into behemoths. Together with the Japan Exchange Group (Tokyo), the Asian markets represent a massive portion of global liquidity. As China and India continue to industrialize and modernize their financial regulations, we can expect a larger percentage of the “world’s money” to flow into these regions, challenging Western dominance.
The European Landscape
Europe’s markets, led by the Euronext, the London Stock Exchange, and the Deutsche Börse, represent a more mature but slower-growing segment of the global market. European markets are often characterized by legacy industries—banking, automotive, and luxury goods—rather than the high-growth tech sectors that have propelled the U.S. and Chinese markets to new heights.
The Mechanics of Growth: Why the Numbers Keep Changing
The total amount of money in the stock market is not a “closed loop.” It is an open system where capital is constantly being created, destroyed, and redistributed. Several key economic drivers dictate whether the total value of the market expands or contracts.
The Role of Initial Public Offerings (IPOs)
New money enters the stock market through Initial Public Offerings (IPOs) and Direct Listings. When a private company decided to “go public,” it creates new shares that are sold to investors. This process effectively “creates” market value out of thin air by assigning a public price to a previously private entity. High-profile IPOs can add hundreds of billions of dollars to the total market cap in a single fiscal year.
Inflation and Asset Bubbles
Inflation plays a paradoxical role in stock market valuation. As the purchasing power of currency decreases, investors often flee to “harder” assets like equities to preserve their wealth. This increased demand drives up stock prices, increasing the total market cap. However, if prices rise too quickly without a corresponding increase in corporate earnings, an “asset bubble” forms. When these bubbles burst—as seen in the 2000 Dot-com crash or the 2008 financial crisis—trillions of dollars in market value can vanish almost instantly.
Corporate Earnings and Reinvestment
Ultimately, the value of the stock market is underpinned by profitability. When companies report record earnings, they often reinvest that capital into research and development or return it to shareholders via dividends and buybacks. This creates a cycle of growth that sustains higher valuations. If the global economy enters a recession and earnings fall, the “money” in the market shrinks as investors recalibrate what they are willing to pay for a slice of future profits.
Beyond the Visible Surface: Derivatives and Private Markets
To truly understand how much money is “in the market,” one must look beyond the standard stock exchanges. There are layers of financial instruments that dwarf the actual value of the stocks themselves.
The Massive World of Derivatives
While the global stock market is valued at roughly $110 trillion, the “notional value” of the derivatives market is estimated to be anywhere from $600 trillion to over $1 quadrillion. Derivatives are financial contracts—such as options, futures, and swaps—that derive their value from an underlying asset (like a stock). While this is not “money in the market” in the sense of equity ownership, it represents a staggering amount of leveraged capital that influences market volatility and systemic risk.
Private Equity and Venture Capital
Not all “company money” is in the public stock market. Private equity and venture capital represent trillions of dollars in value held in companies that are not yet listed on an exchange. Firms like SpaceX or ByteDance (TikTok) are worth hundreds of billions of dollars but are not included in the “global market cap” figures. When these companies eventually go public, they represent a massive injection of value into the visible stock market.
Why These Numbers Matter to the Individual Investor
For the average person, a figure like $110 trillion is an abstraction. However, the scale of the stock market has direct implications for personal finance, retirement planning, and wealth building.
Understanding Liquidity and Accessibility
The enormous amount of money in the stock market ensures “liquidity.” Because there is so much capital moving through the system, an individual investor can buy or sell shares of a major company almost instantaneously. This liquidity is what makes the stock market one of the most effective tools for building wealth compared to less liquid assets like real estate or fine art.
Diversification in a Trillion-Dollar World
The sheer size of the market provides the opportunity for diversification. With over $100 trillion spread across different sectors, countries, and asset classes, investors can protect themselves against localized economic downturns. By investing in total market index funds, an individual can essentially “own” a tiny slice of the entire global economy, benefiting from the long-term upward trajectory of human innovation and productivity.
Conclusion
The question of “how much money is in the stock market” reveals a picture of a world that is more interconnected and wealthier than ever before. While the $110 trillion figure is subject to the whims of the economy and investor sentiment, it represents the collective output and future aspirations of the global workforce. For the savvy investor, this massive pool of capital is not just a statistic; it is a landscape of opportunity that, when navigated with discipline, provides the most robust path to long-term financial freedom.
aViewFromTheCave is a participant in the Amazon Services LLC Associates Program, an affiliate advertising program designed to provide a means for sites to earn advertising fees by advertising and linking to Amazon.com. Amazon, the Amazon logo, AmazonSupply, and the AmazonSupply logo are trademarks of Amazon.com, Inc. or its affiliates. As an Amazon Associate we earn affiliate commissions from qualifying purchases.