
The question “how much is the Dow?” is far more nuanced than it appears. It’s not a simple commodity price, nor is it a single stock valuation. Instead, the Dow refers to the Dow Jones Industrial Average (DJIA), one of the most widely recognized and frequently quoted stock market indices in the world. Its numerical value, which fluctuates throughout trading days, represents a benchmark that financial professionals, economists, and everyday investors closely monitor. Understanding “how much” the Dow is at any given moment requires delving into its history, its composition, and its profound role as a barometer of both corporate America’s health and the broader economic landscape. For anyone navigating the complexities of personal finance, investing, or simply trying to make sense of daily financial headlines, a clear grasp of the Dow is indispensable.
Deconstructing the Dow Jones Industrial Average (DJIA)
To truly answer the question of “how much” the Dow is, one must first understand what it fundamentally represents. It is not merely a number, but a meticulously calculated average of the stock prices of 30 significant, publicly traded companies in the United States. Its story begins over a century ago, and its evolution mirrors the journey of American industry itself.
What is the Dow? A Historical Perspective
The Dow Jones Industrial Average was created in 1896 by Charles Dow, a co-founder of Dow Jones & Company and The Wall Street Journal. Initially, it consisted of just 12 industrial companies, primarily railroads, sugar, and leather businesses—the titans of their era. Its purpose was to provide a clear, concise measure of the health of the U.S. stock market and, by extension, the broader economy. Over time, as the American economy diversified and evolved, so too did the Dow’s components, growing to 30 companies in 1928. While it still bears the “Industrial” moniker, its constituents today represent a diverse cross-section of sectors, including technology, healthcare, finance, and consumer goods, reflecting the modern economic landscape. This historical context is crucial because it highlights the Dow’s enduring legacy as a reflection of the nation’s most influential corporations.
The “Average” Explained: More Than Just a Price
The core of the “how much” question lies in understanding that the Dow’s value is not a dollar amount you can invest in directly, like buying a share of Apple or Microsoft. Instead, it’s a price-weighted average. This means that companies with higher stock prices have a greater impact on the index’s total value and movements than companies with lower stock prices, regardless of their market capitalization. This method contrasts with market-cap-weighted indices like the S&P 500, where larger companies (by total market value) exert more influence.
To calculate the DJIA, the sum of the prices of its 30 component stocks is divided by a special divisor. This divisor is adjusted for stock splits, spin-offs, and other structural changes to the index to ensure that historical comparisons remain accurate and that the index’s value isn’t artificially inflated or deflated by these events. For instance, if a component company undergoes a stock split, its price drops, but the divisor is adjusted downwards to prevent a sudden drop in the overall index value that doesn’t reflect actual market sentiment. This complex calculation ensures the Dow remains a continuous, comparable measure over time.
The Blue-Chip Components: Who’s In, Who’s Out?
The 30 companies that comprise the DJIA are often referred to as “blue chips”—established, financially sound companies with a long history of stable earnings and reliable dividends. The selection of these companies is not arbitrary. A committee from S&P Dow Jones Indices makes the decisions, looking for companies with an excellent reputation, sustained growth, and interest to a large number of investors. They aim to reflect the overall health and diversity of the U.S. economy, often replacing older companies with new ones that better represent emerging industries or dominant economic forces. For example, historically significant companies like General Electric have been removed and replaced by giants like Salesforce or Apple, illustrating the dynamic nature of the index and its continuous effort to remain relevant. These shifts are important because changes in the Dow’s composition directly impact its numerical value and the sectors it emphasizes.
Why “How Much” Matters: The Dow as an Economic Barometer
Beyond its numerical value, the Dow serves a critical function as a financial barometer. Its daily fluctuations and long-term trends offer insights into market sentiment, corporate profitability, and the broader economic outlook. For investors and policymakers alike, understanding “how much” the Dow is doing is a shorthand for gauging the nation’s financial pulse.
Gauging Market Sentiment and Health
When the Dow rises, it generally indicates that investors are optimistic about the future earnings and prospects of major U.S. corporations, leading to increased buying activity. Conversely, a falling Dow often signals investor pessimism, perhaps due to concerns over economic growth, inflation, interest rates, or geopolitical events. It provides an immediate, albeit sometimes simplistic, snapshot of market health. A consistently rising Dow often correlates with periods of economic expansion and stability, while sustained declines can precede or coincide with recessions. While it’s not the only indicator, its prominence makes it a primary measure for the public to interpret the stock market’s direction.
Impact on Investor Psychology and Consumer Confidence
The Dow’s performance has a tangible psychological effect. A strong Dow can bolster consumer confidence, making people feel wealthier (due to their retirement accounts or investment portfolios increasing in value) and more willing to spend. This “wealth effect” can stimulate economic activity. Conversely, a significant drop in the Dow can trigger fear and uncertainty, leading consumers to save more and spend less, potentially slowing economic growth. For individual investors, the Dow’s movements often influence their perception of their own portfolios, even if they don’t directly own all 30 Dow stocks. It acts as a benchmark against which many will implicitly measure their own investment success or failure.
Policy Implications and Economic Analysis
Government officials and central bankers closely monitor the Dow as part of their broader economic analysis. Significant or prolonged movements in the index can influence monetary policy decisions, such as interest rate adjustments, or fiscal policies aimed at stimulating or stabilizing the economy. For instance, a sharp decline in the Dow might prompt discussions about measures to restore confidence or inject liquidity into the financial system. Economists use the Dow’s performance, alongside other indicators like GDP growth, employment figures, and inflation rates, to forecast economic trends and assess the effectiveness of current policies. Its movements are often discussed in conjunction with unemployment rates, housing starts, and manufacturing data to paint a comprehensive picture of economic health.
Tracking and Interpreting the Dow’s Movements
For anyone invested in financial markets, or even just interested in the economy, knowing “how much” the Dow is at any given moment, and understanding what those numbers imply, is crucial. Thankfully, tracking its movements is easier than ever, though interpretation requires a nuanced approach.
Real-Time Data Sources and Financial Tools
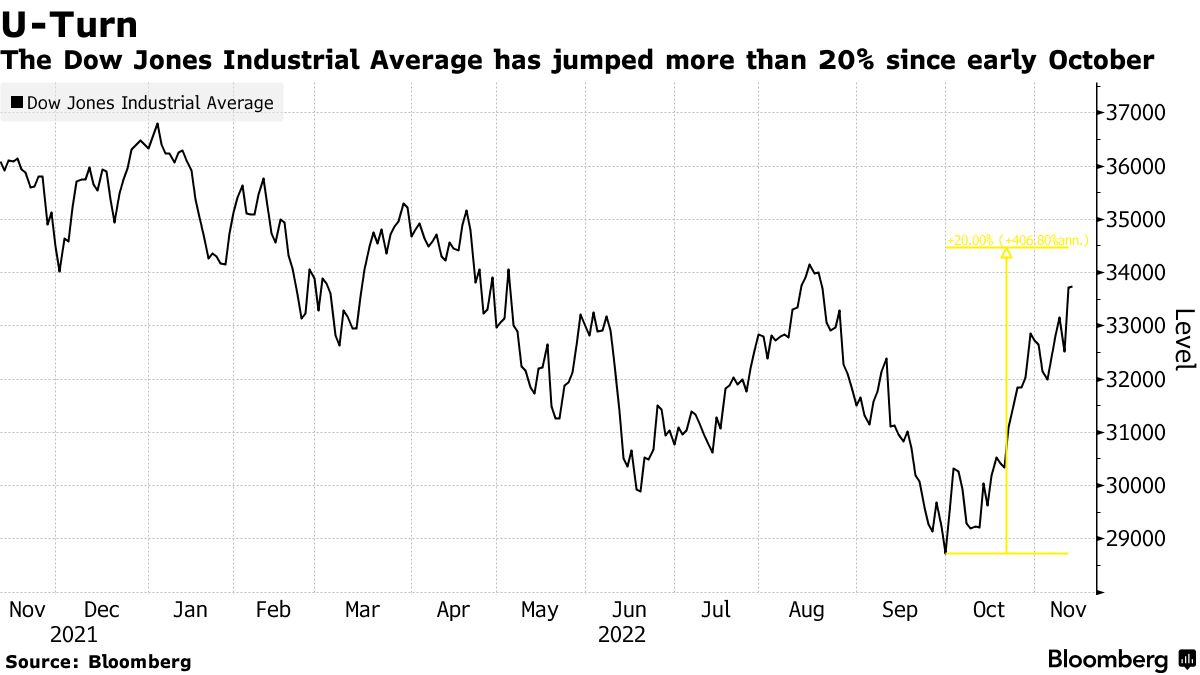
Accessing the Dow’s current value is remarkably simple in the digital age. Financial news websites (e.g., Bloomberg, Reuters, The Wall Street Journal, CNBC), stock market apps (e.g., Google Finance, Yahoo Finance, Robinhood, E*TRADE), and brokerage platforms provide real-time or near real-time updates. These platforms typically display the Dow’s current point value, its change from the previous day’s close (both in points and percentage), and often provide interactive charts to visualize its performance over various timeframes (daily, weekly, monthly, annually, or historically). Many also offer news feeds and analytical tools specific to the Dow and its components, allowing users to delve deeper into the factors driving its movements.
Understanding Volatility and Trends
The Dow is inherently volatile; its value can swing significantly within a single trading day, week, or month. These fluctuations are influenced by a multitude of factors: corporate earnings reports, economic data releases (like inflation or jobs numbers), interest rate announcements by the Federal Reserve, geopolitical events, technological advancements, and even market speculation. When interpreting “how much” the Dow is, it’s more insightful to look at trends rather than focusing solely on daily point changes. Is the Dow trending upwards over weeks or months, indicating a bull market? Or is it trending downwards, signaling a bear market or a correction? Understanding these broader trends helps investors make informed decisions and avoids overreacting to short-term noise. Analyzing daily movements in percentage terms can also provide a more accurate picture than raw point changes, as a 100-point move means less when the Dow is at 35,000 than when it was at 10,000.
Common Misconceptions and Limitations
Despite its popularity, the Dow has several limitations that are important to acknowledge. Firstly, as a price-weighted index, it gives undue influence to companies with higher stock prices, regardless of their actual market capitalization. This means a $1 change in a $300 stock has the same impact as a $1 change in a $30 stock, even if the $30 stock belongs to a much larger company. Secondly, with only 30 companies, it’s not a truly comprehensive representation of the entire U.S. stock market. It excludes thousands of other publicly traded companies, particularly smaller and mid-cap firms, and emerging sectors that are not yet large enough to be “blue chips.” Therefore, while a useful indicator, it should not be the sole basis for market analysis or investment decisions. Investors should also consider broader indices like the S&P 500 (which tracks 500 large-cap companies and is market-cap weighted) or the Nasdaq Composite (which is heavily weighted towards technology stocks) for a more complete market picture.
Investing in the Dow: Opportunities and Considerations
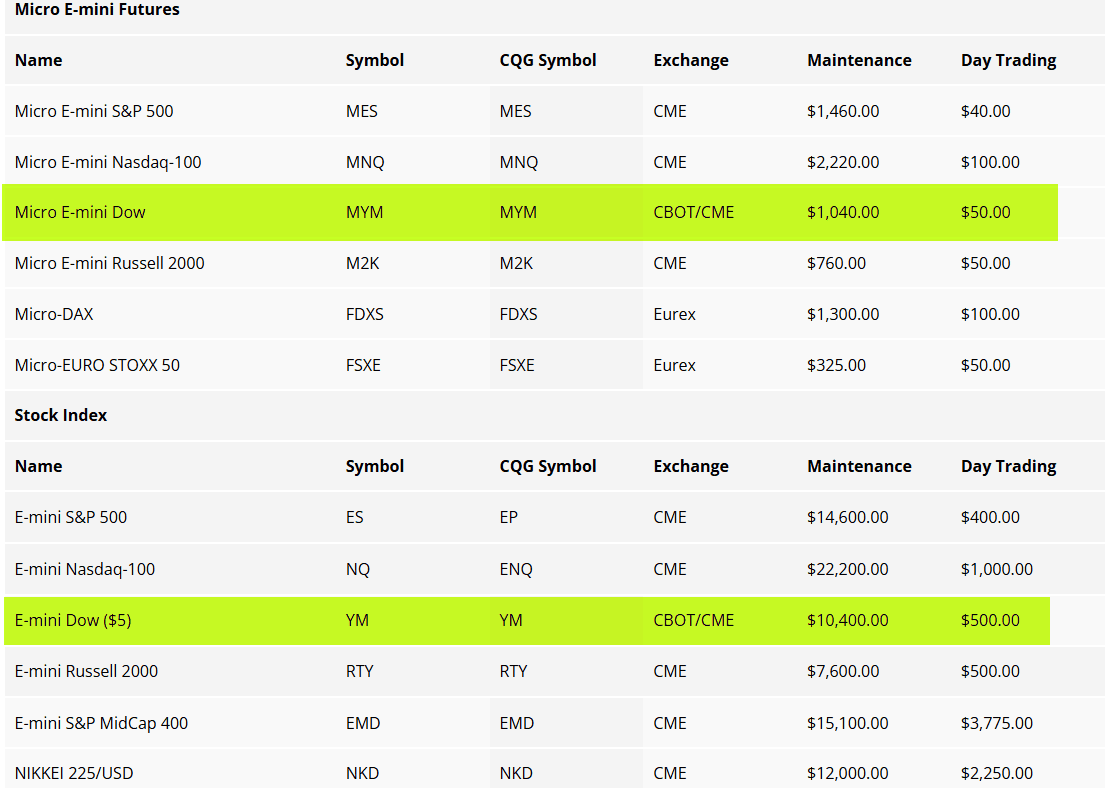
While you cannot directly buy “the Dow” as a single asset, investors can gain exposure to its performance through various financial instruments. Understanding these options is key to leveraging the Dow’s movements within a broader investment strategy.
Indirect Exposure: ETFs and Index Funds
The most common way for individual investors to “invest in the Dow” is through exchange-traded funds (ETFs) or mutual funds that track the DJIA. These funds hold shares of all 30 component companies in proportions designed to mirror the index’s performance. For example, the SPDR Dow Jones Industrial Average ETF (DIA), often referred to as “Diamonds,” is a popular option. By investing in such a fund, you gain diversified exposure to the blue-chip companies without having to buy 30 individual stocks. These funds offer convenience, lower transaction costs (compared to buying individual stocks), and instant diversification among the Dow’s constituents. They allow investors to participate in the general uplift of the U.S. industrial giants, making them attractive for long-term growth.
Diversification and Long-Term Strategy
Investing in a Dow-tracking fund can be a valuable component of a diversified portfolio, but it should rarely be the sole investment. While the Dow’s 30 companies are diversified across various sectors, they still represent only a segment of the market. A well-diversified portfolio should ideally include exposure to a broader range of asset classes (e.g., bonds, real estate, international stocks), market capitalizations (small-cap, mid-cap), and investment styles. A long-term strategy, rather than attempting to time the market based on daily Dow fluctuations, is generally recommended. Historically, the Dow has demonstrated significant long-term growth, riding out numerous economic cycles and market corrections. Patience and a consistent investment approach, often through dollar-cost averaging, tend to yield the best results.
The Dow’s Role in a Broader Investment Portfolio
For many investors, the Dow serves as a core allocation to large-cap U.S. equities. It offers exposure to established companies that often have stable revenue streams and a track record of weathering economic storms. It can provide a foundational layer to a portfolio, offering a degree of stability compared to more volatile growth-oriented investments. For those focused on income, some Dow components are also known for consistent dividend payments, which can be a key part of an overall return strategy. Understanding “how much” the Dow is doing provides context for how a significant portion of a U.S. equity allocation might be performing, but it should always be considered within the larger framework of a personalized financial plan that aligns with individual risk tolerance and financial goals.
The Future of the Dow: Relevance in a Modern Market
The Dow Jones Industrial Average has been a cornerstone of financial reporting for over a century, yet the financial markets of today are vastly different from those of 1896, or even 1996. Its continued relevance and adaptation are key considerations for its future role.
Evolving Market Dynamics and Index Evolution
The global economy is constantly evolving, driven by rapid technological advancements, new business models, and shifting consumer preferences. For the Dow to remain a meaningful indicator, its composition must continue to adapt. The committee responsible for its selection regularly reviews and adjusts its constituents, removing companies that no longer represent leading sectors or economic influence, and adding new ones that do. This dynamic process ensures the index remains a relevant reflection of the dominant forces in American industry. As sectors like artificial intelligence, renewable energy, and biotech grow in prominence, we can expect to see the Dow continue to evolve, integrating companies that embody these future-forward industries. This ongoing evolution is critical to maintaining its stature as a key economic barometer.
Comparing the Dow to Other Major Indices
While the Dow holds historical significance and broad public recognition, it’s essential to compare its utility to other major indices. The S&P 500, with its 500 companies and market-capitalization weighting, is generally considered a more comprehensive and accurate representation of the broader U.S. stock market. The Nasdaq Composite, heavily weighted towards technology and growth stocks, offers a different perspective on innovation-driven sectors. For global economic insights, indices like the MSCI World Index provide international context. Understanding “how much” the Dow is doing is vital, but always in conjunction with these other indices, which collectively provide a more holistic view of market performance and economic health. No single index tells the whole story, and a diverse set of benchmarks is necessary for informed analysis.

The Enduring Legacy of an Industrial Icon
Despite its limitations and the rise of more comprehensive indices, the Dow Jones Industrial Average maintains an enduring legacy. Its sheer historical depth provides an unparalleled record of market performance over more than a century, offering invaluable context for economic cycles, technological shifts, and societal changes. It remains the most cited index in popular media, making it a critical bridge between complex financial markets and the general public. As a simple, accessible measure of the “blue-chip” health of the U.S. economy, the Dow continues to influence investor sentiment, inform economic policy, and provide a quick answer to the perennial question: “how much is the Dow?” Its value extends beyond its raw numerical points, embodying a continuous narrative of American enterprise and financial progress.
In conclusion, “how much is the Dow” is a question that opens the door to understanding a fundamental pillar of global finance. It’s not a simple number, but a dynamic, historically rich indicator that reflects the pulse of corporate America and the broader economy. For anyone navigating the world of money, grasping the intricacies of the Dow—its components, its calculation, its impact, and its limitations—is a crucial step towards financial literacy and informed decision-making.
aViewFromTheCave is a participant in the Amazon Services LLC Associates Program, an affiliate advertising program designed to provide a means for sites to earn advertising fees by advertising and linking to Amazon.com. Amazon, the Amazon logo, AmazonSupply, and the AmazonSupply logo are trademarks of Amazon.com, Inc. or its affiliates. As an Amazon Associate we earn affiliate commissions from qualifying purchases.