
The question of how much the Dow Jones Industrial Average (DJIA) is down on any given day is often the first query investors pose when they sense a shift in the economic climate. In the world of high-stakes finance, the “Dow” serves as more than just a numerical value; it is a psychological benchmark, a pulse check on the American corporate landscape, and a primary driver of investor sentiment. While the specific number fluctuates by the minute during trading hours, understanding the implications of a downward trend is essential for anyone looking to preserve and grow their wealth in an increasingly complex global economy.

To truly answer the question of a daily decline, one must look beyond the immediate red numbers on a ticker screen and analyze the structural, economic, and psychological forces that move thirty of the most influential companies in the United States.
The Mechanics of the Dow: Why the Numbers Move
The Dow Jones Industrial Average is a price-weighted index, a characteristic that distinguishes it from other major benchmarks like the S&P 500 or the Nasdaq Composite, which are market-capitalization-weighted. Because the Dow is price-weighted, companies with higher share prices exert a greater influence on the index’s movement than those with lower share prices, regardless of the company’s actual total market value.
The Influence of Blue-Chip Giants
The 30 companies that comprise the Dow are often referred to as “blue chips.” These are established, financially sound, and industry-leading corporations such as Apple, Microsoft, Goldman Sachs, and UnitedHealth Group. When the Dow is down, it usually signifies that a majority of these titans are facing selling pressure. Because these companies span multiple sectors—from technology and healthcare to finance and consumer goods—a broad decline in the Dow often reflects systemic concerns rather than isolated incidents within a single industry.
Calculating the “Points”
When investors ask how much the Dow is down, they are usually looking for a point value. However, the “Dow Divisor” is the hidden mechanism that translates a dollar change in a stock price into a point change in the index. This divisor is adjusted for stock splits, dividends, and other corporate actions to ensure continuity. For the modern investor, it is crucial to recognize that a 500-point drop today does not carry the same weight as a 500-point drop twenty years ago. As the index grows in total value, the percentage change becomes the more accurate metric for assessing the severity of a market pullback.
Identifying the Catalysts: What Drives Today’s Market Declines
A downward move in the Dow is rarely a random occurrence. It is typically a reaction to a specific set of catalysts that alter the perceived value of future corporate earnings. To understand why the market is down today, one must examine the macroeconomic environment.
Federal Reserve Policy and Interest Rates
Perhaps the most significant driver of market volatility in the current era is the Federal Reserve’s monetary policy. When the Fed raises interest rates to combat inflation, the cost of borrowing increases for both consumers and corporations. Higher interest rates can compress profit margins and reduce the present value of future cash flows, leading investors to reprice stocks lower. If the Dow is down today, it is frequently because of “hawkish” signals from central bankers or economic data—such as high Consumer Price Index (CPI) readings—that suggest rates will remain “higher for longer.”
Corporate Earnings and Forward Guidance
The Dow is ultimately a reflection of the profitability of its 30 components. During earnings season, the index can experience sharp declines if bellwether companies miss their revenue targets or, perhaps more importantly, provide “weak guidance.” If a major component like Walmart or Caterpillar warns of slowing consumer demand or rising input costs, the Dow may drop as investors price in a leaner profit environment for the quarters ahead.
Geopolitical Instability and Global Supply Chains
In a globalized economy, events occurring thousands of miles away can instantly impact the Dow. Geopolitical tensions, trade disputes, or disruptions in energy markets create uncertainty. Markets detest uncertainty. When news breaks regarding international conflict or supply chain bottlenecks, institutional investors often pivot toward “risk-off” assets like Treasury bonds or gold, causing the Dow to lose ground as equity positions are liquidated.
Points vs. Percentages: Maintaining Perspective Amid Volatility
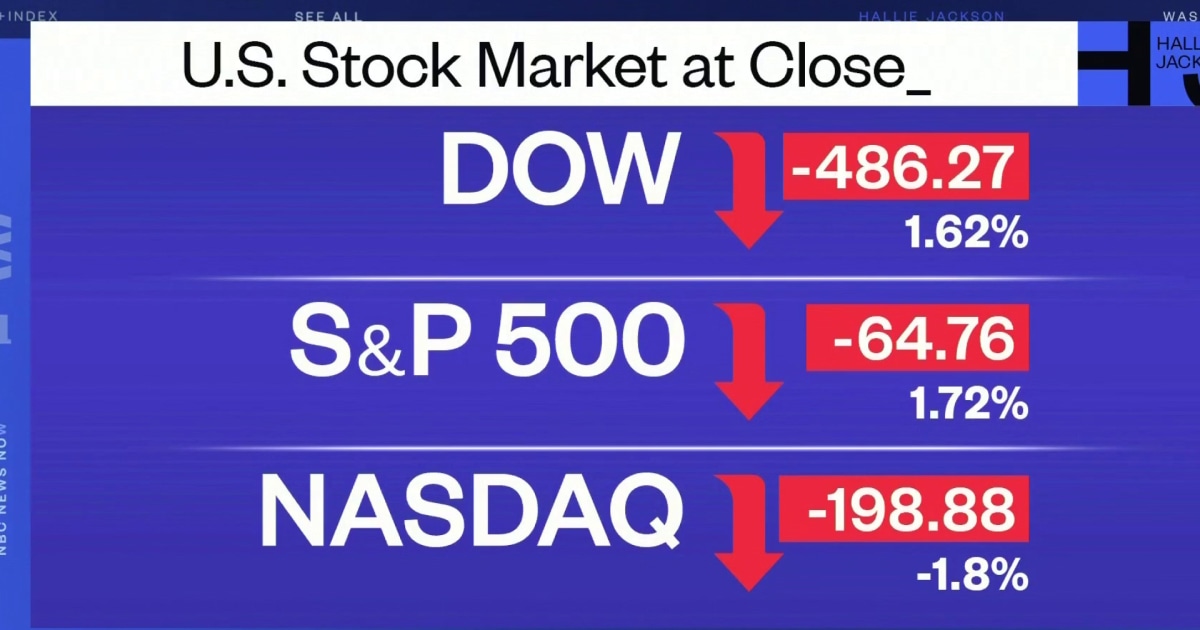
One of the most common mistakes individual investors make is overreacting to large point drops in the Dow. Headlines often scream about “The Largest Point Drop in History,” but these headlines can be mathematically misleading.
The Psychological Trap of Nominal Figures
As the Dow Jones Industrial Average reaches higher historical levels, the nominal point swings naturally increase. A 1,000-point drop when the Dow is at 40,000 is a 2.5% decline. While significant, it is a standard part of market volatility. Compare this to the “Black Monday” crash of 1987, where the Dow fell 508 points—a staggering 22.6% decline at the time. By focusing on percentages rather than points, investors can maintain a more rational perspective and avoid the panic selling that often accompanies nominal record-breaking drops.
Volatility as a Feature, Not a Bug
It is essential to remember that market pullbacks are a structural necessity for a healthy long-term uptrend. No market moves in a straight line upward. Pullbacks, corrections (a 10% drop), and bear markets (a 20% drop) serve to wash out speculative excess and allow valuations to reset. When the Dow is down today, it may simply be the market “taking a breather” after an extended rally, providing a more sustainable foundation for future gains.
Strategic Asset Allocation: Actions to Take When the Dow Dips
When the Dow is trending downward, the instinct for many is to “do something.” However, the most successful investors use these periods to refine their strategy rather than abandon it.
The Power of Dollar-Cost Averaging
For long-term investors, a down day in the Dow is an opportunity to execute dollar-cost averaging (DCA). By investing a fixed amount of money at regular intervals, you naturally buy more shares when prices are low and fewer shares when prices are high. This strategy removes the emotional burden of trying to “time the bottom” and lowers the average cost basis of your holdings over time.
Rebalancing and Quality Assessment
A declining market is the perfect time to audit your portfolio. Are you over-leveraged in a specific sector? Has the recent volatility shifted your asset allocation away from your target? Use down days to rebalance by selling overvalued assets and moving capital into “quality” stocks—those with strong balance sheets, consistent cash flows, and defensive moats. The 30 stocks in the Dow are often the first to recover because of their fundamental strength; observing which ones hold up best during a downturn can provide clues into where the “smart money” is hiding.
Emotional Discipline and the Long View
The greatest threat to a portfolio during a market downturn is not the market itself, but the investor’s reaction to it. Emotional discipline is a financial asset. Historical data shows that some of the market’s best performing days occur immediately following its worst. Missing just a few of those recovery days can significantly diminish long-term returns. When the Dow is down, the most profitable action is often the most difficult one: staying the course and adhering to a pre-defined financial plan.
Tools and Metrics for Tracking Real-Time Performance
To stay informed without becoming overwhelmed, investors should utilize a specific set of tools and metrics that provide context to the Dow’s daily movements.
Real-Time Financial Dashboards
Modern financial platforms provide more than just the current price. When checking how much the Dow is down, look for “Market Breadth” indicators. This includes the Advance-Decline Line, which shows how many individual stocks are falling versus rising. If the Dow is down but the Advance-Decline Line is positive, the decline might be concentrated in just one or two high-priced components rather than reflecting a broad market sell-off.
The VIX: The Market’s Fear Gauge
The CBOE Volatility Index (VIX) is a critical companion to the Dow. It measures the market’s expectation of 30-day volatility based on S&P 500 index options. When the Dow is down and the VIX is spiking, it indicates a high level of fear and potential panic. Conversely, if the Dow is down but the VIX remains relatively stable, it suggests an orderly retreat or profit-taking rather than a systemic crash.

Correlation with the S&P 500 and Nasdaq
Finally, always compare the Dow’s performance to the S&P 500 and the Nasdaq. If the Dow is down significantly while the Nasdaq (which is tech-heavy) is up, it suggests a rotation from value and industrial stocks into growth and technology. Understanding these intra-market rotations helps investors identify where capital is flowing and where the next opportunities may lie.
In conclusion, the daily fluctuations of the Dow Jones Industrial Average are a narrative of the world’s economic health. While seeing the Dow “down” can cause temporary anxiety, it is merely a single data point in a much larger journey of wealth accumulation. By focusing on percentages, understanding the macroeconomic catalysts, and maintaining a disciplined investment strategy, you can transform market volatility from a source of stress into a tool for long-term financial success.
aViewFromTheCave is a participant in the Amazon Services LLC Associates Program, an affiliate advertising program designed to provide a means for sites to earn advertising fees by advertising and linking to Amazon.com. Amazon, the Amazon logo, AmazonSupply, and the AmazonSupply logo are trademarks of Amazon.com, Inc. or its affiliates. As an Amazon Associate we earn affiliate commissions from qualifying purchases.