
The question “how much is the stock market down?” is one of the most frequently posed by investors, economists, and the general public during periods of market volatility. It reflects a fundamental concern about financial health, future prospects, and the stability of the economic landscape. While a seemingly simple question, its answer is multifaceted, depending on the specific indices considered, the timeframe in question, and the underlying economic forces at play. Understanding market downturns goes beyond mere percentages; it involves dissecting the causes, assessing the impact, and formulating strategies to navigate through challenging times.
The stock market, by its very nature, is a dynamic and often unpredictable entity. It experiences cycles of growth and contraction, driven by a complex interplay of economic indicators, corporate performance, investor sentiment, and global events. When headlines trumpet a market decline, it’s crucial for investors to move beyond immediate panic and engage in a more informed analysis. This article delves into the intricacies of measuring market downturns, exploring their common drivers, outlining their impact, and offering actionable strategies for investors to manage their portfolios effectively when the market is in retreat.
Defining “Down”: Metrics and Measurement
To accurately address how much the stock market is down, one must first understand what metrics are being used and how these declines are categorized. The “stock market” isn’t a single entity but a composite of various exchanges and indices, each offering a different lens through which to view market performance.
Key Stock Market Indices
When people refer to “the stock market,” they are typically thinking of major market indices that serve as barometers for different segments of the economy. Each index represents a basket of stocks, and their movements reflect the collective performance of those underlying companies.
- S&P 500 (Standard & Poor’s 500): Widely considered the best gauge of large-cap U.S. equities and the overall health of the American economy. It includes 500 of the largest U.S. publicly traded companies, representing diverse sectors. Its percentage change is often cited as the definitive measure of broad market movement.
- Dow Jones Industrial Average (DJIA): A price-weighted index of 30 significant industrial companies traded on the Nasdaq and New York Stock Exchange. While historically influential, its smaller scope means it’s less representative of the broader market than the S&P 500.
- Nasdaq Composite: Heavily weighted towards technology and growth companies. Its performance is often indicative of the tech sector’s health, and it can be more volatile than the S&P 500 due to its concentration in a more speculative industry.
- Russell 2000: Tracks the performance of 2,000 small-cap U.S. companies. It’s often seen as an indicator of the health of smaller, domestically focused businesses.
A decline in one index might not precisely mirror another. For instance, a period of rising interest rates might disproportionately affect the Nasdaq due to its tech-heavy composition, while value-oriented stocks in the Dow might hold up better. Therefore, understanding which index is being referenced is crucial for accurate assessment.
Types of Market Declines
Not all declines are created equal. Financial markets categorize downturns based on their severity, helping investors understand the potential implications.
- Correction: A market correction is typically defined as a decline of 10% or more from a recent peak in an index. Corrections are relatively common and can occur several times a year. They are often healthy for the market, as they can deflate speculative bubbles and reset valuations. Historically, corrections are usually short-lived, with markets often recovering within months.
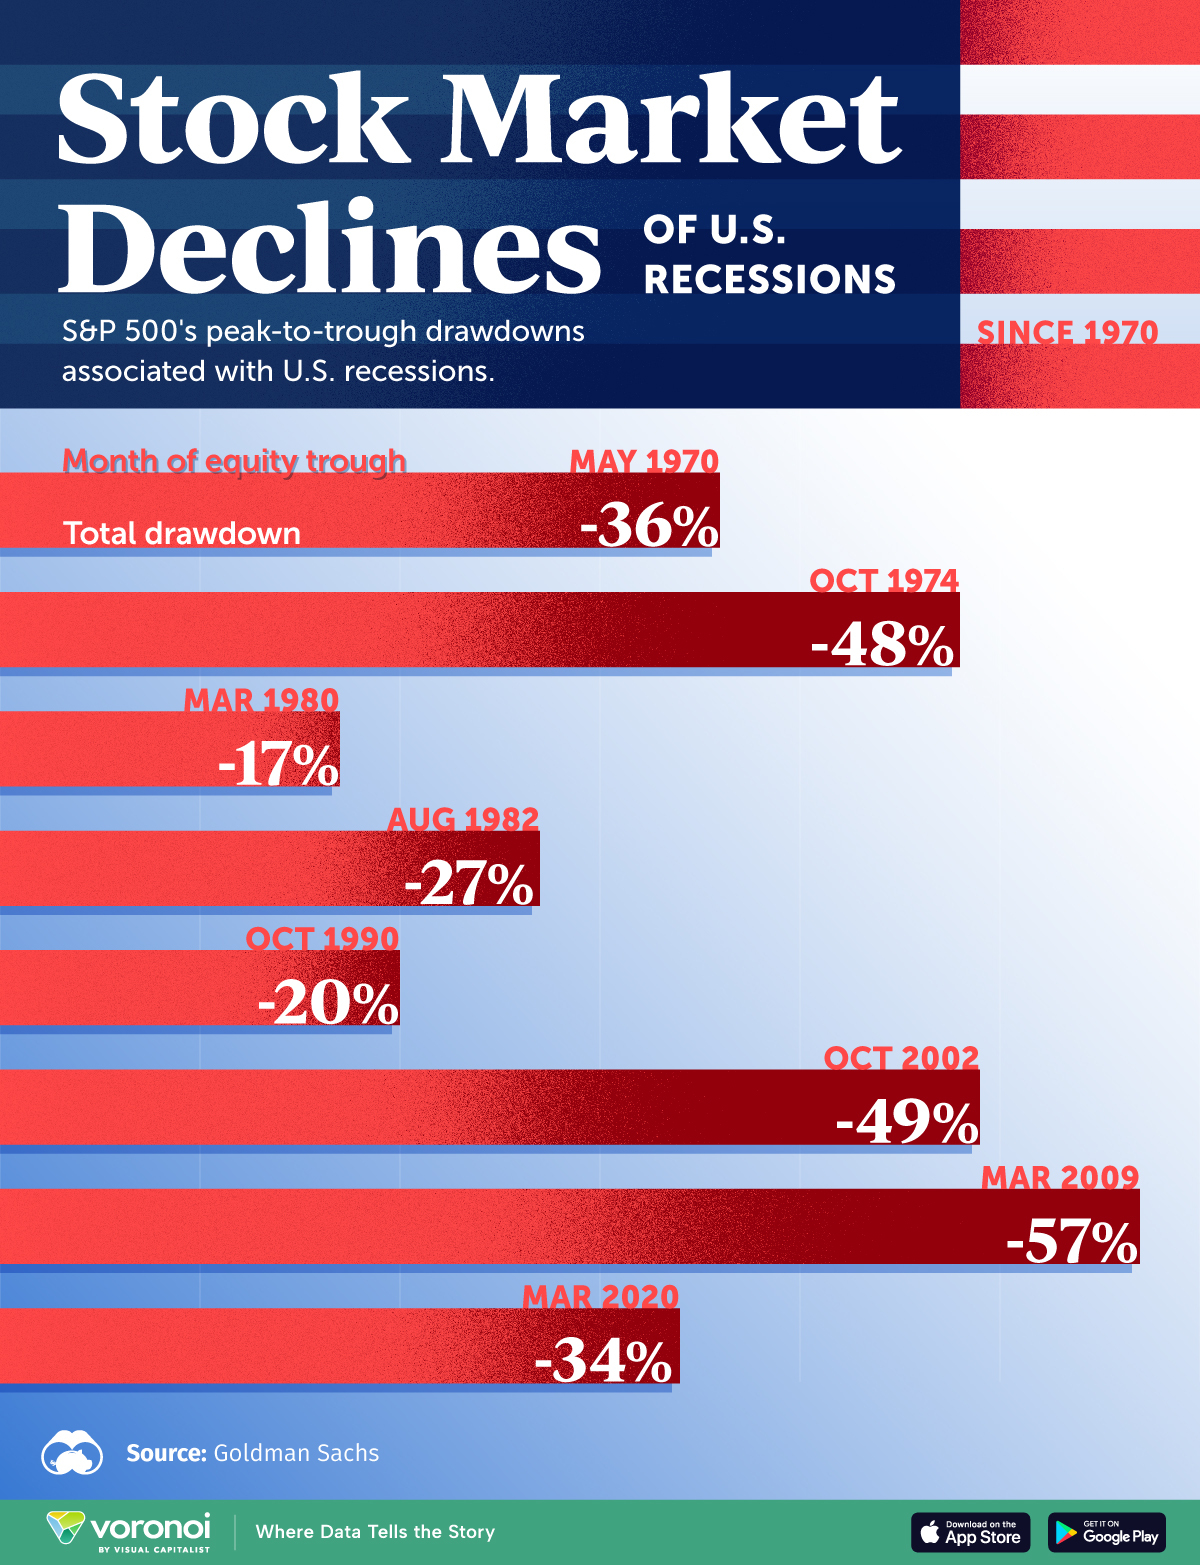
- Bear Market: A more severe and sustained decline, a bear market is characterized by a fall of 20% or more from recent highs. Bear markets are less frequent but more impactful than corrections, signaling deeper underlying economic problems or significant shifts in investor sentiment. They can last for many months, or even years, and are often accompanied by economic recessions.
Differentiating between a correction and a bear market helps investors frame their expectations and adapt their strategies. A 15% drop, for example, is a significant correction, but not yet a bear market, though it might feel equally unnerving.
Measuring Percentage Declines
The “how much” aspect is always expressed in percentage terms, as this standardizes comparison regardless of the index’s absolute value. A percentage decline indicates the proportional loss from a previous high. For example, if the S&P 500 was at 5,000 and drops to 4,500, it’s a 10% decline. This metric allows for a clear, objective measure of the market’s retreat. It’s important to remember that these percentages are usually calculated from the most recent peak, which can vary depending on the specific high point chosen for comparison.
Recent Market Performance and Key Drivers
Market downturns are not random events; they are typically a response to a confluence of economic, geopolitical, and corporate factors that erode investor confidence and impact future earnings expectations. Understanding these drivers is key to contextualizing the current state of the market.
Economic Indicators at Play
Macroeconomic conditions are often the most significant catalysts for market slides.
- Inflation: Persistent, high inflation erodes purchasing power and increases the cost of doing business. Central banks typically respond by raising interest rates to cool the economy, which can stifle corporate profits and make borrowing more expensive, thus reducing market valuations.
- Interest Rate Hikes: When central banks, like the U.S. Federal Reserve, aggressively raise interest rates to combat inflation, it can have a chilling effect on the stock market. Higher rates increase the cost of capital for businesses and make bonds more attractive relative to stocks, causing investors to reallocate funds.
- GDP Growth/Contraction: A slowdown in Gross Domestic Product (GDP) growth or an outright contraction (a recession) signals a weaker economy, leading to lower corporate earnings and reduced investor appetite for risk.
- Consumer Spending and Confidence: A significant decline in consumer spending, often reflected in lower retail sales or consumer confidence surveys, can prefigure corporate earnings misses and broader economic slowdowns.
Geopolitical and Global Events
Events on the world stage can create profound ripples that impact financial markets globally.
- Wars and Conflicts: Geopolitical instability can disrupt supply chains, escalate energy prices, and create uncertainty, leading investors to seek safer assets and pull capital from riskier ventures like stocks.
- Supply Chain Disruptions: Events like pandemics or localized conflicts can sever supply lines, leading to shortages, increased costs, and ultimately, lower profits for companies reliant on global trade.
- Energy Crises: Spikes in oil and gas prices, often driven by geopolitical tensions or production cuts, can increase operational costs for businesses across nearly all sectors and reduce discretionary income for consumers, leading to reduced economic activity.
Corporate Earnings and Sector Performance
While macro factors set the stage, individual corporate performance ultimately drives stock prices.
- Disappointing Earnings: A string of major companies reporting earnings that fall short of analyst expectations can signal weakening economic conditions or sector-specific challenges, leading to widespread sell-offs.
- Sector-Specific Headwinds: Certain sectors might face unique challenges. For example, regulatory changes, technological obsolescence, or shifts in consumer preferences can disproportionately affect specific industries, leading to significant declines in their stock values, even if the broader market is stable.
Impact of Market Downturns on Investors
Beyond the numbers, market downturns have a tangible and often profound impact on individual investors, affecting both their financial portfolios and psychological well-being.
The Psychological Toll
Market declines can be emotionally draining. Watching portfolio values shrink can trigger fear, anxiety, and even panic.
- Fear and Panic Selling: The instinct to “stop the bleeding” often leads investors to sell assets at a loss, locking in those losses and missing out on potential recoveries. This herd mentality can exacerbate downturns.
- Behavioral Biases: During volatile periods, cognitive biases such as loss aversion (the tendency to prefer avoiding losses over acquiring equivalent gains) become amplified, making rational decision-making challenging. Investors might also exhibit confirmation bias, seeking information that confirms their negative outlook.
Portfolio Valuation and Wealth Erosion
The most direct impact is on the monetary value of investments.
- Paper Losses: While actual losses are only realized when assets are sold, the decline in portfolio value represents a “paper loss.” This can affect retirement plans, college savings, and other financial goals, potentially requiring adjustments or delays.
- Reduced Net Worth: For many, invested capital constitutes a significant portion of their net worth. A substantial market decline can therefore reduce an individual’s perceived and actual wealth, impacting financial confidence and future spending decisions.
Opportunities Amidst the Decline
Paradoxically, market downturns also present unique opportunities for astute investors.
- Buying Opportunities: For long-term investors, a market decline means that quality assets are available at lower prices. This “sale” can allow investors to acquire more shares of fundamentally strong companies at attractive valuations, potentially yielding higher returns when the market recovers.
- Tax-Loss Harvesting: Investors can sell investments at a loss to offset capital gains and, in some cases, a limited amount of ordinary income. This strategy can reduce current tax liabilities, making the most of an unfavorable market situation.
Navigating Volatility: Strategies for Investors
Successfully navigating a market downturn requires discipline, a clear strategy, and a commitment to long-term financial goals. Emotional responses often lead to suboptimal decisions.
The Importance of a Long-Term Perspective
One of the most crucial principles during market volatility is to maintain a long-term view.
- Time in the Market vs. Timing the Market: History repeatedly shows that trying to predict market bottoms and tops (timing the market) is exceedingly difficult, even for professionals. Instead, focusing on “time in the market”—staying invested for extended periods—has proven to be a more effective strategy for wealth creation. Market recoveries are a historical norm.
- Focus on Goals: Remind yourself of your original investment goals. If they are decades away (e.g., retirement), short-term market fluctuations are less critical than the long-term compounding of returns.
Diversification as a Shield
Diversification is the bedrock of risk management and becomes particularly vital during downturns.
- Asset Allocation: Spreading investments across different asset classes (stocks, bonds, real estate, commodities) ensures that a downturn in one area doesn’t decimate the entire portfolio. Bonds, for instance, often perform well when stocks decline.
- Global Diversification: Investing in markets across different countries and regions can mitigate risk, as various economies may not move in lockstep.
- Sector Diversification: Within equities, investing across various sectors (tech, healthcare, industrials, consumer staples) can cushion blows, as some sectors are more resilient during economic slowdowns than others.
Dollar-Cost Averaging
This is a powerful strategy during volatile markets, especially for those continuing to invest regularly.
- Consistent Investing: Dollar-cost averaging involves investing a fixed amount of money at regular intervals, regardless of market conditions. When prices are high, your fixed amount buys fewer shares; when prices are low, it buys more shares.
- Reduced Risk of Bad Timing: This systematic approach reduces the risk of investing a large lump sum just before a market crash, smoothing out your average purchase price over time.
Rebalancing Your Portfolio
Periodic rebalancing is crucial to maintain your desired risk profile.
- Maintaining Desired Risk Exposure: Over time, market movements can shift your portfolio’s asset allocation away from your target. For example, a stock market boom might make your equity allocation too high. During a downturn, your bond allocation might become disproportionately large if stocks have fallen significantly. Rebalancing involves selling off overweight assets and buying underweight ones to return to your target allocation.
- “Buy Low, Sell High” Principle: Rebalancing often implicitly encourages buying assets that have fallen (now cheaper) and selling those that have performed well (now more expensive), aligning with fundamental investment wisdom.
Avoiding Emotional Decisions
The most challenging, yet most important, strategy is to resist the urge to act emotionally.
- Stick to an Investment Plan: A well-thought-out investment plan, developed during calm periods, should guide decisions. Avoid making drastic changes based on daily news cycles or fear.
- Consult a Financial Advisor: Professional advisors can provide objective insights, help manage emotional responses, and ensure your strategy remains aligned with your long-term goals.
Looking Ahead: Outlook and Recovery
While downturns can be unsettling, history offers a comforting perspective: markets tend to recover, and often reach new highs. Understanding the patterns of recovery can help investors maintain conviction.
Historical Context of Market Recoveries
Every major market downturn in history, from the Great Depression to the 2008 financial crisis and the COVID-19 crash, has eventually been followed by a recovery and subsequent new highs.
- Resilience of Capitalism: This consistent pattern underscores the fundamental resilience of capitalist economies, innovation, and human ingenuity. Businesses adapt, technologies advance, and economies find new avenues for growth.
- Average Duration: While the duration of bear markets and recoveries varies, the average bear market has historically been shorter than the average bull market. The market spends far more time going up than down.
Signs to Watch for Recovery
Monitoring key indicators can provide clues about when a market might be bottoming out and preparing for a rebound.
- Inflation Cooling: A sustained reduction in inflation pressures would likely lead central banks to pause or reverse interest rate hikes, which is typically positive for equity markets.
- Fed Policy Shifts: A dovish pivot by the Federal Reserve (or other major central banks), signaling an end to rate hikes or even future cuts, is often a strong catalyst for market rallies.
- Economic Growth Rebound: Evidence of renewed economic growth, such as improving GDP figures, stronger employment data, and robust corporate earnings, indicates a healthier environment for stocks.
- Improved Consumer and Business Confidence: A measurable uptick in confidence among consumers and businesses can signal a willingness to spend and invest, driving economic activity.

Preparing for Future Volatility
Even during a recovery, it’s wise to acknowledge that market volatility is a permanent feature of investing.
- Building an Emergency Fund: Having readily accessible cash in a high-yield savings account ensures you don’t have to sell investments at a loss to cover unexpected expenses.
- Staying Informed but Selective: Keep abreast of economic news but avoid obsessive daily market monitoring. Focus on high-quality, reputable sources for analysis rather than speculative chatter.
- Regular Portfolio Reviews: Periodically reviewing your portfolio with your financial goals in mind helps ensure it remains optimized for your risk tolerance and investment horizon.
In conclusion, “how much is the stock market down?” is a critical question that demands a nuanced answer rooted in understanding market metrics, historical context, and investor psychology. While downturns are a normal and inevitable part of the investment cycle, they need not be a source of panic. By adopting a long-term perspective, embracing diversification, employing disciplined investment strategies, and staying informed, investors can not only weather the storm but potentially emerge stronger when the markets inevitably rebound.
aViewFromTheCave is a participant in the Amazon Services LLC Associates Program, an affiliate advertising program designed to provide a means for sites to earn advertising fees by advertising and linking to Amazon.com. Amazon, the Amazon logo, AmazonSupply, and the AmazonSupply logo are trademarks of Amazon.com, Inc. or its affiliates. As an Amazon Associate we earn affiliate commissions from qualifying purchases.