The question “how much has the stock market gone down?” is often one of the most pressing and anxiety-inducing queries for investors during periods of economic uncertainty. It’s a natural reaction to track the value of one’s investments and feel concern when those numbers dip. However, understanding the true extent of a market decline requires more than just a quick glance at a daily headline; it demands context, a grasp of financial metrics, and a long-term perspective. The “down” in the stock market is rarely a simple, singular figure; it varies by index, by sector, by individual stock, and crucially, by the timeframe being considered.

The stock market, by its very nature, is a dynamic and cyclical entity. Periods of growth, known as bull markets, are inevitably followed by periods of contraction or decline, known as bear markets or corrections. These downturns, while often painful in the short term, are a normal and healthy part of the economic cycle, allowing for a recalibration of valuations and the weeding out of unsustainable businesses. For the discerning investor, understanding the nuances of these movements is not just about measuring losses, but about identifying potential opportunities. This article will delve into how to interpret market movements, examine the factors that contribute to declines, and outline strategies for navigating these challenging yet potentially rewarding periods in the world of finance.
Understanding Market Volatility and Downturns
The stock market rarely moves in a straight line. Volatility, defined as rapid and often unpredictable changes in prices, is an inherent characteristic of financial markets. Downturns are specific manifestations of this volatility, representing periods where the overall market, or significant portions of it, experiences a sustained decline in value. Grasping the terminology and the cyclical nature of these events is fundamental to making informed investment decisions.
Defining a Market Downturn
Not all drops in the market are equal, and financial terminology helps us distinguish between different magnitudes of decline:
- Correction: A market correction is generally defined as a decline of at least 10% from a recent peak in a major market index, such as the S&P 500. Corrections are relatively common and can be triggered by various factors like minor economic slowdowns, geopolitical events, or shifts in investor sentiment. While unsettling, they are often short-lived, typically lasting a few weeks to several months, and are generally seen as healthy recalibrations of asset prices.
- Bear Market: A bear market is a more significant and prolonged downturn, characterized by a decline of 20% or more from a recent peak in a broad market index. Bear markets are less frequent than corrections but tend to be more severe and last longer, often spanning several months to over a year. They are typically associated with deeper economic concerns, such as recessions, high inflation, or major financial crises. The psychological impact of a bear market can be profound, as sustained losses test investors’ resolve and patience.
- Market Crash: While not a formally defined term with a specific percentage, a market crash refers to a sudden, dramatic, and often unexpected drop in stock prices over a very short period, sometimes even within a single trading day or week. Crashes are often triggered by specific, impactful events (e.g., “Black Monday” in 1987, the dot-com bubble burst, the 2008 financial crisis, or the initial COVID-19 shock) and can lead to panic selling. They can precipitate corrections or bear markets but are distinguished by their abrupt and intense nature.
Key Market Indexes and Their Significance
When people refer to “the stock market,” they are typically referring to the performance of one or more major market indexes. These indexes are baskets of stocks that represent a particular segment of the market or the market as a whole, providing a benchmark for overall performance:
- S&P 500 (Standard & Poor’s 500): Widely considered the best gauge of large-cap U.S. equities and overall U.S. stock market health. It includes 500 of the largest publicly traded companies in the United States, representing approximately 80% of the total market capitalization. Its performance is often cited as the primary indicator of the broader market’s direction.
- Dow Jones Industrial Average (DJIA): Composed of 30 large, well-established U.S. companies (blue-chip stocks). While historically significant, its limited number of components and price-weighted methodology make it less representative of the overall market than the S&P 500. Nevertheless, it remains a frequently quoted barometer of market sentiment.
- NASDAQ Composite: Heavily weighted towards technology and growth companies, the NASDAQ Composite includes virtually all stocks listed on the NASDAQ exchange. It is an important index for tracking the performance of the tech sector and smaller, often innovative, companies.
- Russell 2000: An index that tracks the performance of 2,000 small-cap U.S. companies. It is often used as a benchmark for small-cap stock performance and can provide insights into the health of smaller, domestically focused businesses.
Looking at these specific indexes matters because they offer different perspectives on market health. A tech-heavy NASDAQ might be down significantly while the broader S&P 500 is only moderately affected, indicating sector-specific issues rather than an overall economic malaise.
The Cyclical Nature of Markets
A crucial concept for long-term investors is the cyclical nature of financial markets. Historically, no bear market or correction has lasted forever. Every downturn has eventually been followed by a recovery and, ultimately, a new bull market, where previous highs are surpassed. Economic cycles, technological advancements, corporate innovation, and human ingenuity all contribute to this persistent upward trend over decades. While individual downturns can feel unique and terrifying in the moment, a look at historical charts spanning decades reveals that these drops are merely temporary dips in a long-term upward trajectory. This historical pattern is a cornerstone of the argument for long-term investing and helps temper the emotional responses to short-term volatility.
Recent Market Performance: A Look at the Numbers
When discussing how much the stock market has gone down, it’s important to acknowledge that specific percentages and dates are fluid. Market performance is constantly changing. However, we can analyze the types of declines observed during periods of significant stress and the factors driving them. Investors frequently encounter periods where major indexes experience noticeable drops from their peak values.
Major Indexes’ Performance (Illustrative Examples)
In various periods of economic uncertainty over the past few decades, we have seen major indices experience significant drawdowns:
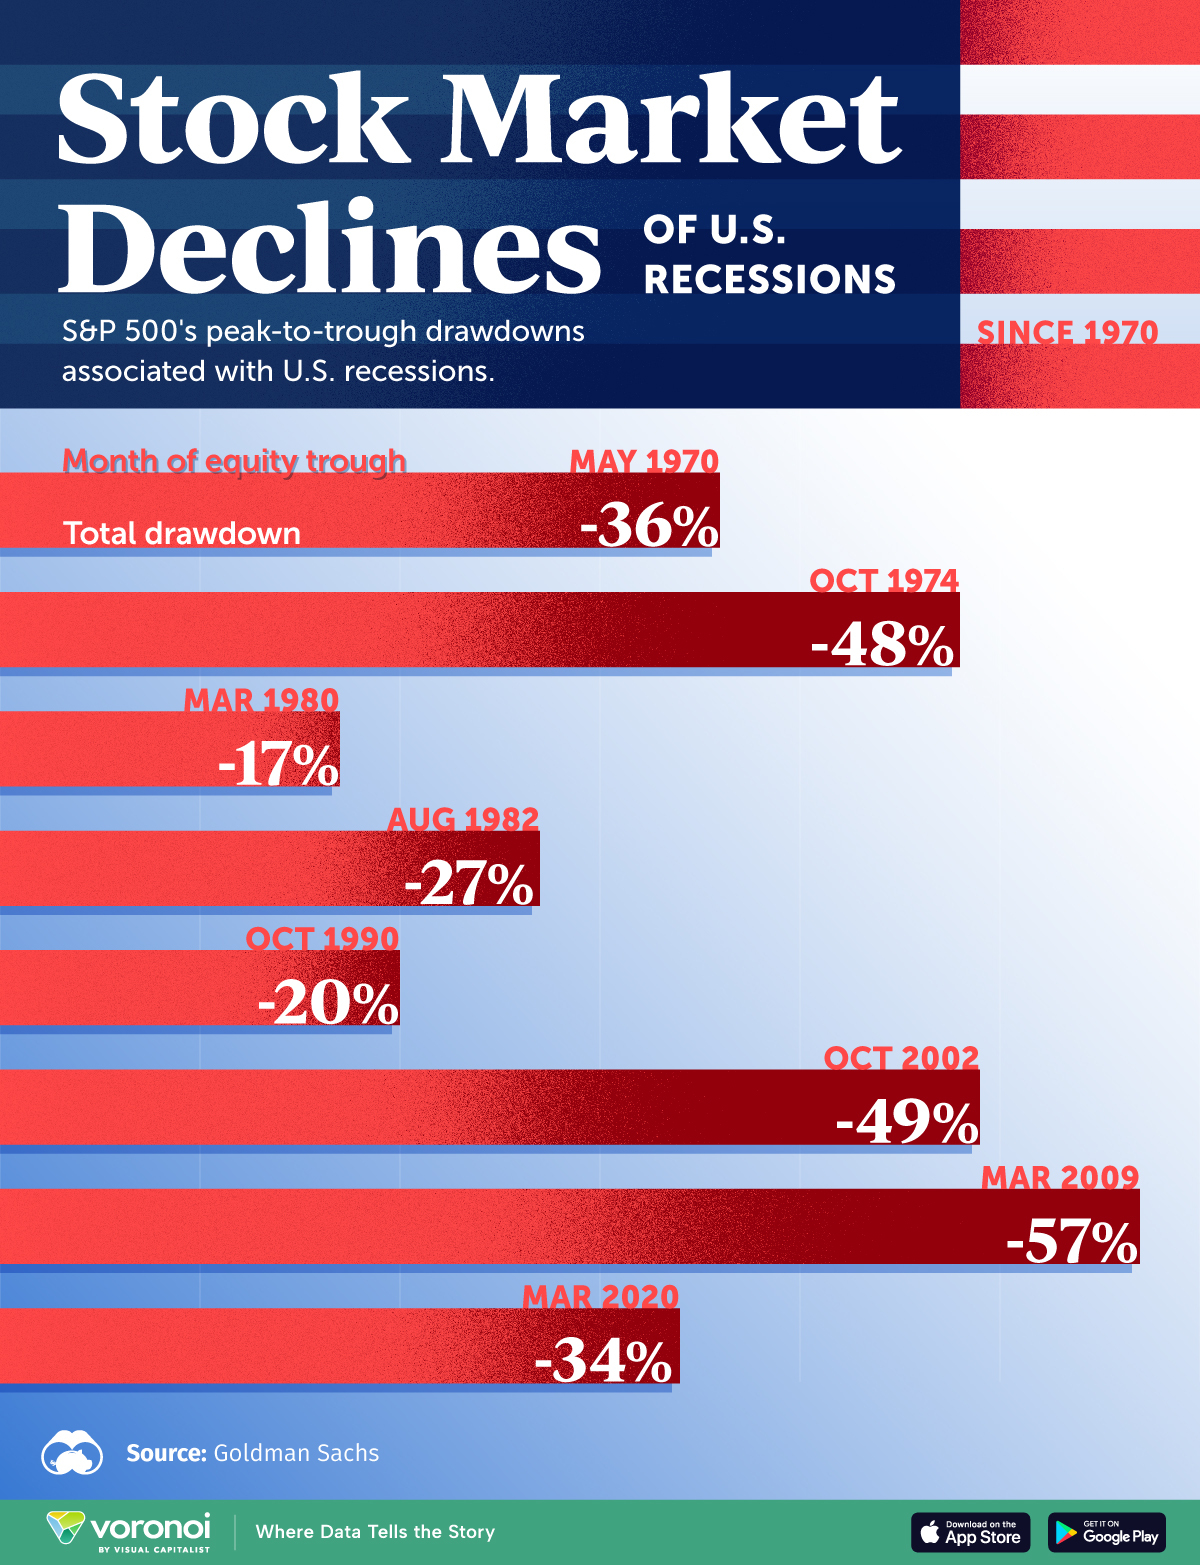
- The S&P 500, a benchmark for the broader U.S. market, has historically seen corrections of 10-19% occur roughly once a year on average. More significant bear markets, where the index falls 20% or more, have happened less frequently but are notable for their impact. For instance, during the Dot-com Bust (2000-2002), the S&P 500 fell nearly 50%. During the 2008 Global Financial Crisis, it plummeted by 56%. Even more recently, during the initial onset of the COVID-19 pandemic in early 2020, the S&P 500 experienced a rapid correction of over 30% in just a few weeks.
- The tech-heavy NASDAQ Composite often experiences more dramatic swings due to its concentration of growth stocks, which are more sensitive to interest rates and future earnings projections. During the Dot-com Bust, the NASDAQ Composite plunged an astonishing 78%. While subsequent bear markets haven’t seen quite the same severity for the NASDAQ, it typically leads the downside during periods of growth stock sell-offs.
- The Dow Jones Industrial Average, with its focus on established blue-chip companies, tends to be somewhat less volatile than the NASDAQ but still reflects broad market sentiment. It too experienced declines similar in magnitude to the S&P 500 during the major bear markets mentioned.
These figures are illustrative of how substantial market declines can be, emphasizing that “how much” depends heavily on which index you’re observing and the specific period in question. The speed and depth of a decline can vary immensely, from a swift correction to a grinding, prolonged bear market.
Factors Contributing to Recent Declines (General Triggers)
Market downturns are rarely caused by a single factor but rather a confluence of economic, political, and social forces. Common triggers include:
- Inflation Concerns: When inflation rises rapidly, the purchasing power of money erodes, and central banks are compelled to raise interest rates to combat it. This makes borrowing more expensive for businesses and consumers, dampening economic activity and often leading to lower corporate profits.
- Interest Rate Hikes: Central banks, such as the U.S. Federal Reserve, raise interest rates to cool an overheating economy or tame inflation. Higher rates make future corporate earnings less valuable (discounting future cash flows at a higher rate) and increase the cost of capital for businesses, leading to lower stock valuations. They also make bonds more attractive relative to stocks, causing some capital to shift.
- Geopolitical Events: Wars, trade disputes, political instability, and other international conflicts can introduce significant uncertainty into global markets, disrupt supply chains, and impact commodity prices, all of which can lead to investor apprehension and sell-offs.
- Economic Recession Fears: A recession, typically defined as two consecutive quarters of negative GDP growth, implies reduced consumer spending, lower corporate profits, and higher unemployment. The anticipation or onset of a recession almost always triggers significant stock market declines as investors discount future earnings.
- Company Earnings Disappointments: When major companies report earnings that fall short of analyst expectations, it can signal broader economic weakness or sector-specific issues. A string of such disappointments can erode investor confidence and contribute to a market-wide downturn.
- Supply Chain Disruptions: Events that disrupt global supply chains (e.g., pandemics, natural disasters, geopolitical conflicts) can lead to shortages, increased production costs, and reduced corporate profitability, negatively impacting stock valuations.
The Impact on Different Asset Classes
A market downturn doesn’t impact all investments uniformly.
- Equities (Stocks): Are typically the hardest hit during a bear market. Growth stocks, which derive more of their value from future earnings potential, tend to suffer more than value stocks or dividend-paying stocks during periods of rising interest rates and economic uncertainty.
- Bonds: Often act as a safe haven during stock market downturns, as investors flock to less volatile assets. However, in an environment of rising interest rates, bond prices can also fall, especially for longer-duration bonds, making their safe-haven status more nuanced.
- Real Estate: While not as directly traded as stocks, real estate values can be indirectly affected. Higher interest rates make mortgages more expensive, cooling the housing market. Economic downturns can also reduce demand for commercial and residential properties.
- Cryptocurrencies: Have shown increasing correlation with tech stocks in recent years. Due to their inherent volatility and speculative nature, they often experience even larger percentage drops than traditional equities during broad market sell-offs.
Understanding these differential impacts is crucial for diversification and portfolio construction, especially during challenging market conditions.
Navigating a Down Market: Strategies for Investors
Periods of market decline can be emotionally challenging, tempting investors to make rash decisions. However, a well-thought-out strategy, anchored in discipline and a long-term perspective, can turn these challenging times into opportunities. The key is to react rationally rather than emotionally.
Don’t Panic Sell (Emotional vs. Rational Decisions)
One of the most dangerous reactions to a falling market is panic selling. Selling off all your holdings when the market is down locks in losses and ensures you will not participate in the inevitable recovery. Emotions like fear and greed are powerful drivers in investing, but succumbing to fear during a downturn can be detrimental to long-term wealth creation. Instead, stick to your pre-defined investment plan. If your financial goals and risk tolerance haven’t changed, neither should your core strategy. Remember the adage: “Time in the market beats timing the market.” Many of the market’s best days often follow its worst.
Rebalancing Your Portfolio
A down market presents an excellent opportunity to rebalance your portfolio. Over time, different asset classes perform differently, causing your original asset allocation (e.g., 70% stocks, 30% bonds) to drift. During a stock market decline, your equity portion might shrink, while your bond portion might grow relatively. Rebalancing involves selling some assets that have outperformed (if any) and buying more of those that have underperformed, bringing your portfolio back to its target allocation. In a down market, this often means buying more stocks at lower prices, effectively “buying the dip.” This strategy helps maintain your desired risk level and can enhance returns over the long term.
Dollar-Cost Averaging
Dollar-cost averaging is a powerful strategy, particularly effective during volatile or declining markets. It involves investing a fixed amount of money at regular intervals (e.g., $500 every month) regardless of the asset’s price. When prices are high, your fixed investment buys fewer shares; when prices are low, it buys more shares. Over time, this strategy averages out your purchase price, reducing the risk of making a large investment at an unfavorable market peak. In a down market, dollar-cost averaging allows you to accumulate more shares at lower prices, which can significantly boost returns when the market eventually recovers. It removes the emotional element of trying to “time the market.”
Focus on Quality and Fundamentals
In a bull market, even weak companies can see their stock prices rise. However, a bear market tends to expose weaknesses. During a downturn, shift your focus to high-quality companies with strong fundamentals:
- Robust Balance Sheets: Companies with low debt and ample cash reserves are better positioned to weather economic storms.
- Consistent Earnings and Cash Flow: Look for businesses that can generate profits and cash even in challenging environments.
- Sustainable Competitive Advantages: Companies with strong brands, intellectual property, or dominant market share are more resilient.
- Experienced Management: Leadership with a proven track record of navigating difficult economic conditions is a significant asset.
Investing in such “blue-chip” or fundamentally sound companies during a downturn can provide a stronger foundation for your portfolio’s recovery.
Diversification Remains Key
While often preached in bull markets, diversification becomes even more critical during downturns. Spreading your investments across different asset classes (stocks, bonds, real estate), various sectors (technology, healthcare, consumer staples, industrials), and different geographical regions can significantly reduce overall portfolio risk. When one sector or region is struggling, another might be performing better, cushioning the blow. For example, during a tech sell-off, defensive sectors like utilities or consumer staples might hold up better. Proper diversification ensures that no single event or asset class can derail your entire financial plan.
The Long-Term Perspective: Why Downturns are Opportunities
While the immediate impact of a market downturn can be unsettling, history consistently shows that these periods are not just moments of loss but also significant opportunities for patient, disciplined investors. Adopting a long-term perspective is perhaps the most crucial mindset for navigating market volatility.
Historical Returns and Recovery
One of the most comforting aspects of market history is its relentless upward trajectory over extended periods. While corrections and bear markets are inevitable, they have always been temporary. Every single bear market in history has eventually been followed by a recovery, leading to new market highs. For instance, following the Dot-com Bust, the S&P 500 eventually recovered and surged. The recovery from the 2008 financial crisis saw the longest bull market in history. The swift rebound from the COVID-19 crash in 2020 demonstrated the market’s resilience.
These historical patterns underscore the importance of staying invested. Those who panic sell during a downturn not only lock in their losses but also miss out on the subsequent rebound, which can be remarkably swift and powerful. The overall trend of the stock market has been positive, reflecting global economic growth, innovation, and increasing corporate profitability over centuries.
Compounding and Growth
The power of compounding is the engine of long-term wealth creation. It refers to the process of generating earnings on both your initial investment and on the accumulated interest or dividends from previous periods. Market downturns offer a unique advantage for compounding, especially for investors still in their accumulation phase. By continuing to invest during a dip (through strategies like dollar-cost averaging), you buy more shares at lower prices. When the market eventually recovers, the larger number of shares you’ve acquired will compound more rapidly, leading to potentially greater wealth accumulation over the long run. It’s not about “timing the market” perfectly, but rather “time in the market” that allows compounding to work its magic.
Learning and Adapting
Market downturns, though uncomfortable, serve as invaluable learning experiences for investors. They test an investor’s resolve, highlight the importance of risk management, and offer practical lessons that are difficult to grasp during continuous bull markets. During a downturn, investors can:
- Evaluate their risk tolerance: How well did you sleep during the decline? This is a true measure of your comfort with risk.
- Refine their investment strategy: Did your diversification hold up? Were your emergency funds adequate? These are crucial questions for adapting.
- Reinforce good habits: Downturns teach patience, the value of dollar-cost averaging, and the dangers of emotional decision-making.
These experiences can lead to a more robust, resilient financial plan and a more disciplined approach to investing in the future.
In conclusion, understanding “how much the stock market has gone down” is more than just a number; it’s an exercise in contextualization, historical perspective, and strategic thinking. Market downturns are an inherent part of the investment landscape, representing normal, albeit challenging, phases of the economic cycle. While they can evoke fear and uncertainty, they also present significant opportunities for diligent investors who adhere to a well-defined financial plan, practice diversification, engage in dollar-cost averaging, and maintain a steadfast long-term outlook. By focusing on quality, avoiding panic, and viewing corrections as chances to buy assets at a discount, investors can not only weather the storm but potentially emerge stronger and wealthier on the other side. For those seeking to navigate these complex waters, consulting with a qualified financial advisor can provide personalized guidance and reinforce disciplined investment behaviors.
aViewFromTheCave is a participant in the Amazon Services LLC Associates Program, an affiliate advertising program designed to provide a means for sites to earn advertising fees by advertising and linking to Amazon.com. Amazon, the Amazon logo, AmazonSupply, and the AmazonSupply logo are trademarks of Amazon.com, Inc. or its affiliates. As an Amazon Associate we earn affiliate commissions from qualifying purchases.