
The cryptocurrency market is renowned for its volatility, but few assets have experienced the unique combination of legal scrutiny and community resilience quite like XRP. As one of the oldest and most established digital assets, XRP has long been a staple in the portfolios of institutional and retail investors alike. However, recent price fluctuations and broader macroeconomic uncertainty have led many to ask a critical question: how low can XRP realistically go?
Predicting a price floor requires a multifaceted approach, blending technical analysis, fundamental developments, and an understanding of the regulatory landscape. To determine the potential downside for XRP, one must examine the psychological support levels, the resolution of long-standing legal battles, and the asset’s role in the future of cross-border payments.
Understanding the Macro Factors Pressuring XRP
The valuation of XRP does not exist in a vacuum. It is heavily influenced by external pressures that dictate whether investors seek safety in stablecoins or take risks on altcoins. Currently, several macro factors are weighing on the price, creating the bearish sentiment that leads to “how low” inquiries.
The Ripple vs. SEC Legal Saga: A Final Resolution?
For years, the primary anchor on XRP’s price has been the lawsuit filed by the U.S. Securities and Exchange Commission (SEC) against Ripple Labs. The central argument—whether XRP is a security—has created a cloud of uncertainty that has deterred institutional adoption in the United States. While the landmark ruling by Judge Analisa Torres in July 2023 provided some clarity by stating that programmatic sales of XRP on exchanges were not securities, the legal battle is far from over.
Ongoing appeals and the determination of penalties for institutional sales keep the market on edge. Any news perceived as a victory for the SEC often leads to immediate sell-offs, testing the asset’s support levels. Conversely, a definitive end to the litigation could act as a catalyst for a massive rally. Until then, the legal overhang acts as a ceiling on the price, while also setting the stage for sharp corrections if the news cycle turns negative.
Broader Crypto Market Trends and Bitcoin Dominance
XRP often moves in lockstep with the broader crypto market, which is currently dominated by Bitcoin’s price action. When Bitcoin experiences a significant correction, altcoins like XRP typically see amplified losses. This is due to a decrease in market liquidity and a shift in investor sentiment toward “risk-off” assets.
Furthermore, Bitcoin dominance—the measure of Bitcoin’s market cap relative to the total crypto market—plays a vital role. When dominance is high, capital tends to flow out of altcoins and back into Bitcoin or USD. If the global economy faces recessionary fears or if the Federal Reserve maintains high interest rates, the entire crypto sector may experience a “flush,” potentially driving XRP to levels not seen since the early stages of the current market cycle.
Technical Analysis: Identifying Key Support Zones
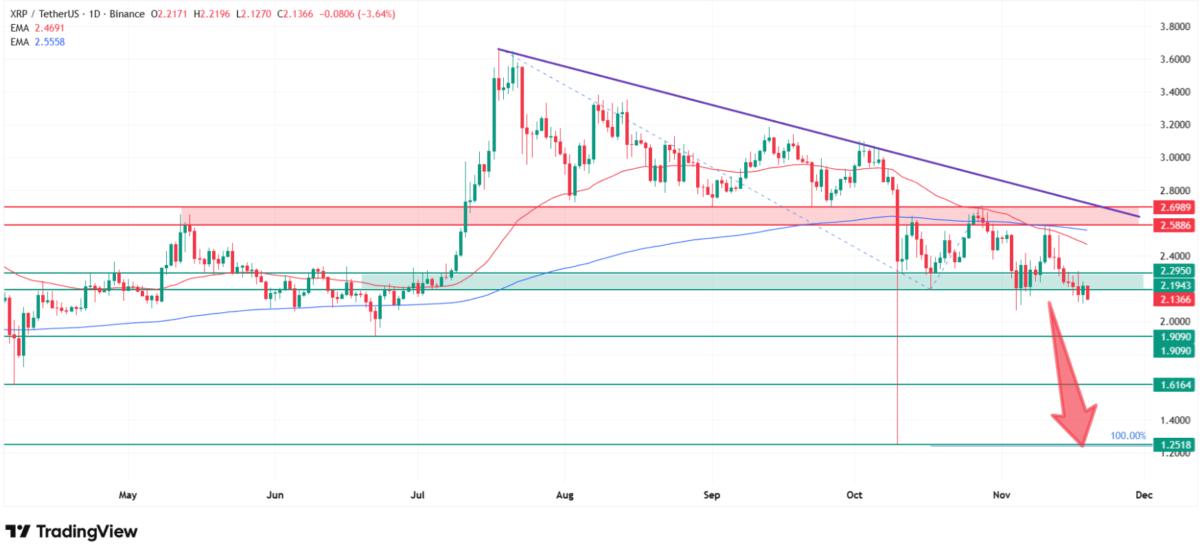
From a technical perspective, XRP has historically respected specific price zones. Traders use these levels to gauge where buying pressure might outweigh selling pressure, effectively creating a “floor.”
Historical Floor Prices and Psychological Benchmarks
One of the most significant psychological and technical support levels for XRP is the $0.40 to $0.45 range. Over the past several years, this zone has acted as a formidable barrier against further declines. When XRP enters this territory, “buy-the-dip” investors and institutional bots often trigger accumulation phases, preventing the price from sliding further.
If XRP were to break below $0.40, the next major historical support sits near $0.30. This level was tested during the height of the 2022 market contagion and the initial fallout of the SEC lawsuit. A drop to $0.30 would represent a “worst-case” scenario for many holders, but historically, the asset has shown incredible resilience at this valuation, quickly rebounding as it becomes oversold on the Daily and Weekly Relative Strength Index (RSI).
RSI, Moving Averages, and Volume Indicators
Technical indicators provide clues about whether a price drop is a temporary correction or a long-term trend reversal. The 200-day Exponential Moving Average (EMA) is a critical gauge; when XRP stays below this line, the sentiment is decidedly bearish.
Volume indicators also reveal the conviction of sellers. A “low” is often characterized by a “capitulation wick”—a sharp, high-volume drop that is quickly bought back up, leaving a long tail on the candlestick chart. If XRP approaches $0.40 on low volume, it suggests that sellers are exhausted and a bottom may be near. However, a high-volume break below $0.40 could signal a deeper retracement toward the $0.25–$0.30 range.

The Role of Utility and Institutional Adoption
Unlike many speculative assets in the crypto space, XRP’s value is increasingly tied to its utility within the financial sector. This fundamental value provides a “valuation floor” that differentiates it from meme coins or purely speculative tokens.
CBDCs and the XRP Ledger (XRPL)
The XRP Ledger (XRPL) is being explored by various central banks for the development of Central Bank Digital Currencies (CBDCs). Because the XRPL is designed for speed, scalability, and low cost, it is an ideal infrastructure for sovereign digital currencies. As more nations pilot these programs, the perceived value of the network increases.
This utility creates a fundamental demand for XRP as a bridge currency. If the network becomes the backbone for even a small percentage of global CBDC transactions, the price is unlikely to stay at historical lows for long. For investors asking “how low will it go,” the answer is often mitigated by the fact that the asset has a functional purpose that survives market cycles.
Liquidity Hub and Cross-Border Payments
Ripple’s primary business model revolves around On-Demand Liquidity (ODL), which uses XRP to facilitate near-instant cross-border payments. This system removes the need for pre-funded accounts in foreign jurisdictions, freeing up trillions of dollars in stagnant capital for banks.
As Ripple expands its partnerships in Asia, the Middle East, and Europe, the organic demand for XRP as a bridge asset grows. This demand is independent of retail speculation. Even in a bear market, if the volume of ODL transactions continues to rise, it creates a constant buy-pressure that supports the price, making a total collapse to zero highly improbable under current conditions.
Potential Downside Scenarios: What Could Drive the Price Lower?
While the $0.40 and $0.30 levels are strong support zones, it is important to acknowledge the risks that could lead to a deeper decline. In the world of finance, “black swan” events can defy technical analysis and historical trends.
Regulatory Setbacks and Global Policy
While the U.S. has been the focus of Ripple’s legal troubles, the global regulatory landscape is also shifting. If major economies were to implement restrictive policies on decentralized ledgers or if the European Union’s MiCA (Markets in Crypto-Assets) regulations were interpreted in a way that hindered XRP’s operation, the price could see a significant drop.
A definitive loss in the U.S. appeals court, resulting in a classification of XRP as a security across all transaction types, would be a catastrophic event. In such a scenario, XRP could potentially retest the $0.15 to $0.20 levels as liquidity dries up on U.S.-based exchanges and institutional players exit their positions to avoid regulatory non-compliance.
Liquidations and Whale Movements
XRP has a high concentration of “whales”—wallets holding massive amounts of the token. If a major holder, such as an early investor or a large institutional fund, decided to liquidate their entire position simultaneously, the sudden influx of supply could overwhelm the order books. This would cause a “flash crash,” where the price drops precipitously before arbitrage bots and opportunistic buyers can stabilize it. Monitoring exchange inflows of XRP is a common strategy for traders trying to anticipate these sudden downward movements.
Conclusion: Navigating the Volatility
So, how low will XRP go? Based on historical data, technical support, and the fundamental utility of the XRPL, the $0.40 to $0.45 range appears to be a strong psychological and technical floor. Barring a systemic collapse of the entire cryptocurrency market or an unprecedented legal defeat, this zone has consistently attracted buyers.
For the disciplined investor, these periods of downward pressure are often viewed as accumulation phases rather than reasons for panic. The future of XRP is inextricably linked to the broader adoption of blockchain technology in global finance. While the path may be volatile and the price may test the nerves of holders by dipping into the $0.30s during extreme market stress, the underlying infrastructure and growing institutional use cases provide a compelling argument for a long-term recovery.
Understanding that the “low” is often a temporary state driven by sentiment allows investors to look past the immediate noise and focus on the long-term trajectory of the digital asset landscape. As the legal fog clears and global financial systems evolve, the floor for XRP will likely stabilize, shifting the conversation from “how low” to “how high” it can ultimately reach.
aViewFromTheCave is a participant in the Amazon Services LLC Associates Program, an affiliate advertising program designed to provide a means for sites to earn advertising fees by advertising and linking to Amazon.com. Amazon, the Amazon logo, AmazonSupply, and the AmazonSupply logo are trademarks of Amazon.com, Inc. or its affiliates. As an Amazon Associate we earn affiliate commissions from qualifying purchases.