For millions of investors worldwide, tracking the S&P 500’s daily performance is akin to checking the weather report before leaving home. It’s a bellwether, a critical barometer of the broader U.S. stock market’s health and, by extension, a significant indicator of economic sentiment. The S&P 500, or Standard & Poor’s 500, is a stock market index that represents 500 of the largest publicly traded companies in the United States, selected by S&P Dow Jones Indices based on criteria such as market size, liquidity, and sector representation. Its performance today, like any given day, isn’t just a number; it’s a dynamic reflection of a complex interplay of economic data, corporate news, geopolitical events, and investor psychology.
Understanding how the S&P 500 is performing at any moment requires a grasp of what drives its movements and where to find reliable information. For long-term investors, daily fluctuations might seem like noise, yet even minor shifts can offer insights into underlying trends or market reactions to breaking news. For traders, “today’s performance” is the very essence of their strategy. Regardless of your investment horizon, knowing how to interpret the S&P 500’s daily pulse is a fundamental skill in personal finance and investing. This article will delve into the mechanisms behind its daily movements, provide an illustrative snapshot of how one might analyze its performance today, and offer practical advice for investors navigating its dynamic shifts.
Understanding the S&P 500’s Daily Pulse
The S&P 500 is not a static entity; it’s a living, breathing representation of market sentiment, constantly updated throughout the trading day. Its daily pulse is a rich tapestry woven from countless individual decisions, news headlines, and economic reports. To truly understand “how it’s doing today,” one must appreciate the forces that drive its moment-to-moment, hour-to-hour, and day-to-day fluctuations.
What Drives Daily Market Movements?
The daily movements of the S&P 500 are a consequence of a confluence of factors, each capable of swaying investor sentiment and, consequently, stock prices.
- Economic Data Releases: Every piece of economic data—from inflation reports (Consumer Price Index, Producer Price Index) and employment figures (non-farm payrolls, jobless claims) to GDP growth and manufacturing indices (ISM Manufacturing PMI)—can send ripples through the market. Positive data can signal a strong economy, potentially boosting corporate earnings and stock prices, while negative data can spark fears of recession or slower growth.
- Corporate Earnings and News: Individual companies within the S&P 500 frequently release earnings reports, guidance updates, merger and acquisition announcements, or product launches. While these primarily impact the individual company’s stock, the performance of major constituents (like Apple, Microsoft, Amazon, Google, Tesla) can significantly influence the broader index due to their large market capitalization. A wave of strong or weak earnings across multiple sectors can set the tone for the entire market.
- Geopolitical Events: International relations, political stability, trade disputes, or significant global events (such as conflicts or pandemics) can introduce uncertainty or opportunity, impacting investor confidence and capital flows. A sudden geopolitical development can quickly shift market sentiment from bullish to bearish, or vice-versa.
- Interest Rates and Monetary Policy: Decisions by central banks, particularly the U.S. Federal Reserve, regarding interest rates have a profound impact. Higher interest rates typically make borrowing more expensive, potentially slowing economic growth and making bonds more attractive relative to stocks. Conversely, lower rates can stimulate economic activity and make stocks more appealing. The Fed’s pronouncements are among the most closely watched events by market participants.
- Investor Sentiment and Technical Factors: Sometimes, market movements are driven less by fundamental news and more by collective investor psychology—fear, greed, optimism, pessimism. Technical analysis, which studies past market data, also plays a role as traders react to support and resistance levels, moving averages, and other patterns. Program trading and algorithmic strategies can also amplify daily movements.
Key Metrics to Watch
When assessing the S&P 500’s daily performance, several key metrics provide a comprehensive picture:
- Current Price/Index Level: This is the most straightforward indicator, showing the index’s value at any given moment. For example, an S&P 500 at 5,200 points.
- Percentage Change: More important than the raw point change is the percentage change from the previous day’s close. A 1% gain or loss is significant, while 0.1% might be considered flat.
- Points Change: The absolute change in points from the previous close. While less meaningful than the percentage change for comparison across different index levels, it still gives a sense of the day’s magnitude.
- Volume: The total number of shares traded for all companies in the index. High volume accompanying a significant price movement (up or down) suggests conviction behind that move. Low volume might indicate less conviction or a “wait-and-see” approach.
- Sector Performance: The S&P 500 is composed of 11 sectors (e.g., Technology, Healthcare, Financials, Energy). Observing which sectors are leading or lagging can reveal underlying trends, such as a rotation into defensive stocks during uncertainty or into growth stocks during optimism.
- Breadth Indicators: These measure how many stocks in the index are advancing versus declining. A strong up day with many more advancing stocks than declining stocks suggests broad market participation.
Where to Find Real-Time Data
Accessing real-time S&P 500 data is easier than ever. Reputable financial news websites (e.g., Bloomberg, Reuters, The Wall Street Journal, Yahoo Finance, CNBC), brokerage platforms, and even official index providers like S&P Dow Jones Indices offer up-to-the-minute quotes, charts, and news feeds. Many platforms also provide pre-market and after-hours trading data, offering an early glimpse into potential daily movements. Setting up a watchlist on your preferred platform or financial app is a simple way to monitor the S&P 500 and its key constituents throughout the trading day.
A Snapshot of Today’s Performance: An Illustrative Scenario
Since “today” is a moving target, let’s consider an illustrative scenario to demonstrate how the S&P 500 might perform on a hypothetical trading day. This approach helps to explain the dynamics involved without being constrained by actual real-time data. Imagine it’s a Tuesday, following a weekend of mixed economic news and leading into a major corporate earnings season.
Early Trading Hours: Setting the Tone
The market opens with a slight air of caution. Pre-market futures for the S&P 500 had been indicating a flat to slightly negative open, influenced by a weaker-than-expected manufacturing PMI report from Europe overnight and some lingering concerns about inflation from last week’s domestic data.
- 9:30 AM EST (Market Open): The S&P 500 opens down by approximately 0.2%, hovering around 5,200 points after closing at 5,210 yesterday. Initial trading volume is moderate. Energy stocks show some early strength, buoyed by a slight uptick in oil prices driven by geopolitical tensions in the Middle East. Tech stocks, particularly the mega-caps, are largely flat, suggesting investors are awaiting further catalysts.
- 10:00 AM EST: The release of the U.S. durable goods orders report shows a marginal improvement, slightly exceeding expectations. This positive surprise injects a small dose of optimism. The S&P 500 pares some of its early losses, climbing back to just 0.1% down. Financials and Industrials begin to tick up, reacting positively to the economic data.
- 11:00 AM EST: An analyst downgrade of a major consumer discretionary company creates a minor ripple, pulling that sector down slightly. However, the overall market remains resilient, with the broader S&P 500 continuing to trade in a tight range, indicating indecision as investors weigh the day’s early data.
Mid-Day Volatility and Sectoral Shifts
As the trading day progresses, new narratives emerge, and sectors begin to diverge more clearly, often driven by specific news or evolving investor sentiment.
- 12:30 PM EST: Rumors circulate about potential merger talks between two large healthcare companies. While unconfirmed, the healthcare sector experiences a noticeable surge, driving some upward momentum for the S&P 500, which briefly turns positive, up 0.05%. This highlights how speculative news can impact sentiment.
- 1:45 PM EST: A major tech company releases an unexpected positive outlook on its cloud computing division during an investor call. This sparks a rally in several cloud-related stocks within the S&P 500’s tech sector, pulling the overall index higher. Technology, which was initially flat, now leads the charge, signaling a “risk-on” appetite returning. The S&P 500 is now up about 0.3%.
- 2:30 PM EST: The gains are partially trimmed as a prominent Federal Reserve official gives a speech indicating a hawkish stance on inflation, reiterating that interest rate cuts might not be imminent. This creates a slight pullback, particularly impacting growth stocks sensitive to higher interest rates. The index retreats to a gain of around 0.15%. This showcases the immediate market reaction to monetary policy signals.
The Closing Bell: Reflecting the Day’s Narrative
The final hour of trading, often characterized by increased volume and volatility as investors square positions, consolidates the day’s narrative.
- 3:45 PM EST: “Window dressing” or last-minute institutional rebalancing might occur. In our scenario, with a mix of positive corporate news and hawkish Fed commentary, the market sees a final push from investors looking to position ahead of tomorrow’s major earnings release.
- 4:00 PM EST (Market Close): The S&P 500 closes the day up by 0.25%, settling at approximately 5,223 points. Technology and Healthcare sectors were the strongest performers, while Utilities and Consumer Staples (often considered defensive) saw slight declines. Trading volume was average, suggesting a decent level of participation but no overwhelming conviction in either direction. The day’s narrative suggests a market balancing cautious economic signals with company-specific positive news and a strong undercurrent of optimism in growth sectors, despite monetary policy concerns.
This illustrative scenario highlights how various factors converge to shape the S&P 500’s daily performance, resulting in a journey rather than a single static number.
Beyond Today: Contextualizing Short-Term Movements
While daily market movements are fascinating to observe and can provide immediate feedback, it’s crucial for investors to place them within a broader context. Focusing too narrowly on day-to-day fluctuations can lead to emotional decisions and a distorted view of long-term investment goals.
The Long-Term Perspective
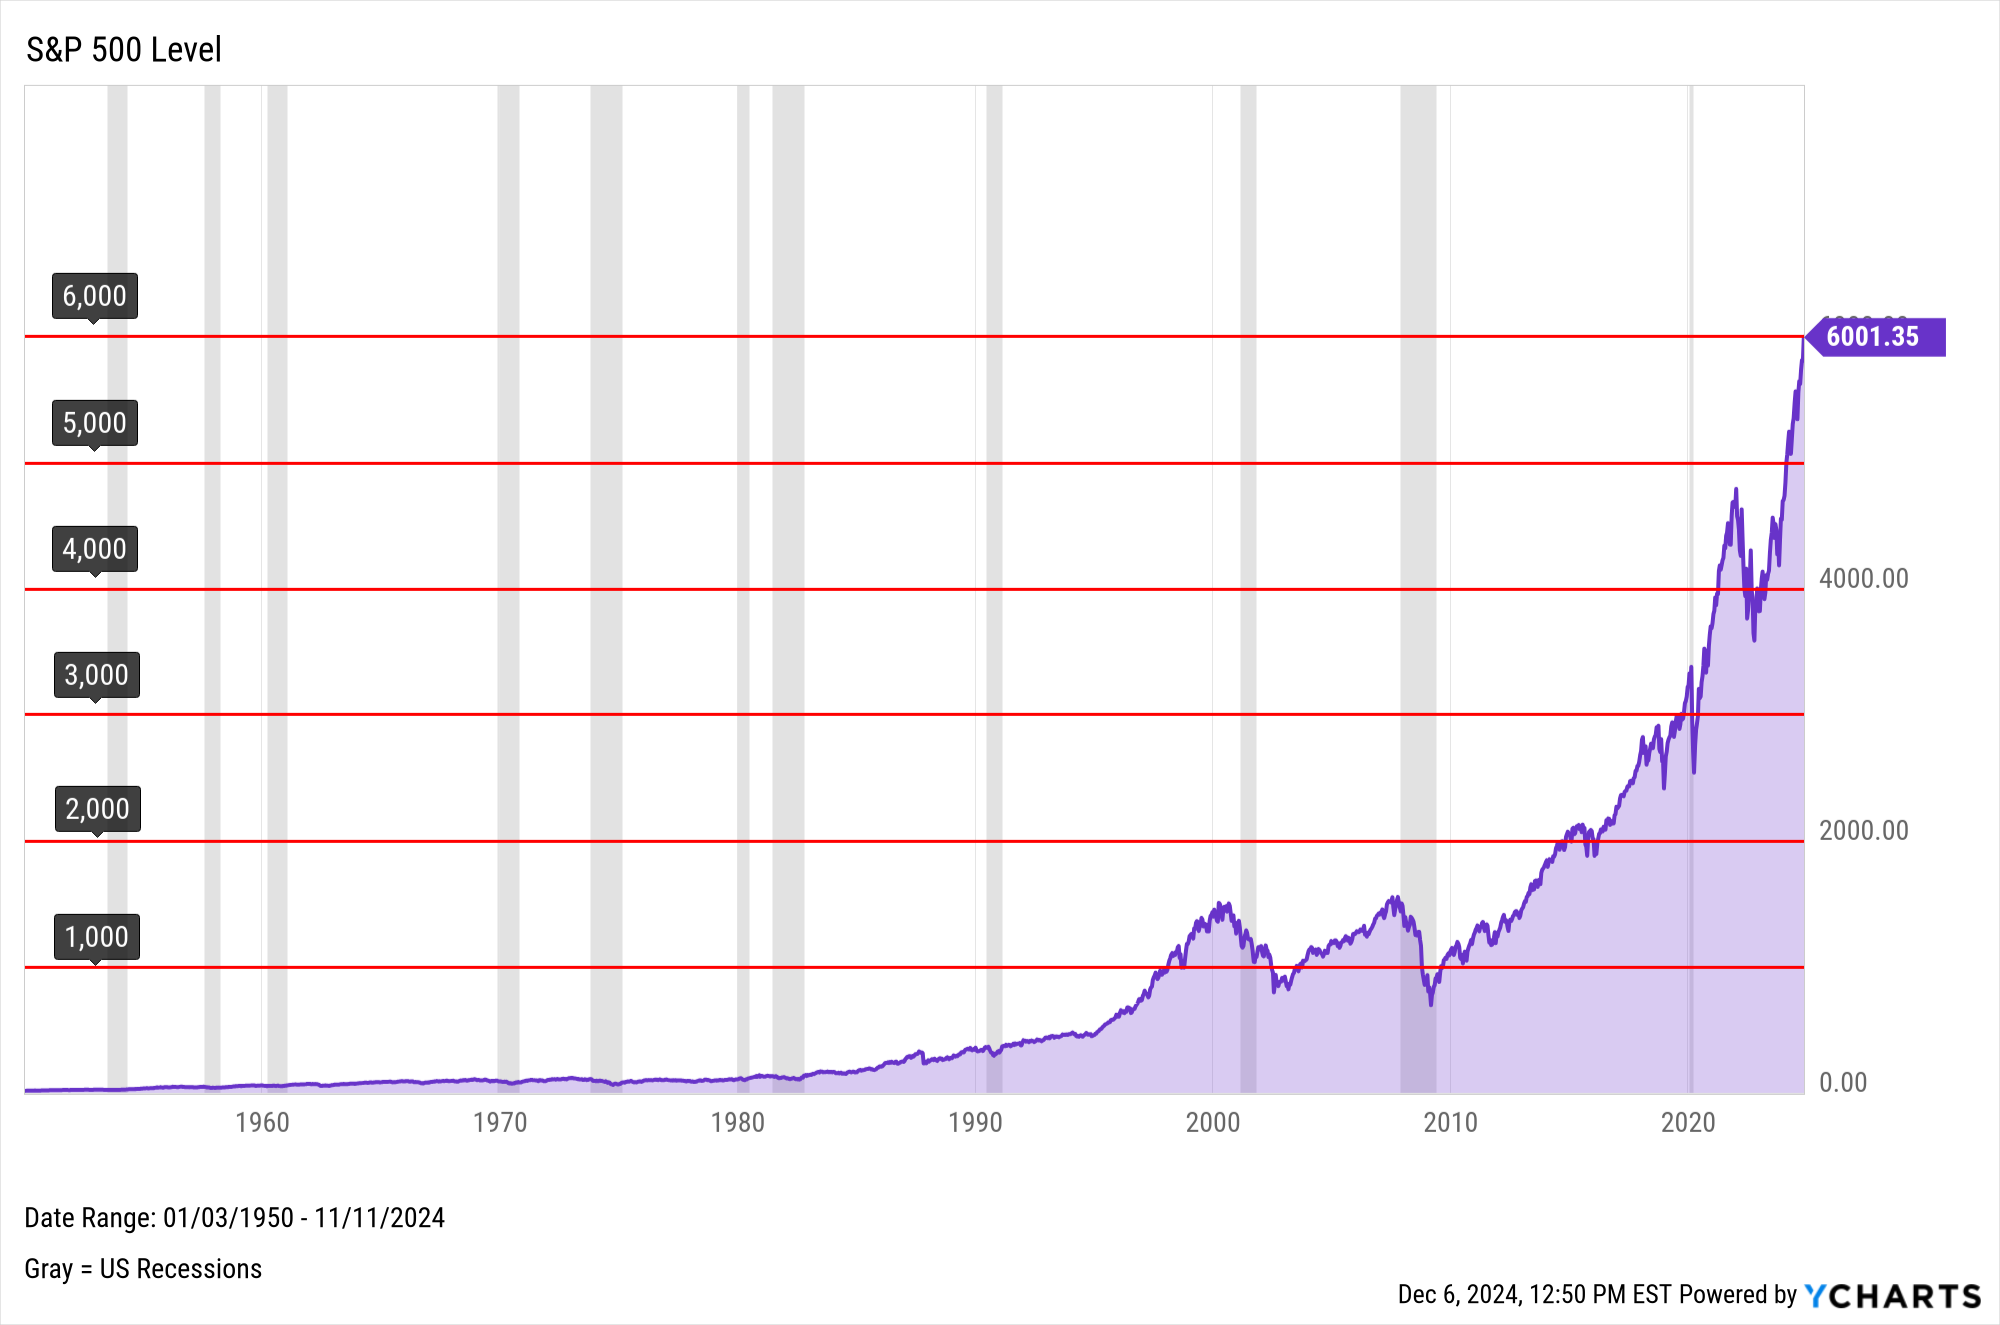
The S&P 500 has a remarkable long-term track record of growth. Despite numerous crashes, corrections, and volatile periods, its historical average annual return has been approximately 10-12% over many decades. This impressive performance is a testament to the resilience and innovation of American corporations and the underlying strength of the U.S. economy.
- Investing for Growth: Long-term investors, often referred to as buy-and-hold investors, understand that daily noise is just that—noise. Their strategy is to ride out the inevitable ups and downs, confident that over years and decades, the market will trend upwards.
- Compounding Returns: The power of compounding makes long-term investing incredibly effective. Reinvesting dividends and gains allows capital to grow exponentially over time, far outweighing the impact of any single day’s performance.
- Avoiding Market Timing: Trying to perfectly time the market—buying at the absolute bottom and selling at the absolute top—is notoriously difficult and often leads to missing out on the best performing days, which can significantly dampen long-term returns. A disciplined, consistent approach, such as dollar-cost averaging, tends to yield better results.
Impact on Different Investment Strategies
The significance of the S&P 500’s daily performance varies dramatically depending on an investor’s strategy:
- Day Traders: For day traders, “how the S&P 500 is doing today” is the primary information driving their decisions. They capitalize on minute-by-minute movements, seeking small gains on large volumes, often using leverage. Their focus is entirely on short-term volatility and intraday trends.
- Swing Traders: These investors look at trends over several days or weeks. Daily S&P 500 movements help them identify entry and exit points within these short-to-medium term trends.
- Long-Term Investors (e.g., Retirement Savers): For those investing for retirement or other distant goals, daily S&P 500 moves are largely irrelevant. Their focus is on asset allocation, diversification, and consistent contributions. They may glance at the daily numbers out of curiosity but rarely make portfolio changes based on them.
- Passive Investors (e.g., Index Fund Holders): Investors in S&P 500 index funds or ETFs are by definition embracing the long-term performance of the 500 companies. Their portfolios will directly mirror the index’s performance, so while they track it, they don’t react to daily changes.
- Active Fund Managers: These professionals constantly analyze daily S&P 500 movements and underlying sector performance to inform their decisions about which stocks to buy or sell to outperform the index.
Factors Influencing Future Outlook
While today’s performance is a snapshot, investors also look at broader macroeconomic themes and trends to gauge the S&P 500’s potential trajectory.
- Inflation Trends: Persistent high inflation erodes purchasing power and can lead central banks to maintain higher interest rates, which can be a headwind for stock valuations.
- Interest Rate Trajectory: The future path of interest rates (up, down, or stable) is a major determinant of equity valuations, affecting everything from corporate borrowing costs to the attractiveness of fixed-income alternatives.
- Corporate Earnings Growth: Ultimately, stock prices are tied to corporate profitability. The outlook for aggregate earnings growth across the S&P 500 companies is a critical driver of future performance.
- Global Economic Health: The U.S. economy does not operate in a vacuum. The health of major trading partners and global economic stability can significantly impact the S&P 500’s performance.
- Technological Innovation: Disruptive technologies and innovation continue to reshape industries, creating new market leaders and opportunities within the index.
Practical Steps for Investors
Monitoring the S&P 500 is a useful habit, but translating that information into smart financial decisions requires discipline and a strategic mindset. Overreacting to daily news is a common pitfall that can derail even the best-laid investment plans.
Monitoring Your Portfolio
For most investors, the S&P 500 serves as a benchmark rather than a direct investment in itself (unless investing in an S&P 500 index fund).
- Diversification is Key: Your personal portfolio, ideally diversified across various asset classes (stocks, bonds, real estate), geographies, and sectors, will likely not perfectly track the S&P 500’s daily movements. Some days it might outperform, other days underperform.
- Periodic Review, Not Daily Obsession: Instead of constantly checking your portfolio’s value against the S&P 500’s daily performance, schedule periodic reviews—quarterly or semi-annually. This allows you to assess your progress towards your long-term goals without getting caught up in short-term noise.
- Rebalancing: Use these periodic reviews to rebalance your portfolio if necessary, ensuring your asset allocation aligns with your risk tolerance and financial goals. If one asset class has significantly outperformed, you might trim it to maintain your target percentages.
Avoiding Emotional Decisions
The human brain is hardwired to react to immediate threats and rewards, which can be detrimental in investing.
- Fear of Missing Out (FOMO): A strong S&P 500 rally can trigger FOMO, leading investors to chase highly-valued assets. This often results in buying at a peak.
- Fear, Uncertainty, and Doubt (FUD): Conversely, a sharp market downturn can induce panic, causing investors to sell out of fear, often locking in losses.
- Stick to Your Plan: The most effective antidote to emotional decision-making is a well-defined investment plan. This plan should outline your financial goals, risk tolerance, asset allocation, and contribution schedule. When the market is volatile, refer back to your plan instead of reacting impulsively.
- Education: Understanding market history, the drivers of economic cycles, and the power of long-term investing can build resilience against emotional responses.

Leveraging Financial Tools and Advice
Modern financial technology and professional guidance can significantly enhance an investor’s ability to navigate market dynamics.
- Robo-Advisors: These automated platforms can manage diversified portfolios based on your risk profile, automatically rebalancing and optimizing for taxes. They remove the emotional element from investing.
- Financial Advisors/Planners: For more complex situations or personalized guidance, a human financial advisor can provide invaluable insights, help develop a tailored plan, and act as a behavioral coach during turbulent times.
- Analytical Platforms: Advanced platforms offer tools for technical analysis, fundamental research, and portfolio tracking, allowing investors to delve deeper into market data and make informed decisions.
- Educational Resources: Reputable financial websites, books, and courses offer continuous learning opportunities, empowering investors to understand the market better and refine their strategies.
The S&P 500’s daily performance is a dynamic snapshot, a complex mosaic of economic data, corporate news, and investor sentiment. While today’s numbers can offer immediate insights into market trends and reactions, they represent just one frame in a much longer movie. For the vast majority of investors, a focus on long-term goals, disciplined investing, and a diversified portfolio will always trump the allure of daily market speculation. By understanding the forces that drive the S&P 500, contextualizing its movements, and employing sound investment principles, you can transform daily market news from a source of anxiety into a valuable, albeit minor, piece of your broader financial strategy.
aViewFromTheCave is a participant in the Amazon Services LLC Associates Program, an affiliate advertising program designed to provide a means for sites to earn advertising fees by advertising and linking to Amazon.com. Amazon, the Amazon logo, AmazonSupply, and the AmazonSupply logo are trademarks of Amazon.com, Inc. or its affiliates. As an Amazon Associate we earn affiliate commissions from qualifying purchases.