
The Dow Jones Industrial Average (DJIA), often simply referred to as “the Dow,” stands as one of the most recognized and frequently cited stock market indices globally. For over a century, it has served as a barometer for the health and direction of the U.S. economy and its industrial giants. Yet, despite its pervasive influence and daily headlines, the precise method of its calculation remains a mystery to many. Unlike modern indices that employ complex market capitalization weighting, the DJIA utilizes a unique price-weighted methodology, adjusted by a crucial component known as the “Dow Divisor.” Understanding this calculation is essential not only for financial professionals but for any investor seeking a deeper insight into how this storied index reflects—or perhaps distorts—the broader market narrative. This article will demystify the DJIA’s calculation, explore its historical context, illuminate the intricacies of its adjustments, and compare its methodology to other major market benchmarks.
The Legacy and Lure of the Dow Jones Industrial Average
The DJIA’s enduring appeal lies in its simplicity and its profound historical significance. Conceived in a different era of finance, its foundational principles have been adapted over time, yet its core identity remains rooted in representing America’s industrial might.
A Historical Overview
The DJIA was first introduced on May 26, 1896, by Charles Dow, co-founder of Dow Jones & Company and editor of The Wall Street Journal. Initially, it comprised just 12 predominantly industrial stocks, reflecting the dominant economic sectors of the late 19th century—companies like General Electric (the only original component to remain on the index for over a century before its removal in 2018), U.S. Leather, and American Tobacco. Its original purpose was straightforward: to provide a clear, concise measure of the market’s overall performance, accessible to the average investor and businessman.
Over the decades, as the American economy diversified and evolved, so too did the DJIA. It expanded to 20 stocks in 1916 and finally to its current 30 components in 1928. These changes weren’t just about adding more companies; they reflected fundamental shifts in the industrial landscape, moving beyond heavy manufacturing to include technology, consumer goods, finance, and healthcare. This constant evolution, while maintaining its “industrial” moniker, has allowed the Dow to remain relevant as a snapshot of leading American corporations, rather than just traditional manufacturing firms.
Why the DJIA Remains Relevant
Despite its age and unique calculation method, the DJIA continues to hold significant sway in financial markets and public discourse. Its relevance stems from several key factors:
- Blue-Chip Representation: The 30 companies comprising the DJIA are typically large, well-established, and financially sound corporations with long histories of stable earnings and dividends. These “blue-chip” stocks are often bellwethers for their respective industries and the broader economy. Their performance can signal trends in consumer confidence, corporate profitability, and investor sentiment.
- Simplicity and Media Prominence: The DJIA’s point value is easy to understand and track. A 100-point gain or loss translates directly into a headline figure, making it a favorite for news outlets reporting on daily market movements. This pervasive media coverage reinforces its status as a primary market indicator.
- Historical Context: With over 120 years of data, the DJIA provides an unparalleled historical perspective on market cycles, economic expansions, and contractions. Analysts and economists often look to its long-term trends to contextualize current market conditions.
- Psychological Impact: For many, the Dow is synonymous with “the market.” Its movements, particularly significant upward or downward swings, can have a psychological impact on investors, influencing broader market sentiment and investment decisions.
While often critiqued for its limitations, the DJIA’s combination of historical legacy, representativeness of leading American firms, and media prominence ensures its continued role as a key benchmark in the financial world.
Deconstructing the Price-Weighted Average
At its core, the DJIA is a price-weighted index, a methodology that is less common in modern index construction but central to the Dow’s identity. Understanding this concept is critical to grasping how its value is determined.
The Fundamental Formula: Sum of Prices Divided by the Divisor
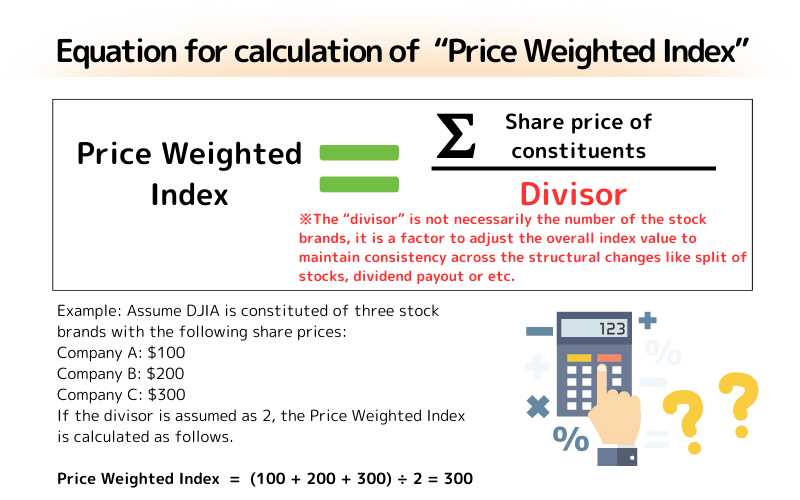
In its simplest form, a price-weighted average would be calculated by summing the prices of all constituent stocks and dividing by the number of stocks. When Charles Dow first conceived the index, this was essentially the method used.
If we had three stocks with prices $10, $20, and $30, the average would be ($10 + $20 + $30) / 3 = $20.
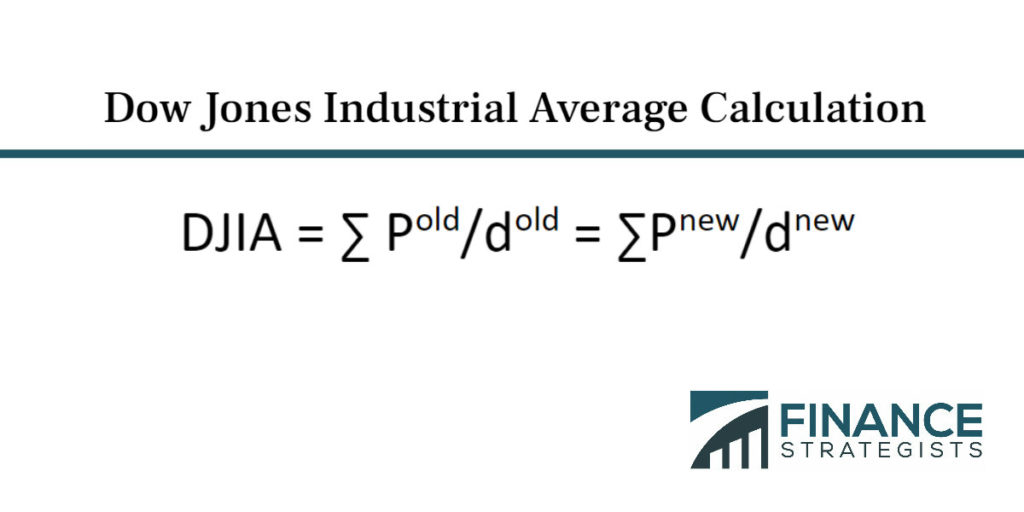
However, the DJIA’s calculation is not quite this simple today. The formula used for the DJIA is:
DJIA = (Sum of the prices of the 30 component stocks) / Dow Divisor
This brings us to the most crucial and unique aspect of the DJIA’s calculation: the Dow Divisor.
The Critical Role of the Dow Divisor
The Dow Divisor is a dynamic number that is adjusted periodically to ensure the continuity of the index’s value, preventing events like stock splits, mergers, or changes in index components from artificially altering the DJIA’s level. Without the divisor, a company splitting its stock (e.g., one share at $100 becoming two shares at $50 each) would immediately halve its contribution to the sum of prices, causing the entire index to drop dramatically even though the total market value of the company and the overall market sentiment haven’t changed.
Here’s how it works: When a corporate action or a change in index composition occurs, the divisor is adjusted so that the index value before the event is equal to the index value after the event.
For example, if the sum of prices is $3,000 and the Dow Divisor is 0.15, the DJIA is 20,000. If one stock in the index splits 2-for-1, its price might drop from $200 to $100. The new sum of prices would be $2,900. To keep the DJIA at 20,000, a new divisor (X) must be found:
$20,000 = $2,900 / X$
$X = $2,900 / $20,000 = 0.145$
So, the Dow Divisor would be adjusted from 0.15 to 0.145. This ensures that the index’s movement truly reflects the aggregate price changes of its components, rather than accounting for arbitrary corporate actions. The divisor has steadily decreased over time, from its initial value of 12 (corresponding to 12 stocks) to a number significantly less than 1 today (as of late 2023, it was around 0.1517). This low value means that every $1 change in the price of any single DJIA component stock results in an approximate 6.5-point movement in the index (1 / 0.1517 ≈ 6.59).
Adjustments and Evolution: Keeping the DJIA Relevant
The ongoing maintenance of the Dow Divisor is paramount to the integrity and relevance of the DJIA. It reflects the dynamic nature of financial markets and corporate structures, ensuring the index remains a true reflection of its components’ collective price movements.
Stock Splits and Corporate Actions
The most frequent reason for adjusting the Dow Divisor is stock splits. When a company announces a stock split (e.g., 2-for-1, 3-for-1), the number of outstanding shares increases, and the price per share decreases proportionally. Reverse stock splits (where shares are consolidated, and the price per share increases) also necessitate an adjustment. Similarly, large special dividends can also trigger divisor changes if they are substantial enough to be considered a significant distribution of capital rather than regular income. Mergers and spin-offs involving DJIA components are also situations where the divisor is re-evaluated to maintain continuity. Each time such an event occurs, the divisor is recalculated to neutralize its immediate impact on the index value. This sophisticated adjustment mechanism allows the DJIA to evolve without creating artificial volatility.
Managing Constituent Changes
Another significant reason for adjusting the Dow Divisor is when the composition of the index changes. The S&P Dow Jones Indices committee, which manages the DJIA, periodically reviews its components. While there are no strict quantitative rules for inclusion, the committee typically selects companies that have an excellent reputation, demonstrate sustained growth, are of interest to a large number of investors, and represent a significant portion of the U.S. economy. When a company is removed or added, the divisor must be adjusted.
For instance, if a company with a high stock price is replaced by one with a lower stock price, the sum of prices would naturally decrease. To prevent the DJIA from dropping simply due to this change in composition, the divisor is adjusted downwards. This ensures that any observed movement in the DJIA after a constituent change reflects actual market performance, not merely an administrative alteration. These changes usually occur infrequently but are closely watched as they can indicate shifts in economic leadership.
Limitations of the Price-Weighted Methodology
While the Dow Divisor cleverly mitigates artificial movements, the price-weighted methodology itself has inherent limitations that critics frequently point out:
- Disproportionate Influence of High-Priced Stocks: In a price-weighted index, a company with a higher stock price has a greater impact on the index’s movement than a company with a lower stock price, regardless of its market capitalization (total value). For example, if a $300 stock moves by 1%, it affects the index more than a $50 stock moving by 1%, even if the $50 stock represents a much larger company by market value. This means the Dow may not accurately reflect the overall performance of the underlying companies by their true economic weight.
- Small Number of Constituents: With only 30 stocks, the DJIA provides a concentrated view of the market. It doesn’t capture the broader diversity of the thousands of publicly traded companies in the U.S. economy. While its components are large-caps, it omits mid-cap and small-cap companies, and even many significant large-cap firms that don’t fit the committee’s selection criteria.
- “Industrial” Misnomer: The index is no longer purely “industrial” in the traditional sense, encompassing a wide range of sectors. While this makes it more relevant to the modern economy, the name can be misleading for newcomers.
These limitations are why many financial professionals prefer market capitalization-weighted indices for a more comprehensive view of market performance.
DJIA vs. Other Major Indices: A Comparative Look
To fully appreciate the DJIA, it’s helpful to understand how its unique methodology contrasts with other prominent market indices, particularly those that use market capitalization weighting.
Understanding Market Capitalization-Weighted Indices (S&P 500, Nasdaq Composite)
The vast majority of modern stock market indices, including the S&P 500 and the Nasdaq Composite, are market capitalization-weighted. In this methodology, a company’s influence on the index is proportional to its market capitalization (share price * number of outstanding shares). Larger companies, by market value, have a greater impact on the index’s performance than smaller companies.
- S&P 500: Comprising 500 large U.S. companies across various sectors, the S&P 500 is widely regarded as the best single gauge of large-cap U.S. equities and a strong indicator of the overall health of the U.S. stock market. Its market-cap weighting means that a 1% move in Apple (a company with a massive market cap) will have a significantly greater impact on the S&P 500 than a 1% move in a smaller S&P 500 component, even if their share prices are similar.
- Nasdaq Composite: This index includes virtually all stocks listed on the Nasdaq stock market. While it has a strong reputation for tech and growth stocks, it encompasses a wide range of industries. It is also market capitalization-weighted, meaning that the performance of large tech giants like Microsoft, Amazon, and Google (Alphabet) heavily influences its movements.
Why Different Methodologies Matter for Investors
The choice of index methodology directly impacts what an index represents and how investors interpret its movements:
- DJIA (Price-Weighted): Offers a snapshot of the aggregate price movements of 30 historically significant U.S. companies. It gives equal weight to a dollar change in any component’s stock price. Useful for understanding trends among a select group of blue-chip companies and for its historical continuity.
- S&P 500 (Market-Cap Weighted): Provides a broader, more diversified representation of the large-cap U.S. equity market. Its weighting scheme ensures that companies with greater economic significance (larger market values) have a proportionally greater impact on the index. This is often considered a more accurate reflection of “the market” for passive investing strategies.
- Nasdaq Composite (Market-Cap Weighted): Focuses on companies listed on the Nasdaq exchange, often associated with technology and growth sectors. It provides insights into the performance of a specific segment of the market.
For investors, understanding these distinctions is crucial. Relying solely on the DJIA for a comprehensive market view can be misleading due to its concentrated nature and price-weighting bias. A diversified approach often involves considering multiple indices to gain a complete picture of market dynamics.
Investing Implications and Strategic Insights
For investors and financial analysts, understanding how the DJIA is calculated goes beyond mere academic interest; it informs how the index is used as a tool for market analysis and investment strategy.
Using the DJIA as a Macroeconomic Barometer
Despite its limitations, the DJIA’s prominence means it cannot be ignored as a macroeconomic indicator. Its 30 components are typically robust, global companies whose earnings and growth are often tied to broader economic cycles. Therefore, significant movements in the DJIA can signal shifts in:
- Economic Sentiment: A consistently rising Dow often indicates optimism about corporate profits and economic growth, while sustained declines can suggest impending recessionary pressures or loss of confidence.
- Investor Behavior: The Dow’s movements can influence investor psychology. A strong Dow can encourage more speculative behavior, while a weak Dow can lead to risk aversion.
- Industry Trends: While broad, the composition of the Dow still reflects major sectors. Outsized performance from specific components can highlight trends in technology, healthcare, or financial services.
However, its use as a barometer should always be contextualized with other economic data and broader market indices to avoid drawing incomplete conclusions.
Considerations for Index-Based Investing
Investors looking to gain exposure to the DJIA’s performance typically do so through index funds or Exchange Traded Funds (ETFs) that track the index. These investment vehicles provide diversification across the 30 blue-chip stocks without needing to purchase each one individually.
When considering such investments, investors should be aware of:
- Concentration Risk: Investing in a DJIA-tracking fund means investing in only 30 companies. While these are large, stable firms, this still represents a concentrated portfolio compared to an S&P 500 fund. A significant downturn in one or two highly weighted (by price) DJIA components can have a disproportionate impact on the fund’s performance.
- Methodology Impact: The price-weighted nature of the DJIA means that higher-priced stocks will have a greater influence on the fund’s performance, regardless of their total market value. This might not align with a purely market-capitalization-based investment philosophy.
- Fees and Tracking Error: As with any index fund, investors should consider the expense ratios and the potential for tracking error (the difference between the fund’s return and the index’s return) associated with DJIA-specific products.
Despite these points, for investors seeking exposure specifically to a basket of prominent U.S. industrial and service-oriented giants, DJIA-tracking funds can be a viable option, often offering stability due to the mature nature of their underlying components.

Beyond the Number: The Qualitative Story
Ultimately, the DJIA is more than just a calculated number; it tells a qualitative story about American enterprise. Its components are often household names, companies that have shaped the economy and consumer experience for decades. Watching the Dow’s evolution through its component changes, its response to economic shocks, and its long-term growth trajectory provides a rich narrative of industrial innovation, corporate adaptation, and the enduring capitalist spirit. While its calculation method might seem antiquated compared to modern alternatives, its historical significance and psychological weight ensure its continued relevance as a crucial indicator in the complex tapestry of global finance.
The DJIA, with its peculiar price-weighted calculation and ever-evolving divisor, offers a unique lens through which to view the U.S. stock market. While not without its critics or limitations, understanding its methodology is key to appreciating its role as both a historical relic and a contemporary benchmark. For investors, financial enthusiasts, and casual observers alike, demystifying the “how” behind the Dow’s number provides a deeper, more informed perspective on this iconic measure of economic health and corporate prowess.
aViewFromTheCave is a participant in the Amazon Services LLC Associates Program, an affiliate advertising program designed to provide a means for sites to earn advertising fees by advertising and linking to Amazon.com. Amazon, the Amazon logo, AmazonSupply, and the AmazonSupply logo are trademarks of Amazon.com, Inc. or its affiliates. As an Amazon Associate we earn affiliate commissions from qualifying purchases.