
The Dow Jones Industrial Average (DJIA), often simply referred to as “the Dow,” stands as one of the most widely recognized and frequently cited stock market indices globally. For over a century, it has served as a bellwether for the health and direction of the U.S. stock market and, by extension, the broader American economy. However, despite its ubiquity in financial news and everyday conversations, the precise methodology behind its calculation often remains a mystery to many. Unlike more complex market-cap-weighted indices, the DJIA employs a unique, price-weighted average that, while seemingly straightforward, is underpinned by a critical component: the Dow Divisor. Understanding how the DJIA is calculated is not merely an academic exercise; it offers invaluable insight into its historical significance, its inherent limitations, and why it continues to capture the attention of investors and analysts worldwide. This deep dive into its mechanics reveals a calculation method that has adapted over time to maintain continuity and relevance in an ever-evolving market landscape.
Understanding the Dow Jones Industrial Average
The Dow Jones Industrial Average is more than just a number; it’s a historical artifact and a powerful symbol in the world of finance. Conceived in the late 19th century, its initial purpose was to provide a simple, digestible snapshot of the performance of leading American industrial companies.
A Legacy of Market Representation
Charles Dow, co-founder of Dow Jones & Company and editor of The Wall Street Journal, created the first version of the index in 1896. Initially comprising just 12 predominantly industrial stocks, it represented a nascent attempt to gauge the pulse of America’s burgeoning industrial might. Over the decades, the index expanded to 20, then 30 components, and its constituents have shifted dramatically to reflect changes in the economic landscape. From railroad companies and steel manufacturers to technology giants and pharmaceutical behemoths, the DJIA’s composition mirrors the evolving nature of American enterprise. This historical lineage imbues the Dow with a unique narrative power, allowing comparisons across generations of economic cycles.
What the DJIA Aims to Measure
At its core, the DJIA aims to capture the performance of a select group of “blue-chip” companies. These are typically large, well-established, and financially sound corporations that are leaders in their respective industries and broadly representative of the U.S. economy. The idea is that if these bellwether companies are performing well, it suggests a healthy economy and a strong stock market, and vice-versa. While its critics often point to its limited scope, the Dow’s enduring appeal lies in its simplicity and its ability to communicate a general market sentiment quickly. It’s often seen as a proxy for the overall market’s health, even if it doesn’t encompass the breadth of other indices.
The “Industrials” in Modern Context
Despite its name, the “Industrial” in Dow Jones Industrial Average is largely a historical anachronism. Today’s 30 components represent a diverse array of sectors, including technology, finance, healthcare, consumer goods, and even some actual industrial companies. For instance, Apple, Microsoft, Goldman Sachs, Johnson & Johnson, and Walt Disney are all current components. The selection committee, comprising editors of The Wall Street Journal and representatives of S&P Dow Jones Indices, periodically reviews and adjusts the components to ensure they remain relevant and reflective of the current U.S. economy. This ongoing curation ensures that the Dow, while rooted in history, remains a living, breathing indicator of contemporary economic forces.
The Core Calculation: A Price-Weighted Approach
Unlike the more prevalent market-capitalization-weighted indices (like the S&P 500), the DJIA utilizes a price-weighted methodology. This distinction is fundamental to understanding its behavior and implications.
Identifying the 30 Components
The first step in calculating the DJIA is, naturally, identifying the 30 constituent stocks. As mentioned, these are selected by a committee, not based on rigid quantitative criteria, but rather on qualitative judgments about a company’s reputation, sustained growth, investor interest, and industry representation. These companies are typically leaders in their fields and are traded on the New York Stock Exchange (NYSE) or NASDAQ. The selection process is not purely mechanical; it involves discretion, aiming to maintain the index’s prestige and relevance as a barometer of the U.S. stock market.
Simple Summation, Complex Nuances
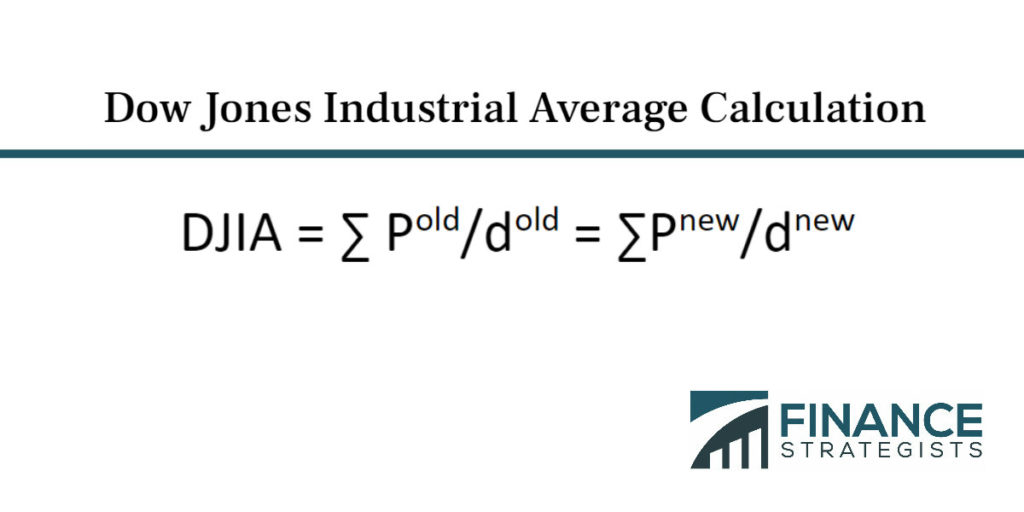
At its most basic level, the DJIA is calculated by summing the prices of the 30 component stocks and then dividing that sum by a unique number known as the “Dow Divisor.”
The formula appears deceptively simple:
DJIA = (Sum of the Prices of the 30 Stocks) / (Dow Divisor)
If, for instance, there were only two stocks in an index, priced at $100 and $200, and the divisor was 1, the index value would be 300. If the divisor was 2, the index value would be 150. This direct relationship means that a stock with a higher per-share price will have a greater impact on the index’s value than a stock with a lower per-share price, regardless of the company’s overall market capitalization. This is the defining characteristic of a price-weighted index.
Why Price-Weighting Matters (and its implications)
The price-weighted nature of the DJIA has significant implications. A $1 increase in the share price of a $300 stock will have the same absolute impact on the index value as a $1 increase in the share price of a $30 stock, even though the $300 stock only increased by 0.33% while the $30 stock increased by 3.33%. This means that companies with high stock prices wield disproportionate influence over the Dow’s movements compared to their lower-priced counterparts, even if the lower-priced company has a much larger total market capitalization (number of shares outstanding multiplied by share price).
For example, if Company A has a stock price of $300 and a market cap of $1 trillion, and Company B has a stock price of $50 and a market cap of $2 trillion, a $1 move in Company A’s stock price will affect the DJIA by the same amount as a $1 move in Company B’s stock price, despite Company B being twice as large by market capitalization. This can lead to situations where a relatively smaller company (by market cap) with a high share price drives the index more than a larger company with a lower share price. This characteristic is one of the most frequent points of criticism against the DJIA, as it doesn’t reflect the true economic weight of its constituent companies as accurately as market-cap-weighted indices.
The Indispensable Role of the Dow Divisor
While the summation of prices is straightforward, the Dow Divisor is the crucial element that ensures the index’s integrity and comparability over time. Without it, the index would become meaningless whenever corporate actions occur.
The Problem with Simple Averages

Imagine a simple index calculated by just adding up stock prices and dividing by the number of stocks (e.g., 30). If one of the component companies undergoes a stock split, say a 2-for-1 split, its share price would effectively halve, and its number of shares outstanding would double. While the company’s overall market capitalization and value to an investor remain unchanged, a simple average calculation would show a drastic, artificial drop in the index value. This would incorrectly suggest a market downturn when, in reality, no economic value has been lost. The Dow Divisor was invented precisely to counteract this problem and maintain the continuity of the index’s historical data.
How the Divisor Maintains Continuity
The Dow Divisor is a dynamic figure that adjusts to prevent such artificial fluctuations. Its primary function is to ensure that events like stock splits, mergers, spin-offs, and changes in the index components themselves do not distort the historical series of the DJIA. When one of these events occurs, the divisor is recalculated. The new divisor is set such that the index value before the corporate action is equal to the index value after the corporate action, using the new set of stock prices.
For instance, if the sum of prices before a 2-for-1 stock split was $X, and the index value was Y (using the old divisor Z), then after the split, the sum of prices becomes $X’ (lower due to the halved stock price). A new divisor Z’ is calculated such that ($X’ / Z’) = Y. This adjustment ensures that the index’s movement reflects actual market price changes and not mere corporate restructuring. The divisor is typically a small number, often less than one, and has continuously decreased over time as stock splits and other corporate actions have become more frequent. As of late 2023, the Dow Divisor was approximately 0.15. This small divisor means that a $1 change in any component’s stock price results in a movement of roughly 6.67 points (1/0.15) in the DJIA.
Tracking Divisor Changes: Corporate Actions
The Dow Divisor is not static; it is subject to changes driven by specific corporate events. These adjustments are meticulously calculated and applied by S&P Dow Jones Indices to ensure the integrity of the index. Without these precise adjustments, the DJIA’s long-term trend lines and daily movements would be incomparable and misleading. The historical record of the Dow Divisor itself provides a fascinating chronicle of the market’s evolution and the numerous corporate actions undertaken by its constituent companies over the decades.
Adjustments to the Divisor: Ensuring Accuracy and Comparability
The continuous refinement of the Dow Divisor is central to the index’s reliability. Several types of corporate actions necessitate an adjustment, each handled with a specific methodology.
Stock Splits and Reverse Splits
A stock split is the most common reason for a divisor adjustment. When a company announces a 2-for-1 split, for example, its stock price is halved, and the number of shares doubles. To prevent the DJIA from artificially dropping, the divisor is adjusted downwards. The new divisor is calculated by taking the sum of prices after the split and dividing it by the index value before the split. A reverse stock split, where a company consolidates shares (e.g., 1-for-2), causes the stock price to double and the divisor to adjust upwards using the same logic. These adjustments ensure that the DJIA reflects actual market performance, not just changes in share structure.
Spin-offs and Special Dividends
When a company spins off a subsidiary into a new, independently traded company, or issues a significant special dividend, these events can reduce the stock price of the parent company without an immediate corresponding market event reflecting a loss of value. To maintain the index’s continuity, the Dow Divisor is adjusted to account for the value distributed through the spin-off or special dividend. The process ensures that the index level before and after the event remains consistent, reflecting only changes due to market forces.
Component Changes: Additions and Removals
The selection committee periodically replaces components to maintain the index’s relevance. When a company is added to or removed from the DJIA, the divisor must be recalculated. If a new, higher-priced stock replaces a lower-priced one, the divisor needs to be adjusted upwards to prevent an artificial jump in the index value. Conversely, if a lower-priced stock replaces a higher-priced one, the divisor is adjusted downwards. This ensures that the index level on the day of the change is not altered by the substitution itself, but rather by the market’s reaction to the new composition. These changes are typically announced in advance to allow market participants to prepare.
Mergers and Acquisitions
When two DJIA components merge, or when a component acquires another company, this can also trigger a divisor adjustment. If one component absorbs another that is not in the index, the share count or pricing of the remaining component might change, necessitating an adjustment. If two DJIA components merge, one will likely be removed, and a new company will be added, which falls under component changes. In all these scenarios, the overarching goal of the divisor adjustment is to neutralize the impact of these corporate actions on the index level, ensuring that any reported change in the DJIA genuinely reflects market price movements of the underlying basket of stocks.
Criticisms, Limitations, and Enduring Relevance
Despite its venerable status and widespread recognition, the DJIA is not without its detractors and inherent limitations. Understanding these helps to contextualize its role in financial analysis.
The Price-Weighted Paradox
The primary criticism leveled against the DJIA is its price-weighted methodology. As discussed, a stock’s influence on the index is solely determined by its per-share price, not by its overall market capitalization. This means a company with a high share price but a relatively small market value could sway the index more than a behemoth with a lower share price but a massive market cap. Critics argue that this provides a distorted view of the overall market, as it does not accurately reflect the true economic weighting of the companies represented. In an era where market-capitalization-weighted indices (like the S&P 500 or the NASDAQ Composite) are standard, the DJIA’s idiosyncratic calculation method stands out as less representative of the broader market’s value.
Limited Scope and Representation
Another significant limitation is the DJIA’s narrow scope. With only 30 companies, it represents a tiny fraction of the thousands of publicly traded companies in the U.S. stock market. While these 30 are typically large, influential “blue chips,” they cannot fully capture the dynamism, breadth, or specific sector performance of the entire market. For instance, small-cap companies, mid-cap companies, and emerging growth sectors are largely unrepresented. This makes the DJIA a less comprehensive gauge compared to broader indices that include hundreds or even thousands of stocks. Relying solely on the DJIA for market analysis can lead to an incomplete picture, missing significant movements in other market segments.

The DJIA’s Continued Influence in Financial Discourse
Despite these criticisms, the DJIA has maintained an unparalleled cultural and financial relevance. Its simplicity makes it easily understandable for the general public, and its long history provides a compelling narrative for tracking economic trends over generations. For many, “the Dow” remains the first point of reference for understanding daily stock market movements. Its enduring presence in headlines and financial reports underscores its role as a psychological benchmark, influencing investor sentiment and economic forecasting. While sophisticated investors and analysts often prefer broader, market-cap-weighted indices for detailed analysis and portfolio benchmarking, the DJIA continues to serve as an accessible, quick-reference indicator of the health of large American corporations. Its calculation, while unique and somewhat antiquated, is a testament to its evolution and its continuous adaptation to remain a relevant voice in the intricate symphony of global financial markets. Understanding its mechanics, therefore, is crucial for anyone seeking a comprehensive grasp of financial market dynamics and the indicators that shape them.
aViewFromTheCave is a participant in the Amazon Services LLC Associates Program, an affiliate advertising program designed to provide a means for sites to earn advertising fees by advertising and linking to Amazon.com. Amazon, the Amazon logo, AmazonSupply, and the AmazonSupply logo are trademarks of Amazon.com, Inc. or its affiliates. As an Amazon Associate we earn affiliate commissions from qualifying purchases.