
For over a century, the Dow Jones Industrial Average (DJIA) has stood as an iconic barometer of the U.S. stock market’s health, a number frequently cited in financial news and dinner table discussions alike. Often simply referred to as “the Dow,” its movements are scrutinized by investors, economists, and the general public seeking to understand the pulse of the American economy. Yet, despite its omnipresence, the precise methodology behind its calculation remains a mystery to many. Unlike more common market capitalization-weighted indices, the DJIA employs a unique price-weighted average, a characteristic that significantly influences its composition and interpretation.
Understanding how the Dow is calculated is not merely an academic exercise; it offers crucial insights into what this venerable index truly represents, its strengths, and its limitations. It reveals why a hundred-point swing in the Dow today is vastly different in meaning from a hundred-point swing decades ago, and why the performance of a single high-priced stock can have a disproportionate impact on its daily fluctuations. This deep dive will unravel the intricacies of the Dow’s computation, from its foundational principles to the continuous adjustments that maintain its relevance in a dynamic financial landscape, equipping you with a clearer perspective on this cornerstone of American finance.
Demystifying the Dow Jones Industrial Average (DJIA)
To grasp the mechanics of the Dow’s calculation, one must first appreciate its historical context and fundamental purpose. The DJIA is more than just a number; it’s a legacy.
What is the DJIA?
The Dow Jones Industrial Average (DJIA) is a stock market index that measures the stock performance of 30 large companies listed on stock exchanges in the United States. It is one of the oldest, best-known, and most frequently used market indices in the world. The “Industrial” in its name is largely historical; while it once primarily tracked heavy industrial companies, today it includes a diverse array of corporations from various sectors, reflecting the evolution of the American economy. Its primary function is to serve as a bellwether, offering a snapshot of the general market trend and investor sentiment.
A Brief History and Its Significance
Conceived by Charles Dow, co-founder of Dow Jones & Company and editor of The Wall Street Journal, the DJIA was first published on May 26, 1896. Initially, it comprised just 12 predominantly industrial stocks. Dow’s vision was to create a straightforward indicator that could track the performance of the leading companies of the era, providing a simple yet effective measure of the market’s direction. Over the decades, it expanded to 20 stocks in 1916 and finally to its current 30 components in 1928. Its long history gives it a unique significance, allowing for comparisons across economic cycles, technological revolutions, and geopolitical shifts, making it a powerful tool for historical analysis of market trends.
The “Blue-Chip” Benchmark
The companies included in the DJIA are often referred to as “blue-chip” stocks. This term denotes large, well-established, financially sound companies with a history of stable earnings and reliable performance. They are typically leaders in their respective industries and are household names. The selection of these 30 companies is crucial because the Dow aims to represent the broad health and direction of the U.S. economy, as reflected by its largest and most influential corporations. Being part of the Dow is a prestigious recognition, often associated with stability and investor confidence.
The Unique Calculation Method: A Price-Weighted Index
The most distinctive feature of the DJIA, and often the source of confusion, is its price-weighted calculation method. This approach sets it apart from the majority of modern market indices.
Contrast with Market-Cap Weighted Indices
Most major stock market indices today, such as the S&P 500 or the Nasdaq Composite, are market capitalization-weighted. In these indices, companies with larger market capitalizations (stock price multiplied by the number of outstanding shares) have a greater influence on the index’s movement. A 1% change in Apple’s stock price, for instance, would have a much larger impact on the S&P 500 than a 1% change in a smaller company’s stock, simply because Apple has a much larger market cap.
The DJIA, however, operates differently. It is a price-weighted index, meaning that stocks with higher share prices have a greater impact on the index’s value than stocks with lower share prices, regardless of their total market capitalization. A one-dollar change in the stock price of a company trading at $300 will have three times the impact on the Dow as a one-dollar change in a company trading at $100, even if the $100 stock represents a much larger company by market value. This fundamental difference is key to understanding the Dow’s behavior.
The Role of the Dow Divisor
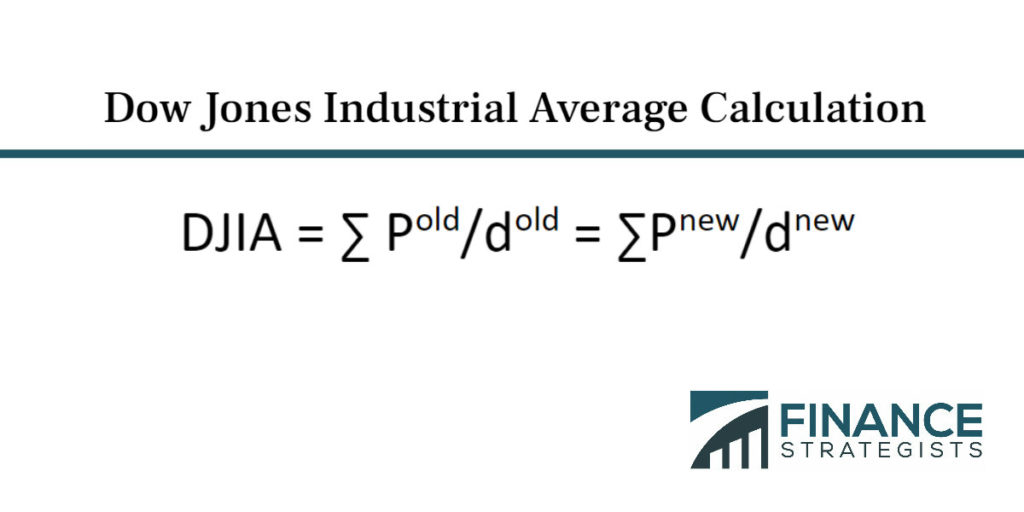
At its core, the DJIA’s calculation is a simple average of its component stock prices, but with a critical adjustment factor: the Dow Divisor. If the Dow were a simple sum of 30 stock prices, it would be heavily distorted by events like stock splits, mergers, or changes in component companies. For example, if a stock trading at $300 splits 2-for-1, its price would drop to $150. A simple sum would incorrectly show the Dow falling significantly, even though no actual value was lost by investors.
To prevent such artificial fluctuations and maintain historical continuity, the Dow Divisor is adjusted. It’s not a fixed number; rather, it’s a dynamic value that changes whenever there’s a stock split, a spin-off, a special dividend, or when a company is added or removed from the index. The divisor’s purpose is to ensure that these corporate actions or index composition changes do not, by themselves, alter the numerical value of the DJIA.
The formula for the Dow is:
DJIA = (Sum of the prices of the 30 component stocks) / Dow Divisor
As of early 2024, the Dow Divisor hovers around 0.1517. This means that for every $1 change in the price of any of the Dow’s 30 stocks, the DJIA changes by approximately 1/0.1517, or about 6.59 points. This fixed point value per dollar change is another unique characteristic of the Dow’s price-weighted system.
Understanding the Price-Weighted Logic
The logic behind price-weighting, while less common today, stems from Charles Dow’s original intent to create a straightforward, easily calculable average that reflected the general trend of “leading” companies. In an era before sophisticated computing, a simple sum and a divisor were practical. While it means a company like UnitedHealth Group (often one of the highest-priced components) has a far greater influence on the Dow’s movements than, say, Intel (a lower-priced component), this system provides a distinct perspective. It highlights the movements of high-priced individual shares, which historically were often indicative of mature, stable companies. Critics argue this can skew the index, giving undue weight to price over overall company value, but proponents maintain it offers a unique, long-standing gauge of specific market behavior.
The Companies Behind the Average: Selection and Evolution
The Dow’s credibility rests heavily on the quality and representativeness of its 30 component companies. The selection process is neither purely quantitative nor set in stone.

Who Decides? S&P Dow Jones Indices Committee
The decision of which companies are included in the DJIA rests with the Averages Committee, part of S&P Dow Jones Indices. This committee has significant discretion, aiming to ensure the index accurately reflects the broad U.S. stock market and economy. Their choices are not bound by rigid rules, allowing for flexibility to adapt to changing economic landscapes. This differentiates the DJIA from many other indices that follow strict, transparent rules for inclusion.
Criteria for Inclusion
While not explicitly formalized, the committee generally considers several qualitative factors when selecting companies:
- Reputation and Significance: Components are expected to be large, established, and reputable companies with an excellent reputation. They should be leaders in their industry and important to a substantial number of investors.
- Broad Investor Interest: The stock should be widely held by institutional and individual investors.
- Economic Representation: The committee strives to include companies that represent a significant portion of the U.S. industrial economy, aiming for a diverse sector representation. However, it’s not a sector-balanced index in the way some others are.
- Historical Continuity: While changes are necessary, the committee generally prefers to maintain a stable list of components to preserve the historical integrity and comparability of the index.
Companies from the transportation and utilities sectors are explicitly excluded, as they are covered by separate Dow Jones Transportation Average and Dow Jones Utility Average indices.
Notable Changes and Their Impact
The composition of the DJIA has evolved dramatically since its inception. Companies like U.S. Steel and General Electric (an original component that was removed in 2018 after over a century) have given way to tech giants like Apple and Microsoft, and healthcare leaders like Johnson & Johnson and UnitedHealth Group. These changes reflect the shifting tides of American industry, from manufacturing and heavy industry to technology, finance, and services. Each time a company is added or removed, it often generates significant market interest and discussion, as it signals a shift in what is considered representative of the leading edge of the U.S. economy. The continuous evolution ensures that despite its historical roots, the Dow remains a relevant indicator of contemporary market trends.
Adjustments and Maintenance: Keeping the Index Relevant
The Dow Divisor is the unsung hero that ensures the DJIA remains a consistent and comparable measure over time, despite the myriad corporate actions that would otherwise distort it.
Stock Splits and Dividends: Why They Matter
When a company undergoes a stock split (e.g., a 2-for-1 split), the number of outstanding shares doubles, and the price per share is halved. From an investor’s perspective, the total value of their holdings remains unchanged. However, in a price-weighted index like the Dow, a halving of a stock’s price would incorrectly make the index appear to fall significantly. Similarly, reverse stock splits, special cash dividends, or spin-offs (where a company distributes shares of a subsidiary to its shareholders) would also artificially alter the index’s value.
To counter these effects, the Dow Divisor is adjusted. Before the corporate action takes place, the committee calculates a new divisor that ensures the index’s value remains exactly the same immediately before and after the event. For example, if a company in the Dow splits its stock, the new divisor will be lower than the old one, effectively balancing out the lower stock price to keep the index value constant.
Mergers, Acquisitions, and Spin-offs
When a Dow component company is acquired by another entity, or when it merges with another company, its status in the index must be reviewed. Often, the acquired company is replaced in the index. Similarly, if a Dow component spins off a major part of its business into a separate publicly traded company, the committee must decide whether both entities should remain, or if one should be replaced. These events trigger a re-evaluation of the index’s composition and, frequently, an adjustment to the Dow Divisor to ensure continuity. The goal is always to avoid any artificial jump or drop in the index’s value due solely to the corporate action itself.
The Divisor’s Dynamic Role in Preserving Continuity
The Dow Divisor is not a static figure. It has been continually reduced over the decades, reflecting the numerous stock splits and component changes that have occurred. When the DJIA first began, the divisor was simply the number of stocks (12). Today, it is a small fraction. This dynamic adjustment is what allows the Dow to maintain its historical integrity. Without the divisor, comparing the DJIA from 1950 to today would be meaningless, as the numerical value would be distorted by countless corporate events. Its continuous recalculation ensures that movements in the Dow genuinely reflect changes in the underlying stock prices, rather than administrative or corporate restructuring.
Interpreting the DJIA: Beyond the Number
While the Dow’s calculation methodology is unique, its true value to investors lies in its interpretation. Understanding its strengths and limitations is key to using it effectively.
What the DJIA Tells Investors (and What It Doesn’t)
The DJIA provides a quick and easily digestible snapshot of how a select group of leading U.S. companies are performing. Its movements can signal broad investor sentiment and confidence. A significant upward trend in the Dow often suggests economic optimism, while a sustained decline can indicate market nervousness or recessionary fears. It’s a useful historical indicator and a benchmark for general market direction.
However, due to its price-weighted nature and limited number of components, the Dow is not always the most comprehensive indicator. It tells you about the performance of 30 specific, high-profile companies, but it doesn’t necessarily reflect the performance of smaller companies, emerging industries, or the broader market as a whole, which might be better represented by indices like the Russell 2000 (small-cap) or the Nasdaq Composite (technology-heavy).
Limitations as a Broad Market Indicator
The primary criticism of the DJIA as a broad market indicator stems from its small sample size (30 companies) and its price-weighted calculation. The 30 companies, while influential, do not encompass the vast diversity of the U.S. economy, which comprises thousands of publicly traded companies. Furthermore, the price-weighted methodology means that a stock like Apple, despite its immense market capitalization, might have less impact than a higher-priced but smaller company simply because of its per-share price. This can lead to a skewed representation where the index’s movements might be heavily influenced by a handful of high-priced stocks, rather than a broad cross-section of the market. For investors seeking a truly comprehensive view of the entire U.S. equity market, broader, market-capitalization-weighted indices like the S&P 500 (which tracks 500 large-cap companies) are generally considered more representative.

Its Enduring Relevance in Modern Finance
Despite its limitations and the rise of more sophisticated indices, the DJIA retains an undeniable relevance. Its historical depth makes it invaluable for long-term economic analysis. It serves as a widely recognized benchmark for institutional funds and individual portfolios, offering a readily understandable measure of market performance. For many, “the Dow” remains synonymous with the stock market itself, capturing the public’s imagination and serving as a touchstone for financial news and commentary. Its ability to represent the performance of leading blue-chip companies continues to offer a specific, albeit narrow, lens through which to view the health of the American corporate giants that drive a significant portion of the nation’s economy.
In conclusion, the Dow Jones Industrial Average is a financial icon with a unique method of calculation. Its price-weighted formula, dynamically managed by the Dow Divisor, allows it to provide a continuous, historically comparable measure of 30 leading U.S. companies. While it has its limitations as a broad market indicator, its enduring presence and distinct perspective make understanding its calculation fundamental for anyone navigating the world of finance and investing. It is a testament to resilience and adaptation, much like the market it strives to represent.
aViewFromTheCave is a participant in the Amazon Services LLC Associates Program, an affiliate advertising program designed to provide a means for sites to earn advertising fees by advertising and linking to Amazon.com. Amazon, the Amazon logo, AmazonSupply, and the AmazonSupply logo are trademarks of Amazon.com, Inc. or its affiliates. As an Amazon Associate we earn affiliate commissions from qualifying purchases.