
Inflation, a term frequently debated in economic circles and kitchen tables alike, represents the rate at which the general level of prices for goods and services is rising, and subsequently, the purchasing power of currency is falling. While its effects are palpable—from the cost of groceries to the price of a new car—the precise methods by which this pervasive economic phenomenon is measured are often less understood. For individuals managing personal budgets, businesses planning investments, and governments formulating monetary policy, a clear comprehension of how inflation is calculated is not merely academic; it is foundational to sound financial decision-making. This article delves into the intricate mechanisms and key metrics employed to quantify inflation, providing a professional and insightful guide to this critical financial indicator.
Understanding the Essence of Inflation
Before dissecting the methodologies, it’s crucial to grasp what inflation truly signifies and why its accurate measurement is paramount. It is more than just a fleeting observation of higher prices; it is a systemic economic force.
Defining Inflation: More Than Just Rising Prices
At its core, inflation is a sustained increase in the aggregate price level of an economy over a period. This means that, on average, a unit of currency buys fewer goods and services than it did previously. It’s a broad phenomenon, distinguishing it from an increase in the price of a single product or service due to supply chain issues or increased demand for that specific item. True inflation reflects a general erosion of purchasing power across a wide spectrum of goods and services. Conversely, deflation, a much rarer and often more damaging economic event, refers to a general fall in prices.
The causes of inflation are complex, often attributed to factors such as demand-pull (too much money chasing too few goods), cost-push (increased production costs passed onto consumers), or even expectations-driven inflation (when people expect prices to rise, they demand higher wages, leading businesses to increase prices further). Regardless of its origin, the consistent monitoring of inflation is essential for economic stability.
The Impact of Inflation: Why Measurement Matters
The precise measurement of inflation holds profound implications for virtually every economic participant. For households, unchecked inflation erodes savings, diminishes the real value of fixed incomes, and makes long-term financial planning challenging. A retiree on a fixed pension, for instance, will find their purchasing power steadily declining if inflation outpaces their income adjustments.
For businesses, inflation impacts operational costs, pricing strategies, investment decisions, and ultimately, profitability. High inflation creates uncertainty, making it difficult to forecast future expenses and revenues. It can also influence interest rates, making borrowing more expensive. For investors, understanding inflation is key to preserving and growing capital. Real returns—the return after accounting for inflation—are what truly matter. An investment yielding 5% nominal return when inflation is 3% only provides a 2% real return.
At a macroeconomic level, central banks like the Federal Reserve utilize inflation data to guide monetary policy. Their primary mandate often includes maintaining price stability, typically targeting a specific annual inflation rate (e.g., 2%). If inflation is too high, central banks may raise interest rates to cool down the economy; if it’s too low or trending towards deflation, they might lower rates or implement other stimulus measures. Accurate calculation thus serves as the compass for navigating the vast sea of economic policy.
The Core Mechanism: Measuring Consumer Price Changes
The most widely recognized and frequently cited measure of inflation is based on consumer prices. This approach aims to capture the average change over time in the prices paid by urban consumers for a “basket” of consumer goods and services.
The Consumer Price Index (CPI): A Primary Tool
In many countries, including the United States, the Consumer Price Index (CPI) is the flagship metric for consumer inflation. Published monthly by statistical agencies (e.g., the Bureau of Labor Statistics – BLS in the U.S.), the CPI measures the average change over time in the prices paid by urban consumers for a market basket of consumer goods and services. This basket includes everything from food and energy to housing, medical care, education, and apparel.
There are different variations of the CPI. For instance, in the U.S., the CPI for All Urban Consumers (CPI-U) represents about 93% of the total U.S. population and is the most commonly reported figure. There is also the CPI for Urban Wage Earners and Clerical Workers (CPI-W), which pertains to a smaller demographic.
Constructing the “Basket of Goods and Services”
The concept of a “basket of goods and services” is central to the CPI’s methodology. This basket is a theoretical collection of items and services that a typical household regularly purchases. The composition of this basket is determined through extensive surveys of consumer spending habits, such as the Consumer Expenditure Survey conducted by the BLS. These surveys identify what urban households buy, how much they buy, and where they buy it.
The basket is not static; it is periodically updated to reflect changes in consumer behavior, technological advancements, and the introduction of new products. For example, decades ago, the basket might not have included smartphones or internet services, but these are now essential components of modern household spending. The items in the basket are also weighted according to their share of an average household’s total expenditure. Housing, for instance, typically has a much larger weight than entertainment or apparel, meaning a change in housing costs will have a more significant impact on the overall CPI than a similar percentage change in the price of clothing.
Data Collection: From Stores to Surveys
Once the basket’s composition and weights are established, the next crucial step is data collection. Price data is collected continuously by trained data collectors who visit or call thousands of retail stores, service establishments, rental units, and doctor’s offices across various cities and regions. For certain items, prices might be collected through surveys or online sources.
The goal is to collect prices for the same items each month to accurately track price changes. If an item is no longer available or has undergone a significant change (e.g., a new model of a car with added features), statisticians employ complex methods to adjust for these changes to ensure that the CPI is measuring “pure” price change rather than a change in quality. This meticulous data collection process ensures the robustness and reliability of the CPI.
Deconstructing the CPI Calculation
With the data collected, the actual calculation of the CPI, and subsequently the inflation rate, involves a series of sophisticated statistical processes.
The Formula: A Weighted Average
The CPI is essentially a weighted average of prices. The formula typically takes the form of:
CPI (Current Period) = (Cost of Basket in Current Period / Cost of Basket in Base Period) * 100
To calculate the “Cost of Basket,” each item’s price is multiplied by its quantity (or weight derived from spending shares) and summed up. For example, if a household spends $500 on housing and $100 on food, housing would have five times the weight of food. A 10% increase in housing costs would have a greater impact on the overall CPI than a 10% increase in food prices.
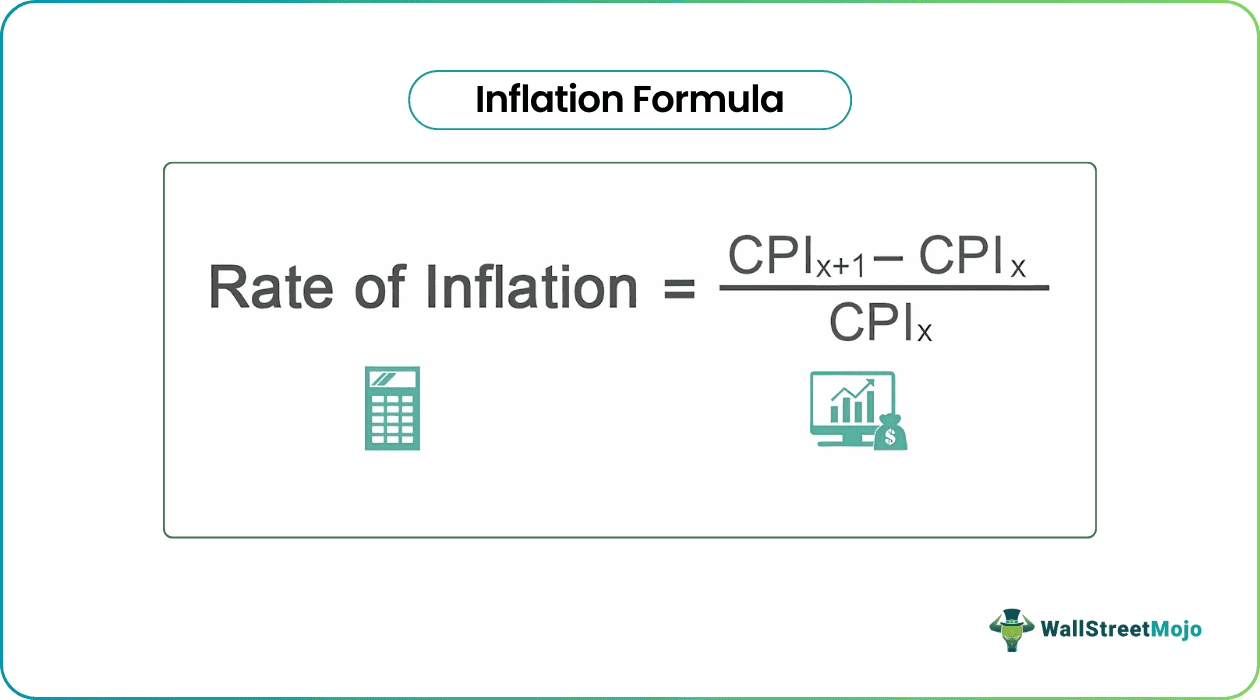
Once the CPI is calculated for two different periods (e.g., this month and last month, or this year and last year), the inflation rate can be determined using the following formula:
Inflation Rate = ((CPI in Current Period – CPI in Previous Period) / CPI in Previous Period) * 100

This percentage figure is what is commonly reported as the inflation rate. It indicates how much prices have risen or fallen over the specified period.
Base Period Selection and Indexing
A critical component of the CPI calculation is the “base period.” The base period is a reference period (often a single year or an average of several years) for which the CPI is set to 100. All other CPI values are then expressed relative to this base. For instance, if the CPI for a given month is 110, it means that prices have, on average, increased by 10% since the base period. If it’s 95, prices have, on average, decreased by 5% since the base period.
The base period provides a consistent benchmark for comparing price levels over time. It’s not about the absolute price in the base period but establishing a starting point for measuring subsequent percentage changes.
Accounting for Quality Changes and Substitutions
One of the most challenging aspects of calculating inflation accurately is adjusting for quality changes and consumer substitutions.
- Quality Adjustments: Products frequently improve in quality or add new features. A computer today, for example, is significantly more powerful and capable than one from a decade ago, even if the nominal price is similar or lower. If not adjusted, improvements in quality would make it seem like prices are rising faster than they truly are for a comparable level of utility. Statistical agencies use complex “hedonic regression” models and other methods to estimate the value of these quality improvements and subtract them from the observed price change. This ensures that the CPI reflects the price of a constant quality good or service.
- Consumer Substitutions: When the price of one good rises significantly, consumers often substitute it with a cheaper alternative (e.g., buying chicken instead of beef, or a generic brand instead of a name brand). The fixed-basket approach of the CPI, if not periodically updated, can overstate inflation because it assumes consumers continue to buy the more expensive item even after alternatives become more attractive. To address this, statistical agencies employ techniques like “chained CPI” which allows for adjustments to the basket over time to account for substitution effects, providing a more accurate reflection of the cost of living.
Beyond the CPI: Other Inflation Metrics
While the CPI is the most prominent measure of consumer inflation, other indices offer different perspectives on price changes within the economy. These complementary metrics provide a more comprehensive view of inflationary pressures.
Producer Price Index (PPI): Tracing Costs at the Wholesale Level
The Producer Price Index (PPI), also published by the BLS, measures the average change over time in the selling prices received by domestic producers for their output. Unlike the CPI, which tracks prices from the consumer’s perspective, the PPI tracks prices from the producer’s perspective. It covers goods and services at various stages of production, from crude materials to intermediate goods and finished goods.
The PPI is often considered a leading indicator of consumer inflation. Increases in the PPI can signal that producers are facing higher costs, which they may eventually pass on to consumers in the form of higher retail prices, thus impacting the CPI in subsequent months. It’s a vital gauge for businesses monitoring their input costs and for analysts forecasting future inflation trends.
Personal Consumption Expenditures (Price Index) (PCE): The Fed’s Preferred Gauge
The Personal Consumption Expenditures (PCE) price index is compiled by the Bureau of Economic Analysis (BEA) and is derived from national income and product accounts data. While similar to the CPI in measuring consumer price changes, the PCE has some key differences that make it the preferred inflation measure for the Federal Reserve.
- Broader Coverage: The PCE covers a wider range of goods and services than the CPI, including expenditures made on behalf of consumers by third parties (e.g., employer-provided health insurance).
- Weighting: The PCE uses a chained Fisher index, which allows for more frequent reweighting of the basket to reflect shifts in consumer spending patterns and substitution effects more readily than the fixed-weight CPI. This tends to make the PCE inflation rate slightly lower and more stable than the CPI.
- Quality Adjustments: Both indices apply quality adjustments, but their specific methodologies can differ.
The Fed finds the PCE to be a more comprehensive and flexible measure of underlying inflation trends, particularly the “core PCE,” which excludes volatile food and energy prices.
Core Inflation: Stripping Out Volatility
Both the CPI and PCE are often reported in two forms: “headline” inflation and “core” inflation. Headline inflation includes all items in the basket, while core inflation excludes the highly volatile components of food and energy. Food and energy prices can fluctuate dramatically due to temporary supply shocks (e.g., weather events affecting crops, geopolitical events impacting oil supply) that do not necessarily reflect sustained underlying inflationary pressures in the broader economy.
By stripping out these volatile components, core inflation provides a clearer signal of persistent, longer-term price trends, making it a valuable tool for central banks aiming to discern the true direction of inflation and formulate appropriate monetary policy without overreacting to transient price movements.
The Broader Implications of Inflation Measurement
The meticulous calculation and understanding of various inflation metrics transcend mere economic accounting; they are fundamental to how economies function, policies are set, and individuals plan their financial futures.
Guiding Monetary Policy and Economic Decisions
Central banks worldwide rely heavily on inflation data to make crucial monetary policy decisions. As mentioned, maintaining price stability is a key objective, and consistent inflation at a targeted rate (often around 2%) is generally considered healthy for economic growth. If inflation is persistently above target, central banks might raise interest rates, tighten credit conditions, and reduce the money supply to cool down the economy. Conversely, if inflation is too low or deflationary risks emerge, they might lower rates, ease credit, and increase the money supply to stimulate spending and investment. Accurate inflation measures ensure these powerful levers are applied judiciously.
Governments also use inflation figures for fiscal planning, setting budgets, and evaluating the health of the national economy. Businesses use this data for strategic planning, pricing products, negotiating supplier contracts, and making investment decisions regarding expansion or new ventures.
Adjusting Wages, Benefits, and Contracts
Inflation metrics play a direct role in various contractual agreements and government programs. Many collective bargaining agreements include cost-of-living adjustments (COLAs) tied to the CPI, ensuring that workers’ wages keep pace with inflation and their purchasing power is maintained. Social Security benefits and military pensions, for example, are often indexed to the CPI, providing an automatic adjustment mechanism to protect recipients from inflationary erosion.
Long-term leases, supply contracts, and even some financial instruments may include clauses that automatically adjust payments based on changes in a specific inflation index. This mechanism helps to distribute the risks of inflation more equitably among parties.

Impact on Investment Strategies and Personal Finance
For individuals, understanding inflation calculation is vital for effective personal finance and investment planning. It influences the real return on savings and investments, the true cost of borrowing, and the feasibility of long-term financial goals like retirement planning or saving for a child’s education.
- Savings: High inflation erodes the value of cash and low-interest savings accounts.
- Investments: Investors often seek assets that can outpace inflation, such as inflation-indexed bonds (e.g., TIPS), real estate, or equities in companies with strong pricing power.
- Debt: While inflation can reduce the real burden of fixed-rate debt over time, it can also lead to higher interest rates on new borrowing.
Financial advisors utilize inflation forecasts and historical data to help clients set realistic goals, choose appropriate investment vehicles, and build portfolios designed to protect and grow wealth in real terms.
In conclusion, the calculation of inflation is a complex yet indispensable process in the modern financial world. From the meticulous construction of a consumer basket to sophisticated statistical adjustments for quality and substitution, the various indices—primarily the CPI and PCE—provide the foundational data upon which monetary policy is shaped, economic decisions are made, and personal financial strategies are developed. Understanding “how inflation is calculated” is not just about comprehending an economic indicator; it’s about grasping a fundamental force that touches every aspect of our financial lives.
aViewFromTheCave is a participant in the Amazon Services LLC Associates Program, an affiliate advertising program designed to provide a means for sites to earn advertising fees by advertising and linking to Amazon.com. Amazon, the Amazon logo, AmazonSupply, and the AmazonSupply logo are trademarks of Amazon.com, Inc. or its affiliates. As an Amazon Associate we earn affiliate commissions from qualifying purchases.