
In the intricate world of finance, where numbers dictate decisions and influence fortunes, understanding percentages isn’t merely a mathematical skill; it’s a critical cornerstone of financial literacy. From personal budgeting and savvy shopping to sophisticated investment strategies and robust business analysis, percentages serve as the universal language that translates complex financial data into digestible, actionable insights. Without a firm grasp of how to calculate, interpret, and apply percentages, individuals and businesses alike risk making suboptimal choices that can significantly impact their financial well-being. This comprehensive guide delves into the essence of percentages, demonstrating their omnipresence across the financial spectrum and equipping you with the knowledge to wield them confidently for personal wealth building, smart spending, and robust business management.

The Foundational Role of Percentages in Financial Literacy
At its core, a percentage is a way of expressing a number as a fraction of 100. It allows for standardized comparison, making it an indispensable tool for financial analysis, regardless of the absolute figures involved. Mastering this fundamental concept is the first step toward true financial acumen.
Demystifying the “What” and “Why” of Percentages
A percentage (represented by the symbol %) literally means “per hundred.” So, 50% means 50 out of 100, or 50/100. This standardized expression is vital because it provides context. For example, knowing that a stock gained $5 doesn’t tell you much without knowing its initial price. If it gained $5 from a $10 stock, that’s a 50% increase – a significant jump. If it gained $5 from a $1000 stock, that’s a mere 0.5% increase – a much less impactful change. Percentages offer a relative measure, allowing for direct comparison across different scales and magnitudes. This comparative power is why financial reports, economic indicators, and personal financial goals are almost always framed in percentages.
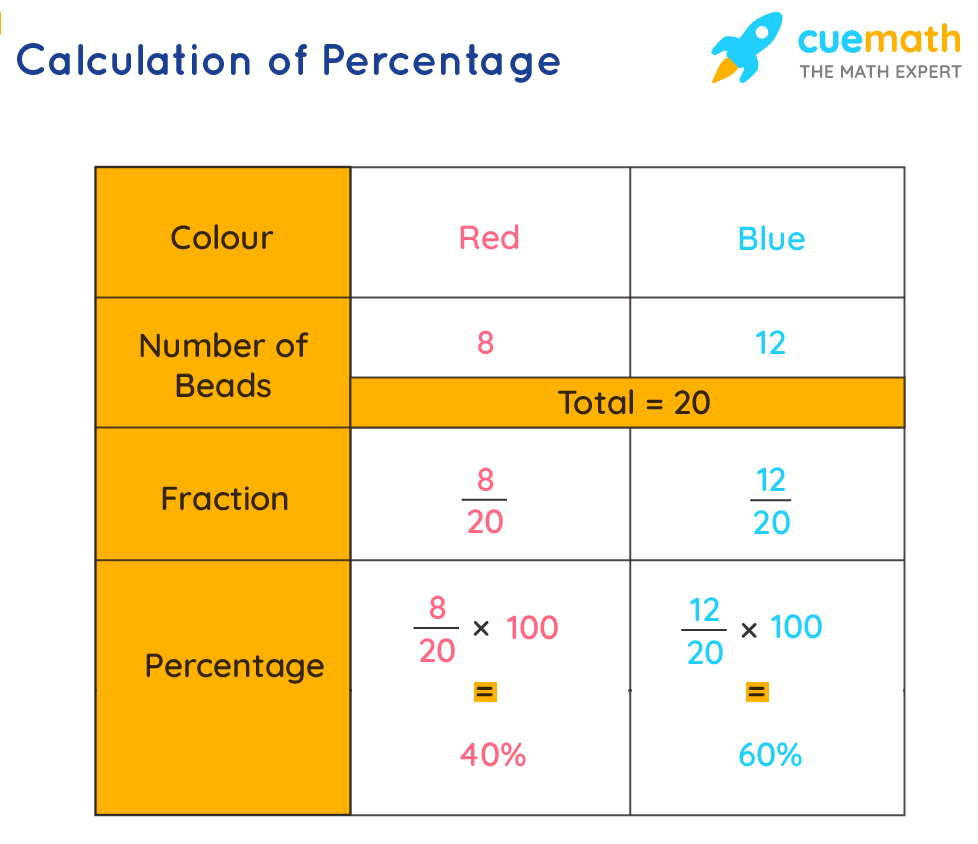
The Universal Formula: Part / Whole x 100
The beauty of percentage calculation lies in its simplicity and universality. Regardless of the financial context, the core formula remains the same:
Percentage = (Part / Whole) x 100
Let’s break this down with a simple financial example:
Imagine you spent $300 on groceries in a month, and your total monthly income is $3000.
-
Part: The amount spent on groceries ($300)
-
Whole: Your total monthly income ($3000)
Using the formula:
Percentage of income spent on groceries = ($300 / $3000) x 100 = 0.1 x 100 = 10%.
This formula is the bedrock upon which all other percentage-based financial calculations are built, from calculating discounts to determining investment returns or profit margins.
Common Pitfalls and Precision in Financial Calculations
While the formula is straightforward, missteps can occur. A common pitfall is confusing the “part” with the “whole” or incorrectly identifying the base amount. For instance, if an item originally cost $100 and is now $80, the discount is $20. The percentage discount is ($20 / $100) x 100 = 20%. However, if you incorrectly used $80 as the ‘whole’, you’d get ($20 / $80) x 100 = 25%, which is incorrect for a discount from the original price.
Another crucial aspect is precision. In finance, rounding too early or too aggressively can lead to significant discrepancies, especially with large sums or over extended periods (like compound interest). Always aim for a sufficient number of decimal places during intermediate calculations and round only at the final step, or according to specific financial reporting standards. Understanding basis points (one hundredth of a percentage point) is also essential in some financial contexts, emphasizing the need for precision.
Practical Applications in Personal Finance Management
Percentages are an invisible hand guiding countless personal financial decisions. From daily spending to long-term savings, a solid understanding allows for greater control and optimization of your money.
Decoding Discounts, Sales, and Effective Savings
Every consumer encounters percentages through sales, discounts, and rebates. Knowing how to quickly calculate these can significantly impact your purchasing power.
-
Calculating a discount: If a shirt costs $50 and is marked 20% off, the discount amount is $50 x 0.20 = $10. The new price is $50 – $10 = $40.
-
Calculating percentage change: If an item’s price increases from $40 to $50, the absolute increase is $10. The percentage increase is ($10 / $40) x 100 = 25%. This helps you understand the true impact of price changes on your budget.
Savvy shoppers often use percentages to compare deals across different stores or to assess the true value of a “bundle” offer versus individual purchases.
Navigating Loans, Interest Rates, and Credit Card APRs
One of the most critical areas where percentages dominate is in debt management. Interest rates are expressed as percentages and directly determine the cost of borrowing money.
-
Annual Percentage Rate (APR): This is the total cost of a loan or credit card, expressed as a yearly percentage. Understanding APR helps you compare different credit products and grasp the long-term cost of carrying a balance. For instance, a credit card with a 20% APR means you’ll pay 20% of your outstanding balance in interest over a year if you don’t pay it off.
-
Calculating interest paid: If you borrow $10,000 at a 5% simple annual interest rate, you’ll owe $10,000 x 0.05 = $500 in interest for that year. For more complex loans like mortgages, understanding how percentages contribute to principal and interest payments over decades is vital for financial planning.
Budgeting, Expense Allocation, and Income Distribution
Effective budgeting relies heavily on percentages to allocate income and track spending. Many financial advisors recommend specific percentage breakdowns for budgeting, such as the 50/30/20 rule (50% for needs, 30% for wants, 20% for savings/debt repayment).
-
To apply this, if your monthly net income is $4,000:
-
Needs: $4,000 x 0.50 = $2,000
-
Wants: $4,000 x 0.30 = $1,200
-
Savings/Debt: $4,000 x 0.20 = $800
-
This percentage-based approach makes budgeting flexible and scalable, adapting to different income levels while maintaining healthy financial habits.
Understanding Taxes, Tips, and Gratuities
Percentages are also central to calculating taxes and gratuities.
-
Sales Tax: If an item costs $100 and the sales tax is 8%, you pay $100 x 0.08 = $8 in tax, for a total of $108.
-
Income Tax: Your income tax rate is a percentage of your taxable income. Understanding marginal tax rates (the percentage applied to the last dollar earned) is crucial for financial planning and maximizing deductions.
-
Tips/Gratuities: In many service industries, tipping is customary, typically ranging from 15% to 20% of the bill. For a $75 restaurant bill, a 15% tip would be $75 x 0.15 = $11.25. Being able to quickly calculate these percentages ensures fair compensation for service providers and accurate budgeting for personal expenses.
Percentages as the Compass in Investing and Wealth Growth
For investors, percentages are the primary metrics for evaluating performance, managing risk, and strategizing for long-term wealth accumulation. From portfolio construction to gauging returns, percentages are indispensable.
Calculating Return on Investment (ROI) and Capital Gains
One of the most fundamental metrics in investing is the Return on Investment (ROI), expressed as a percentage.
ROI = [(Current Value – Original Cost) / Original Cost] x 100
If you bought shares for $1,000 and sold them for $1,200, your ROI is [($1,200 – $1,000) / $1,000] x 100 = 20%.
Capital gains, the profit from selling an asset, are often discussed in terms of their percentage of the original investment, directly informing taxable income and investment success.
Strategic Portfolio Allocation and Diversification
Smart investors use percentages to allocate their assets across different investment classes (stocks, bonds, real estate, cash) to manage risk and optimize returns. This is known as portfolio allocation. For example, a common strategy for a younger investor might be 70% stocks, 20% bonds, and 10% cash, while an older investor might shift towards 40% stocks, 50% bonds, and 10% cash. These percentages are not arbitrary; they reflect an investor’s risk tolerance, time horizon, and financial goals. Diversification, spreading investments to reduce risk, is also measured by the percentage of the portfolio allocated to various sectors, industries, or geographies.
The Magic of Compound Growth and Annualized Returns
The concept of compound interest, where interest earns interest, is often described as the “eighth wonder of the world.” Its power is best understood through percentages. An investment growing at a modest 7% annually can double in approximately ten years due to compounding.
-
Compound Annual Growth Rate (CAGR): This metric provides a smoothed annualized return over a specified period longer than one year, helping investors understand the consistent growth rate of an investment despite yearly fluctuations. It’s calculated as:
CAGR = [ (Ending Value / Beginning Value)^(1 / Number of Years) – 1 ] x 100
Understanding and utilizing CAGR allows investors to set realistic expectations and project future wealth accumulation with greater accuracy.
Analyzing Dividend Yields and Investment Fees
Percentages are also crucial for evaluating the income-generating potential of investments and the costs associated with them.
-
Dividend Yield: This is the annual dividend payment per share divided by the share price, expressed as a percentage. It tells investors how much income they can expect relative to the investment’s cost. A stock trading at $100 with an annual dividend of $4 has a 4% dividend yield.
-
Expense Ratios: For mutual funds and ETFs, the expense ratio is the annual fee charged as a percentage of your total investment. Even seemingly small percentages (e.g., 0.5% vs. 1.5%) can accumulate to hundreds of thousands of dollars over decades due to their compounding negative effect on returns. Savvy investors pay close attention to these percentages to minimize costs and maximize net returns.
Driving Business Success and Online Income with Percentages
In the business world, percentages are the lifeblood of financial reporting, strategic planning, and operational analysis. They provide the insights needed to gauge performance, identify trends, and make informed decisions.
Measuring Profitability: Gross, Operating, and Net Margins
Businesses use various profit margins, all expressed as percentages, to assess their financial health and efficiency.
-
Gross Profit Margin: (Gross Profit / Revenue) x 100. This indicates how much profit a company makes from its sales after accounting for the direct costs of producing goods or services.
-
Operating Profit Margin: (Operating Income / Revenue) x 100. This reveals a company’s profitability after covering operating expenses (like salaries and rent) but before interest and taxes.
-
Net Profit Margin: (Net Income / Revenue) x 100. This is the ultimate measure of profitability, showing the percentage of revenue left after all expenses, including taxes and interest, have been deducted.
These percentages allow businesses to benchmark against competitors, track performance over time, and identify areas for cost reduction or revenue enhancement.
Tracking Growth: Sales Increases and Market Share Shifts
Growth is often measured in percentages. A company’s sales growth is typically reported as the percentage increase from one period to another.
-
Sales Growth Percentage: [(Current Period Sales – Previous Period Sales) / Previous Period Sales] x 100. This metric is crucial for understanding market dynamics and a company’s competitive position.
-
Market Share: Expressed as a percentage, market share represents a company’s sales as a proportion of the total sales in its industry. For example, if a company sells $10 million in a market with total sales of $100 million, its market share is 10%. Tracking changes in market share is a key indicator of competitive success or failure.
Understanding Commissions, Royalties, and Revenue Splits
Many business models, especially in online income generation and creative industries, rely on percentages for compensation.
-
Commissions: Salespeople often earn a percentage of the sales they generate (e.g., a 10% commission on a $1,000 sale is $100).
-
Royalties: Authors, musicians, and inventors typically receive a percentage of the revenue generated from their work (e.g., a 5% royalty on book sales).
-
Revenue Splits: Partnerships, affiliates, and co-founders often divide profits or revenue based on agreed-upon percentages. Understanding these percentages is vital for calculating potential earnings and negotiating fair terms.
Pricing Strategies and Discounting Models
Businesses strategically use percentages in their pricing and discounting models to attract customers, clear inventory, and maximize profitability.
-
Markup Percentage: This is the percentage added to the cost of a product to arrive at its selling price. If an item costs $10 to make and is sold for $15, the markup is $5, which is ($5 / $10) x 100 = 50%.
-
Promotional Discounts: Offering a “15% off” sale is a common strategy. Businesses must calculate the impact of such discounts on their profit margins to ensure profitability while attracting customers. Percentage-based pricing structures are foundational to nearly every retail and service industry.
Tools and Techniques for Efficient Percentage Calculation
While the basic formula is simple, financial complexities often demand more sophisticated tools and efficient techniques for accurate and timely percentage calculations.
Leveraging Spreadsheets for Complex Financial Modeling
For individuals managing detailed budgets or small business owners tracking intricate financial metrics, spreadsheet software like Microsoft Excel or Google Sheets is invaluable. These tools allow you to:
-
Automate calculations: Enter the formula once, and it automatically updates as you change input values.
-
Perform scenario analysis: Easily see how changes in one percentage (e.g., interest rate) impact others (e.g., monthly payment).
-
Build dashboards: Create visual representations of financial percentages (e.g., pie charts of budget allocation) for quick comprehension.
Spreadsheets empower users to build sophisticated financial models that go far beyond simple percentage calculations, enabling deeper insights into financial performance and projections.
Online Calculators and Specialized Financial Apps
The digital age offers a plethora of specialized tools tailored for specific financial percentage calculations:
-
Loan and Mortgage Calculators: Instantly determine monthly payments, total interest paid, and amortization schedules based on interest percentages.
-
Investment Return Calculators: Project the future value of investments, calculate CAGR, and understand the impact of compounding.
-
Budgeting Apps: Many personal finance apps automatically categorize expenses and display them as percentages of your income, helping you stick to your financial goals.
These tools are particularly useful for quick checks and for visualizing the long-term effects of various percentage-based financial decisions without manual calculations.
Quick Mental Math and Estimation Strategies
While precise calculations are often necessary, developing the ability to quickly estimate percentages through mental math can be incredibly useful in everyday financial scenarios.
-
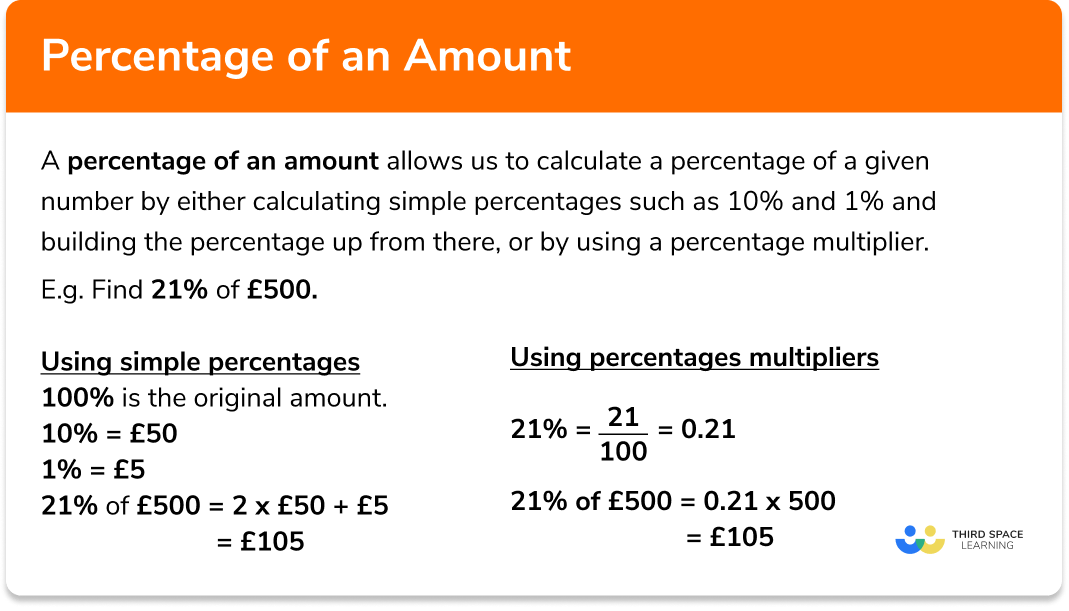
Estimating 10%: To find 10% of a number, simply move the decimal point one place to the left (e.g., 10% of $75 is $7.50).
-
Estimating 20%: Double the 10% figure (e.g., 20% of $75 is $15).
-
Using benchmarks: For tipping, 15% is typically 10% plus half of 10%. For a $75 bill, 10% is $7.50, half of that is $3.75, so 15% is $7.50 + $3.75 = $11.25.
These quick estimation techniques allow you to make rapid, informed decisions, whether you’re at the grocery store, a restaurant, or evaluating a quick financial proposal.
Empowering Your Financial Journey with Percentage Proficiency
The ability to “find percentage” is far more than a basic arithmetic skill; it is a fundamental pillar of financial literacy that permeates every facet of personal and business finance. From the smallest daily transactions to the most significant investment decisions, percentages provide clarity, context, and control. By mastering the core formula, understanding its diverse applications, and leveraging available tools, you unlock the power to interpret financial data critically, make informed choices, and strategically navigate the complex financial landscape. Embracing percentage proficiency isn’t just about crunching numbers; it’s about empowering yourself to achieve greater financial stability, growth, and independence, turning raw data into meaningful insights that propel you toward your financial aspirations.
aViewFromTheCave is a participant in the Amazon Services LLC Associates Program, an affiliate advertising program designed to provide a means for sites to earn advertising fees by advertising and linking to Amazon.com. Amazon, the Amazon logo, AmazonSupply, and the AmazonSupply logo are trademarks of Amazon.com, Inc. or its affiliates. As an Amazon Associate we earn affiliate commissions from qualifying purchases.