
Graphing mathematical equations is a fundamental skill across various scientific and engineering disciplines, providing visual insights into complex relationships. Among the most iconic and frequently encountered equations is the simple yet profound quadratic function, y = x². Understanding how to graph this foundational parabola, and more importantly, how to leverage modern digital tools to do so efficiently and accurately, is an essential aspect of digital literacy in mathematics. This article will serve as a professional and insightful tutorial, guiding you through the process of graphing x² using a range of technological aids, from traditional graphing calculators to advanced web-based applications and AI-driven platforms.
The Enduring Significance of y = x²
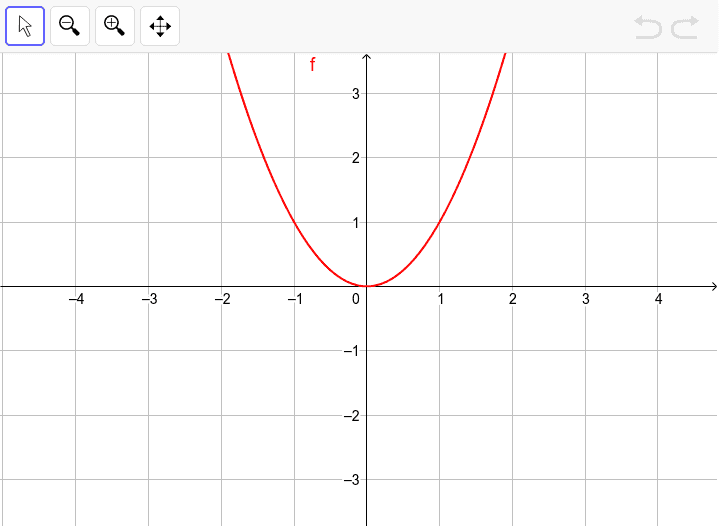
Before diving into the technological aspects, it’s crucial to appreciate why y = x² holds such a special place in mathematics. This equation represents the simplest form of a parabola, a symmetrical U-shaped curve. Parabolas are not merely abstract mathematical constructs; they appear extensively in the natural world and engineered systems. From the trajectory of a projectile, the design of satellite dishes, and the shape of suspension bridges to the path of water from a fountain, the principles governing x² are everywhere. Graphing this equation visually deciphers its properties: its vertex (the lowest or highest point), its axis of symmetry, and how its values change as x varies. Traditionally, graphing involved laborious point plotting, but contemporary digital tools have transformed this process, making it faster, more accurate, and more interactive.
Understanding the Parabolic Shape and Key Features
The function y = x² describes a relationship where the output (y) is the square of the input (x). Let’s quickly recall its defining characteristics:
- Symmetry: The graph is perfectly symmetrical about the y-axis. For any positive x-value, squaring it gives a positive y-value. For the corresponding negative x-value (e.g., -2 vs. 2), squaring it yields the same positive y-value (e.g., (-2)² = 4, 2² = 4).
- Vertex at the Origin: The lowest point of the graph, known as the vertex, is at (0, 0). When x is 0, y is 0. Any other value for x, positive or negative, will result in a positive y-value, hence (0,0) is the minimum.
- Opening Upwards: Because x² will always be positive or zero, the parabola always opens upwards.
- Curvature: The curve gets steeper as x moves further from zero, reflecting the rapid increase in y as x values grow larger (e.g., 1²=1, 2²=4, 3²=9).
These features are fundamental, whether you graph manually or with digital assistance. Digital tools, however, allow for instant visualization, enabling rapid exploration of how these properties manifest and how they might change with variations to the equation (e.g., y = x² + 2 or y = -x²).
The Evolution from Manual Plotting to Digital Precision
In the pre-digital era, graphing y = x² involved creating a table of values (selecting various x-values, calculating corresponding y-values), plotting these points on graph paper, and then carefully drawing a smooth curve through them. This method, while foundational for understanding, was time-consuming and prone to human error, especially for more complex functions. The advent of graphing calculators in the 1980s marked a significant technological leap, putting sophisticated graphing capabilities directly into students’ hands. This was followed by powerful desktop software, and more recently, highly accessible web-based applications and mobile apps, democratizing complex mathematical visualization for everyone with an internet connection. This evolution underscores a broader trend in technology: making complex computational tasks intuitive and instantaneous.
Leveraging Dedicated Graphing Calculators and Software
For anyone needing to graph mathematical functions regularly, dedicated tools offer unparalleled power and flexibility. These range from robust handheld devices to comprehensive software suites, each with its own advantages and learning curve.
Traditional Graphing Calculators: Reliable Workhorses
Graphing calculators like the TI-84 Plus CE (Texas Instruments) or Casio fx-CG50 have been staples in education for decades. They are purpose-built for mathematical operations, including graphing.
How to Graph x² on a TI-84 (General Steps):
- Turn on the calculator.
- Press the [Y=] button. This opens the equation editor.
- Type
X^2intoY1=. The ‘X’ variable key is usually near the ‘ALPHA’ key. The ‘^’ key is for exponents. - Press the [GRAPH] button. The calculator will display the parabola.
- You can adjust the viewing window by pressing [WINDOW] to zoom in or out, or [ZOOM] for quick presets (e.g., ZoomStandard, ZoomFit).
These calculators are reliable, work without internet, and are often permitted in standardized tests, making them invaluable for students. While their interface might seem dated compared to modern apps, their functionality is robust.
Desktop Software Solutions: GeoGebra, Desmos, and Wolfram Alpha
Moving beyond handheld devices, desktop software and web applications offer a richer, more interactive experience, often with a more intuitive user interface and broader feature sets.
-
GeoGebra: A free, open-source dynamic mathematics software that combines geometry, algebra, statistics, and calculus into a single easy-to-use package. It’s available as a desktop application, web app, and mobile app.
- To graph x² in GeoGebra: Simply type
y = x^2into the input bar at the bottom. The graph appears instantly, and you can manipulate it (zoom, pan) with your mouse. GeoGebra allows for a deeper exploration of parameters and interactive geometric constructions.
- To graph x² in GeoGebra: Simply type
-
Desmos: Perhaps the most user-friendly and aesthetically pleasing web-based graphing calculator. It’s renowned for its simplicity, speed, and beautiful visualizations. Desmos is completely free and accessible via any web browser or dedicated mobile app.
- To graph x² in Desmos: Go to desmos.com/calculator. On the left-hand panel, click into an empty expression box and type
y = x^2. The graph immediately appears on the right. You can add multiple equations, adjust colors, and even create interactive sliders to explore how parameters change the graph in real-time. Desmos’s intuitive interface makes it an excellent choice for quick visualizations and educational demonstrations.
- To graph x² in Desmos: Go to desmos.com/calculator. On the left-hand panel, click into an empty expression box and type
-
Wolfram Alpha: More than just a graphing tool, Wolfram Alpha is a computational knowledge engine that can perform complex calculations, answer factual questions, and generate graphs. While not solely a graphing calculator, it provides powerful graphing capabilities as part of its broader functionality.
- To graph x² in Wolfram Alpha: Go to wolframalpha.com and type
graph y = x^2or simplyx^2. Wolfram Alpha will not only display the graph but also provide detailed information about the function, its properties, derivatives, integrals, and more. This makes it incredibly useful for deeper analytical tasks.
- To graph x² in Wolfram Alpha: Go to wolframalpha.com and type
The choice between these depends on your specific needs: GeoGebra for comprehensive mathematical exploration, Desmos for elegant and interactive graphing, and Wolfram Alpha for deep analytical insights alongside visualization.

Mobile Apps and Web-Based Tools for On-the-Go Graphing
The ubiquity of smartphones and tablets has brought advanced graphing capabilities into everyone’s pocket. Mobile apps and responsive web tools offer convenience and accessibility that traditional methods cannot match.
Popular Mobile Graphing Apps
Many of the desktop software solutions also offer excellent mobile apps, ensuring a consistent experience across devices.
- Desmos Graphing Calculator App: Mirrors the web experience, offering a clean interface, quick graphing, and interactive features on your smartphone or tablet. It’s ideal for students and professionals who need to visualize equations on the go.
- GeoGebra Graphing Calculator App: Provides the full power of GeoGebra’s dynamic mathematics environment in a mobile format. It’s particularly strong for combining algebraic and geometric perspectives.
- Graphing Calculator by Mathlab: A popular Android app that offers a scientific calculator, graphing capabilities, and even symbolic differentiation/integration. It’s a comprehensive tool for various mathematical tasks.
- Photomath: While primarily known as a problem-solver that scans equations, Photomath also provides step-by-step solutions and, crucially, graphs for the equations it solves. This can be a quick way to visualize an equation you’ve just solved.
These apps leverage touch interfaces for zooming, panning, and interacting with graphs, making the experience highly intuitive. They often sync across devices, allowing you to start a graph on your computer and continue on your phone.
Accessibility and User Experience
The emphasis of modern web and mobile graphing tools is on user experience (UX) and accessibility. They typically feature:
- Instant Feedback: Graphs update in real-time as you type or modify equations.
- Intuitive Controls: Pinch-to-zoom, drag-to-pan, and tap-to-select features make graph manipulation straightforward.
- Clean Interfaces: Minimalistic designs focus on the graph itself, reducing clutter.
- Collaboration and Sharing: Many platforms allow users to save, share, and embed their graphs, facilitating collaborative learning and teaching.
- Offline Capabilities: Some apps offer offline functionality, ensuring productivity even without an internet connection.
This focus on user experience has made complex mathematical concepts, like the nuances of quadratic functions, more approachable and engaging for a wider audience, from high school students to university researchers.
The Role of AI and Advanced Computational Tools in Visualization
The rise of artificial intelligence and advanced computational algorithms is further transforming how we interact with and visualize mathematical functions. While simple equations like y = x² don’t necessarily require AI for graphing, these advanced tools integrate graphing capabilities into broader problem-solving frameworks, offering richer analytical insights and pushing the boundaries of what’s possible with visualization.
AI-Powered Equation Solvers with Graphing Capabilities
AI-driven platforms, such as ChatGPT with its code interpreter (or similar large language models), or specialized math AI tools, can interpret natural language queries, solve equations, and generate graphs.
- Using AI for x²: You could type a prompt like: “Graph the function y = x^2 and describe its properties.” An AI would not only generate the graph (often by using an underlying graphing library like Matplotlib in Python or similar tools) but also provide a textual explanation of its vertex, symmetry, and opening direction. This integration of textual explanation with visual output is a powerful educational tool.
- Benefits: AI can help clarify concepts, explain the significance of the graph, and even suggest related functions to explore. For instance, asking “How does y = x^2 compare to y = x^2 + 5?” could yield two graphs and an explanation of the vertical shift. This moves beyond mere plotting to providing contextual mathematical understanding.
These tools are particularly useful for students who might struggle with the syntax of traditional calculators or software, allowing them to express their mathematical queries in plain language.
Beyond Simple Quadratics: Exploring Complex Functions
While graphing x² is straightforward, AI and advanced computational engines truly shine when dealing with more complex functions, multi-variable equations, or functions with specific domain/range constraints. They can:
- Handle Implicit Equations: Graphing equations where y is not explicitly defined (e.g., x² + y² = 25 for a circle).
- Visualize 3D Surfaces: For functions with two independent variables (e.g., z = x² + y²), AI-integrated tools can generate stunning 3D surface plots, which are impossible with standard 2D graphing calculators.
- Parametric and Polar Equations: Effortlessly graph functions defined parametrically or in polar coordinates, which often present challenges for manual plotting.
- Data Visualization: Integrate graphing with statistical analysis, allowing for quick visualization of data sets and curve fitting, which is invaluable in scientific research and data science.
The computational power behind these AI tools allows for the rapid exploration of mathematical landscapes that would be prohibitively time-consuming or complex to visualize manually or with simpler tools. This ability to instantly generate and manipulate graphs for complex scenarios fosters deeper intuition and accelerates the understanding of advanced mathematical concepts.

Conclusion
Graphing the simple quadratic equation y = x² is more than just a foundational mathematical exercise; it’s a gateway to understanding the power and elegance of visual mathematics. While the core mathematical concept remains timeless, the methods of visualization have undergone a profound technological transformation. From the steadfast reliability of traditional graphing calculators to the intuitive interactivity of web-based apps like Desmos, and the analytical depth provided by Wolfram Alpha, up to the intelligent integration offered by AI tools, the options for accurately and efficiently graphing x² are diverse and powerful.
Embracing these digital tools not only saves time and reduces error but also opens up new avenues for exploration and understanding. They allow for instant feedback, interactive manipulation, and the ability to seamlessly compare multiple functions, fostering a deeper intuitive grasp of how mathematical changes manifest visually. Whether you’re a student learning the basics, an educator demonstrating concepts, or a professional analyzing data, leveraging these technological aids will enhance your mathematical journey and empower you to visualize the world of numbers with unprecedented clarity and insight. In an increasingly data-driven world, the ability to effectively graph and interpret mathematical functions, facilitated by cutting-edge technology, remains an indispensable skill.
aViewFromTheCave is a participant in the Amazon Services LLC Associates Program, an affiliate advertising program designed to provide a means for sites to earn advertising fees by advertising and linking to Amazon.com. Amazon, the Amazon logo, AmazonSupply, and the AmazonSupply logo are trademarks of Amazon.com, Inc. or its affiliates. As an Amazon Associate we earn affiliate commissions from qualifying purchases.