
Understanding and accurately measuring the rate of inflation is not merely an academic exercise for economists; it’s a critical skill for anyone managing personal finances, running a business, or making investment decisions. Inflation, at its core, represents the rate at which the general level of prices for goods and services is rising, and consequently, the purchasing power of currency is falling. While the concept might seem abstract, its effects are felt directly in your wallet, from the cost of your groceries to the value of your savings. In an increasingly dynamic global economy, mastering how to find and interpret the rate of inflation empowers individuals and businesses to navigate economic shifts, protect their wealth, and make informed financial choices. This article will delve into the mechanisms, metrics, and importance of tracking this fundamental economic indicator.
The Core Concept: What is Inflation?
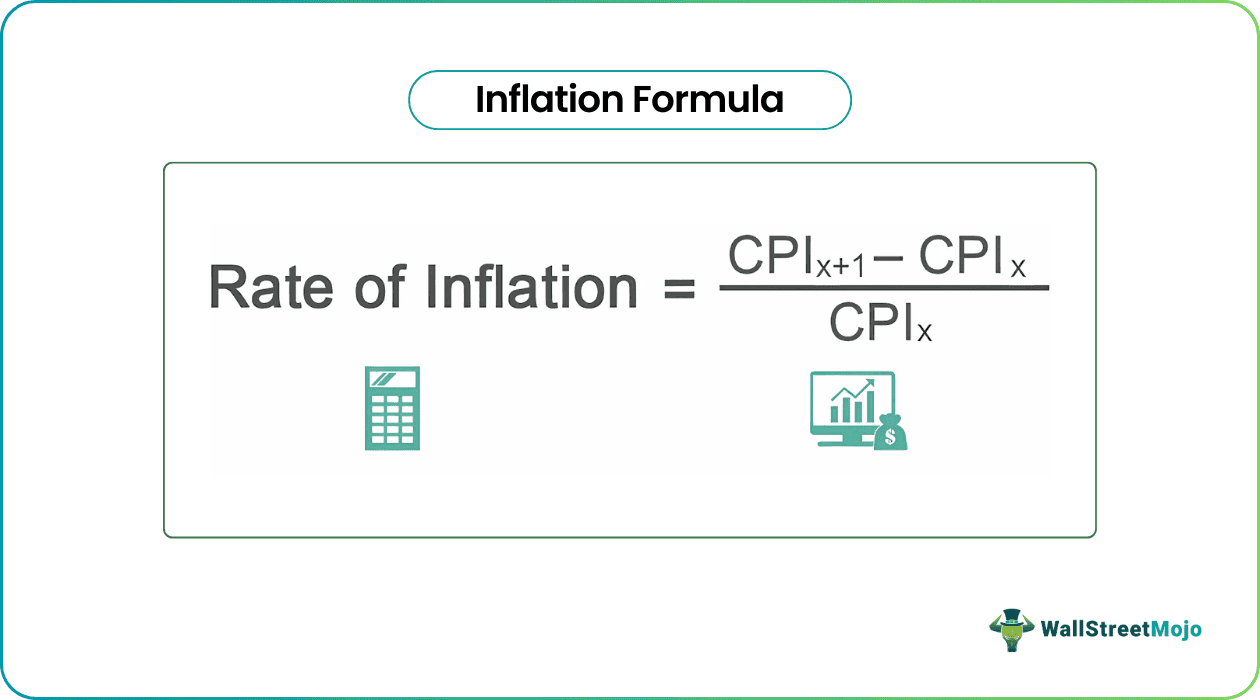
Before we can accurately measure inflation, it’s essential to grasp its fundamental nature. Inflation is a sustained increase in the general price level of goods and services in an economy over a period of time. When the price level rises, each unit of currency buys fewer goods and services, meaning inflation reflects a reduction in the purchasing power per unit of money – a hidden tax on everyone’s money.
Defining Price Level Changes
The “general price level” is key here. Inflation isn’t about a single product’s price going up; it’s about a broad trend across a wide array of goods and services. For instance, if the price of avocados doubles, but everything else stays the same or drops, that’s not inflation. However, if the cost of housing, food, energy, and transportation all increase across the board, that signifies a rising general price level. This widespread increase diminishes the real value of money over time.
The Erosion of Purchasing Power
The most tangible effect of inflation is the erosion of purchasing power. Imagine you had $100 five years ago and could buy a certain basket of goods. Today, that same $100 will likely buy a smaller basket of goods. The money itself hasn’t changed its numerical value, but its ability to command goods and services in the market has diminished. This directly impacts consumers who find their wages stretch less far, savers whose nest eggs lose real value, and businesses that face higher input costs. Understanding this erosion is the first step toward appreciating why measuring inflation is so crucial for financial health.
Key Metrics for Measuring Inflation
To quantify inflation, economists and government agencies rely on specific indices designed to track changes in the prices of a representative “basket” of goods and services over time. While several metrics exist, each offers a unique perspective on price changes within the economy.
The Consumer Price Index (CPI): The Gold Standard
The most widely cited and perhaps best-known measure of inflation is the Consumer Price Index (CPI). Calculated and published by the Bureau of Labor Statistics (BLS) in the United States, the CPI measures the average change over time in the prices paid by urban consumers for a market basket of consumer goods and services.
How CPI is Calculated: Basket of Goods and Services
The BLS identifies a representative “basket” of goods and services that a typical urban household consumes. This basket includes a broad range of categories such as food and beverages, housing, apparel, transportation, medical care, recreation, education, and communication. The prices for these items are collected monthly from thousands of retail stores, service establishments, rental units, and doctors’ offices across the country. Each item in the basket is weighted according to its importance in the average consumer’s budget. For instance, housing costs typically have a larger weight than apparel because consumers spend a greater proportion of their income on housing.
CPI Applications and Limitations
The CPI is invaluable for a multitude of reasons. It’s used to adjust wages, Social Security benefits, pension payments, and even tax brackets to account for changes in the cost of living. It’s a key indicator for policymakers, helping central banks formulate monetary policy. However, the CPI isn’t without its limitations. Critics argue that the fixed basket might not always accurately reflect changing consumer habits (e.g., substitution bias, where consumers switch to cheaper alternatives when prices rise), or that it doesn’t fully capture quality improvements in goods over time (quality bias).
The Producer Price Index (PPI): Early Warning Signs
While the CPI tracks prices from the consumer’s perspective, the Producer Price Index (PPI) measures the average change over time in the selling prices received by domestic producers for their output. Published by the BLS, the PPI covers nearly all goods-producing sectors and a significant portion of the services sector.
What PPI Measures and Its Relationship to CPI
The PPI captures price movements from the seller’s perspective in various stages of production (e.g., crude goods, intermediate goods, finished goods). It includes prices for inputs to production such as raw materials and energy. Changes in the PPI are often seen as an early indicator of future consumer inflation. If producers’ costs are rising, they are likely to pass those costs on to consumers in the form of higher retail prices, which would eventually reflect in the CPI. Thus, monitoring the PPI can offer foresight into potential shifts in consumer inflation.
Personal Consumption Expenditures (PCE) Price Index: The Fed’s Preferred Gauge
Another crucial inflation metric is the Personal Consumption Expenditures (PCE) Price Index, produced by the Bureau of Economic Analysis (BEA). While less known to the general public than the CPI, the PCE is the Federal Reserve’s preferred measure of inflation for guiding monetary policy.
Why the Federal Reserve Prefers PCE Over CPI
The Fed prefers the PCE for several reasons. Firstly, the PCE’s weighting scheme for goods and services is more flexible and reflects changes in consumer spending patterns more readily than the CPI. It allows for “substitution bias” by reflecting when consumers substitute away from goods whose prices have risen. Secondly, the PCE covers a broader range of goods and services, including those purchased by non-profit institutions on behalf of households, which the CPI does not. Lastly, historical revisions to the PCE data are more common, allowing for greater accuracy over time. These features make the PCE a more comprehensive and robust indicator of underlying inflation trends from the Fed’s perspective.
Other Inflation Indicators: GDP Deflator and Core Inflation
Beyond these primary indices, other measures offer complementary insights. The Gross Domestic Product (GDP) Deflator measures the average level of prices of all new, domestically produced, final goods and services in an economy. It’s a broader measure than CPI or PCE as it includes goods and services purchased by businesses and the government, not just consumers.
Core Inflation is a specific calculation of inflation that excludes volatile items like food and energy prices. Both CPI and PCE can be reported as “headline” (including all items) or “core” (excluding food and energy). Economists often focus on core inflation to get a clearer picture of underlying long-term price trends, as food and energy prices can fluctuate wildly due to short-term supply shocks or geopolitical events, temporarily distorting the true inflationary picture.
Calculating the Rate of Inflation
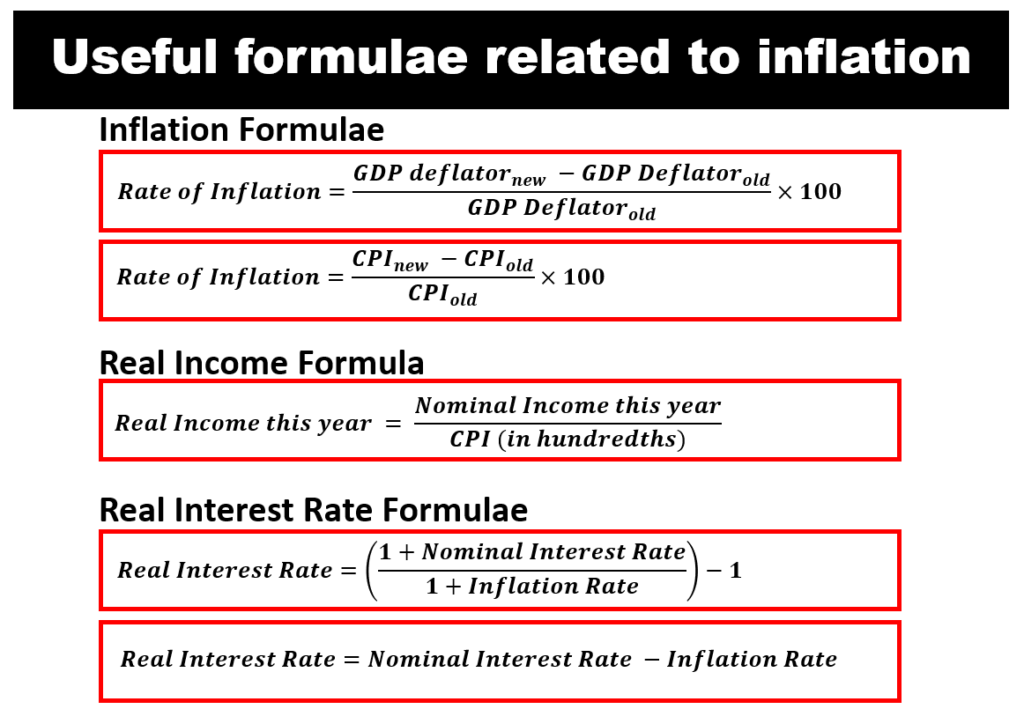
Once you have access to the various price indices, calculating the actual rate of inflation is a straightforward process, typically expressed as a percentage change over a specified period.
The Simple Formula: Percentage Change Over Time
The basic formula for calculating the rate of inflation (or any percentage change) is:
$$
text{Inflation Rate} = frac{(text{Current Index Value} – text{Previous Index Value})}{text{Previous Index Value}} times 100
$$
Let’s break this down with an example using the CPI:
Example: Annual Inflation Rate
Suppose the CPI in January of Year 1 was 280, and in January of Year 2, it was 291.2.
$$
text{Inflation Rate} = frac{(291.2 – 280)}{280} times 100 = frac{11.2}{280} times 100 = 0.04 times 100 = 4%
$$
This means that over the year, prices, on average, increased by 4%.
Understanding Different Timeframes (Monthly vs. Annual)
Inflation rates are commonly reported on different timeframes:
-
Monthly Inflation: The percentage change from one month to the next. For instance, the change in CPI from May to June. These are often annualized to give a sense of what the yearly rate would be if the monthly rate continued.
-
Annual (Year-over-Year) Inflation: This is the most common and often cited figure. It compares the current month’s index value to the same month’s index value in the previous year (e.g., June 2023 vs. June 2022). This helps smooth out seasonal variations and provides a clearer picture of the sustained trend.
-
Annualized Rate: This is particularly relevant for short-term changes. If you have a monthly inflation rate, you might multiply it by 12 to get an “annualized” rate, assuming that monthly pace continues. This helps compare short-term movements with long-term trends. For precise compounding, the formula would be $((1 + text{monthly rate})^12 – 1) times 100$.
Why Tracking Inflation Matters for Your Money
The numbers derived from these calculations are far more than mere statistics; they represent powerful economic forces that directly influence your financial well-being and strategic business decisions. Ignoring inflation is akin to sailing without a compass, leaving your financial future vulnerable to unseen currents.
Impact on Personal Finance: Savings, Investments, Budgeting
For individuals, inflation is a silent thief. If your savings account offers a 1% annual interest rate, but inflation runs at 3%, the real return on your savings is actually -2%. Your money is losing purchasing power. This highlights the importance of seeking investments that can at least match, if not exceed, the rate of inflation. Understanding inflation helps you assess the true return on your investments, evaluate the adequacy of your retirement savings, and adjust your household budget. It might influence decisions to lock in fixed-rate loans (beneficial if inflation rises) or reconsider large purchases.
Impact on Business Finance: Pricing, Wages, Investment Decisions
Businesses are deeply affected by inflation. Rising input costs (raw materials, energy, labor) squeeze profit margins unless they can pass those costs on to consumers through higher prices. This leads to complex pricing strategies, where businesses must balance covering costs with maintaining competitiveness. Wage negotiations become more intricate, as employees demand higher pay to maintain their real income. Inflation also influences investment decisions; businesses might rush to invest in tangible assets (like real estate or machinery) whose values tend to keep pace with or exceed inflation, rather than holding depreciating cash. Accurate inflation forecasts are crucial for long-term strategic planning, capital budgeting, and assessing the profitability of future projects.
Central Bank Policies and Interest Rates
Central banks, like the U.S. Federal Reserve, are tasked with maintaining price stability, which often means keeping inflation at a target rate (e.g., 2%). When inflation deviates significantly from this target, central banks use monetary policy tools, primarily adjusting interest rates, to influence economic activity. If inflation is too high, they might raise interest rates to cool down the economy, making borrowing more expensive and saving more attractive. Conversely, if inflation is too low (or deflation is a risk), they might lower rates to stimulate spending and investment. Your understanding of inflation metrics allows you to anticipate these policy shifts, which, in turn, affect mortgage rates, loan costs, and investment returns across the board.
Accessing Inflation Data and Tools
Fortunately, official, reliable sources make tracking inflation accessible to everyone. Empowering yourself with this knowledge is a critical step towards better financial management.
Official Sources: Bureau of Labor Statistics, Federal Reserve
The primary sources for inflation data are government agencies. In the United States, the Bureau of Labor Statistics (BLS) is where you’ll find the most detailed and up-to-date CPI and PPI data. Their website (www.bls.gov) offers comprehensive reports, historical data series, and explanations of their methodologies. For PCE data, the Bureau of Economic Analysis (BEA) (www.bea.gov) is the go-to source. The Federal Reserve (www.federalreserve.gov) also publishes extensive economic data, including PCE figures and their own analyses of inflation trends, often with charts and interactive tools. These sites are user-friendly and offer a wealth of information for both casual observers and serious financial analysts.

Financial News Outlets and Analytical Tools
Beyond official government sources, numerous reputable financial news outlets (e.g., The Wall Street Journal, Bloomberg, Reuters, Financial Times) regularly report on inflation figures and offer expert analysis. Many of these platforms, along with dedicated financial data providers, also offer interactive charts and tools that allow users to visualize inflation trends, compare different metrics, and even run simulations. Investment platforms and personal finance apps may also integrate inflation data or provide inflation-adjusted returns, helping you see the real impact on your portfolio. Leveraging these resources ensures you stay informed and can factor current and projected inflation rates into your financial planning.
In conclusion, understanding how to find and interpret the rate of inflation is not just a matter for economists or policymakers; it is an essential competency for anyone seeking to make informed financial decisions in a dynamic economic landscape. By familiarizing yourself with key metrics like the CPI, PPI, and PCE, grasping the simple calculation methods, and regularly consulting official data sources, you equip yourself with the knowledge to protect your purchasing power, optimize your investments, and navigate the ebb and flow of economic cycles with greater confidence and strategic foresight.
aViewFromTheCave is a participant in the Amazon Services LLC Associates Program, an affiliate advertising program designed to provide a means for sites to earn advertising fees by advertising and linking to Amazon.com. Amazon, the Amazon logo, AmazonSupply, and the AmazonSupply logo are trademarks of Amazon.com, Inc. or its affiliates. As an Amazon Associate we earn affiliate commissions from qualifying purchases.