
In the intricate world of finance, numbers tell a story. Whether you’re tracking your personal savings, evaluating investment performance, or analyzing a company’s quarterly earnings, understanding the magnitude and direction of change is paramount. This is where the concept of “percentage change” becomes not just a mathematical formula, but a powerful lens through which to view your financial landscape. It allows us to standardize comparisons, identify trends, and make informed decisions, transforming raw data into actionable intelligence.
Without the ability to quantify how much something has grown or shrunk relative to its original size, we’re essentially navigating blind. A $100 increase in your portfolio means very different things if your portfolio was initially $1,000 versus $100,000. Percentage change provides this crucial context, offering a universally understood metric for financial evolution. This guide will demystify the process of calculating percentage change, explore its vital applications across various financial domains, and equip you with the knowledge to leverage this fundamental tool for enhanced financial literacy and strategic planning.
The Core Concept: Understanding Percentage Change
At its heart, percentage change is a simple yet profound concept: it measures the relative change between an old (initial) value and a new (final) value, expressed as a percentage. It provides a standardized way to compare changes, regardless of the absolute size of the numbers involved.
Why Percentage Change Matters in Finance
Imagine you’re reviewing two different investments. Investment A increased by $500, and Investment B increased by $1,000. On the surface, Investment B seems superior. However, what if Investment A started at $5,000 and Investment B started at $50,000? In this scenario, Investment A yielded a 10% return ($500/$5,000), while Investment B only yielded a 2% return ($1,000/$50,000). Without percentage change, the raw dollar amounts alone can be misleading.
In finance, percentage change offers several critical advantages:
- Standardized Comparison: It allows for fair comparison between different assets, periods, or companies, irrespective of their size.
- Trend Identification: By tracking percentage changes over time, you can identify upward or downward trends in income, expenses, asset values, or market performance.
- Performance Evaluation: It’s the primary metric for assessing the performance of investments, businesses, and even individual financial goals.
- Goal Setting and Tracking: When setting financial goals (e.g., increasing savings by X%, reducing debt by Y%), percentage change provides a clear, measurable target.
- Inflation Adjustment: Understanding the percentage change in prices over time (inflation) is crucial for assessing the real value of money and investments.
The Fundamental Formula Explained
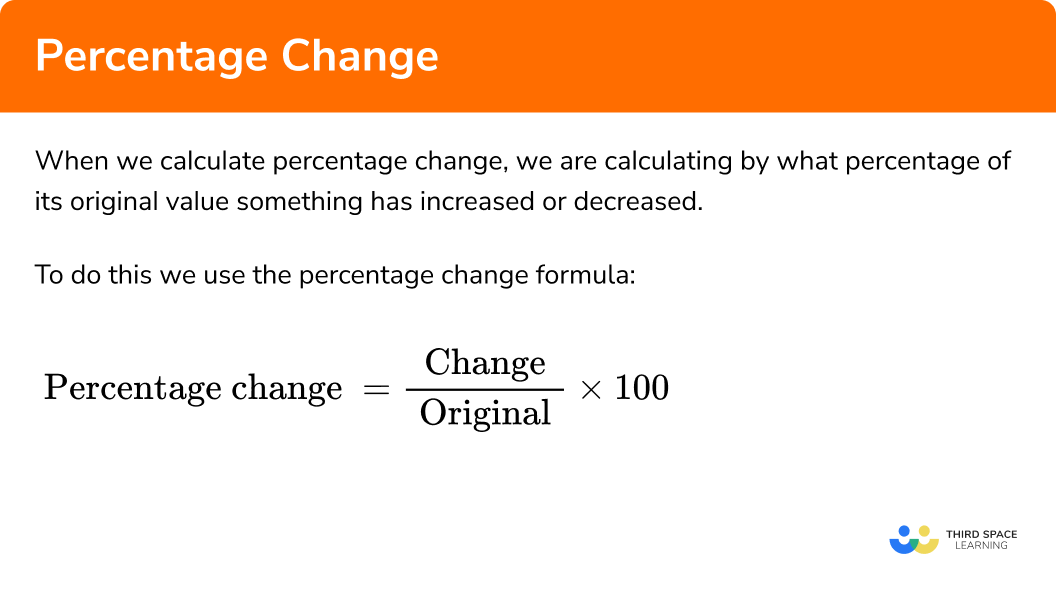
The calculation for percentage change is straightforward and applies universally. Here’s the formula:
Percentage Change = ((New Value – Old Value) / Old Value) * 100%
Let’s break down each component:
- New Value: This is the current or final value you are measuring.
- Old Value: This is the initial or starting value from which the change occurred.
- (New Value – Old Value): This calculates the absolute change, also known as the difference.
- If the result is positive, it indicates an increase.
- If the result is negative, it indicates a decrease.
- (/ Old Value): Dividing the absolute change by the old value contextualizes the change. It tells you what proportion of the original value the change represents.
- (* 100%): Multiplying by 100 converts this proportion (a decimal) into a percentage, making it easier to understand and communicate.
Example 1: Price Increase
If a stock’s price increased from $50 (Old Value) to $55 (New Value):
Change = ($55 – $50) = $5
Percentage Change = ($5 / $50) * 100% = 0.10 * 100% = 10% Increase
Example 2: Value Decrease
If your debt decreased from $10,000 (Old Value) to $9,500 (New Value):
Change = ($9,500 – $10,000) = -$500
Percentage Change = (-$500 / $10,000) * 100% = -0.05 * 100% = 5% Decrease
It’s crucial to distinguish between a percentage change and a percentage point change. A percentage point change refers to the absolute difference between two percentages (e.g., if an interest rate goes from 3% to 4%, that’s a 1 percentage point increase, but a (4-3)/3 * 100% = 33.33% change in the rate itself). Always be clear about which metric you are using.
Practical Applications in Personal Finance
For individuals managing their money, percentage change is an indispensable tool for tracking progress, identifying areas for improvement, and making astute financial decisions.
Tracking Savings and Debt Progress
One of the most motivating aspects of personal finance is seeing your net worth grow or your debt shrink. Percentage change makes this progress tangible:
- Savings Growth: If your savings account balance went from $1,000 to $1,200 in a month, that’s a 20% increase. Tracking this monthly or annually allows you to gauge the effectiveness of your saving habits and investment returns.
- Debt Reduction: If you reduced a credit card balance from $5,000 to $4,000, you’ve achieved a 20% reduction. Celebrating these milestones, expressed as percentages, can sustain motivation.
- Net Worth Changes: Monitoring your net worth (assets minus liabilities) percentage change quarter-over-quarter or year-over-year provides a holistic view of your overall financial health and progress toward long-term goals.
Analyzing Budget Variances
Budgets are living documents, and rarely do expenses perfectly align with projections. Percentage change helps you analyze these variances:
- Spending Categories: If you budgeted $200 for groceries but spent $250, that’s a (250-200)/200 * 100% = 25% over budget. This insight allows you to adjust future spending or re-evaluate your budget allocations.
- Income Fluctuations: For freelancers or those with variable income, calculating the percentage change in monthly income can help in planning for lean months or leveraging prosperous ones.
- Expense Optimization: Identifying categories with consistently high percentage increases can flag areas where you might need to cut back or find more cost-effective solutions.
Understanding Salary and Expense Shifts
Life changes, and so do incomes and expenses. Percentage change helps put these shifts into perspective:

- Salary Increases: A 5% raise might seem small in dollar terms, but understanding its percentage impact on your overall income is crucial for financial planning.
- Cost of Living: When rent increases by 7% or utility bills jump by 15%, calculating these percentage changes helps you understand their impact on your disposable income and potentially adjust your budget.
- Inflation’s Impact: Comparing your salary increase percentage to the current inflation rate’s percentage change tells you if your purchasing power is actually growing, stagnating, or declining.
Unlocking Insights in Investing and Business
Beyond personal finances, percentage change is the bedrock of financial analysis in investing and business operations, facilitating performance assessment and strategic decision-making.
Stock Performance and Portfolio Growth
In the investment world, percentage change is the lingua franca for performance:
- Stock Returns: The gain or loss of a stock is almost always reported as a percentage change. For example, “Apple shares rose 2% today.”
- Portfolio Performance: Investors regularly track the percentage change of their entire investment portfolio over various periods (daily, monthly, annually) to assess its overall health and compare it against benchmarks.
- Mutual Fund/ETF Returns: The performance of these pooled investments is exclusively communicated as percentage returns over different time horizons (1-year, 5-year, inception).
- Comparing Investments: To decide between two different investment options, comparing their percentage returns over similar periods is essential, as absolute dollar gains can be misleading given different initial investments.
Revenue, Profit, and Cost Analysis
Businesses live and die by their financial health, and percentage change offers vital diagnostics:
- Revenue Growth: Companies boast about percentage increases in revenue year-over-year or quarter-over-quarter. This is a key indicator of market success and expansion.
- Profit Margins: Analyzing the percentage change in net profit or gross profit helps businesses understand their efficiency and profitability trends. A significant drop might signal rising costs or pricing pressures.
- Cost Control: Tracking percentage changes in operational costs (e.g., labor, raw materials, marketing) allows management to identify cost overruns or successful cost-saving initiatives.
- Market Share: If a company’s sales increase by a certain percentage, it’s often compared to the overall market’s percentage growth to determine if the company is gaining or losing market share.
Market Share and Economic Indicators
On a broader scale, percentage change underpins macroeconomic analysis:
- GDP Growth: Economic health is primarily measured by the percentage change in Gross Domestic Product (GDP) from quarter to quarter or year to year.
- Inflation/Deflation Rates: The Consumer Price Index (CPI) measures the average percentage change over time in the prices paid by urban consumers for a market basket of consumer goods and services.
- Unemployment Rate: While the unemployment rate itself is a percentage, changes in it are often discussed as percentage point changes or as percentage changes relative to the prior period.
- Interest Rate Changes: Central banks announce changes to key interest rates, and while these are often expressed in basis points (100 basis points = 1 percentage point), their impact on borrowing costs and investment returns is analyzed through percentage changes.
Common Pitfalls and Advanced Considerations
While the formula for percentage change is simple, its application and interpretation require careful thought to avoid common pitfalls and to derive deeper insights.
Avoiding Misinterpretations: The Base Value Trap
One of the most common errors is misidentifying the “Old Value” or “New Value.” Always ensure you are using the correct baseline. For example, if a stock drops 50% from $100 to $50, it needs to increase by 100% (from $50 to $100) to return to its original value, not just 50%. The base for calculation changes, and forgetting this can lead to serious misjudgments, especially in volatile markets.
Another trap is comparing changes over different periods without normalization. A 10% gain over one year is not comparable to a 10% gain over five years. This leads us to more advanced concepts.
Compounding Effects and Annualized Returns
For investments held over multiple periods, the simple percentage change formula only tells you the overall change. To understand the average annual growth, especially when returns compound (i.e., your earnings also start earning returns), you need to consider the Compound Annual Growth Rate (CAGR).
CAGR = ((Ending Value / Beginning Value)^(1 / Number of Years)) – 1
CAGR provides a smoothed, annualized return rate, assuming profits are reinvested. It’s particularly useful for evaluating long-term investment performance and comparing investments with different durations. Understanding compounding, often expressed through percentage growth year after year, is the cornerstone of wealth creation.
Using Tools for Efficient Calculation
While simple calculations can be done manually, for more complex financial analysis or large datasets, leveraging tools is crucial:
- Spreadsheets (Excel, Google Sheets): These are invaluable. You can set up columns for Old Value, New Value, and a formula for Percentage Change, then apply it across hundreds or thousands of rows. This is essential for budgeting, portfolio tracking, and business reporting.
- Online Calculators: Numerous websites offer quick percentage change calculators.
- Financial Software: Investment platforms and accounting software often build percentage change calculations directly into their reporting dashboards.
- Programming Languages (Python, R): For advanced users, scripting can automate complex financial calculations and analysis, including percentage changes for large datasets.
Mastering Percentage Change for Financial Empowerment
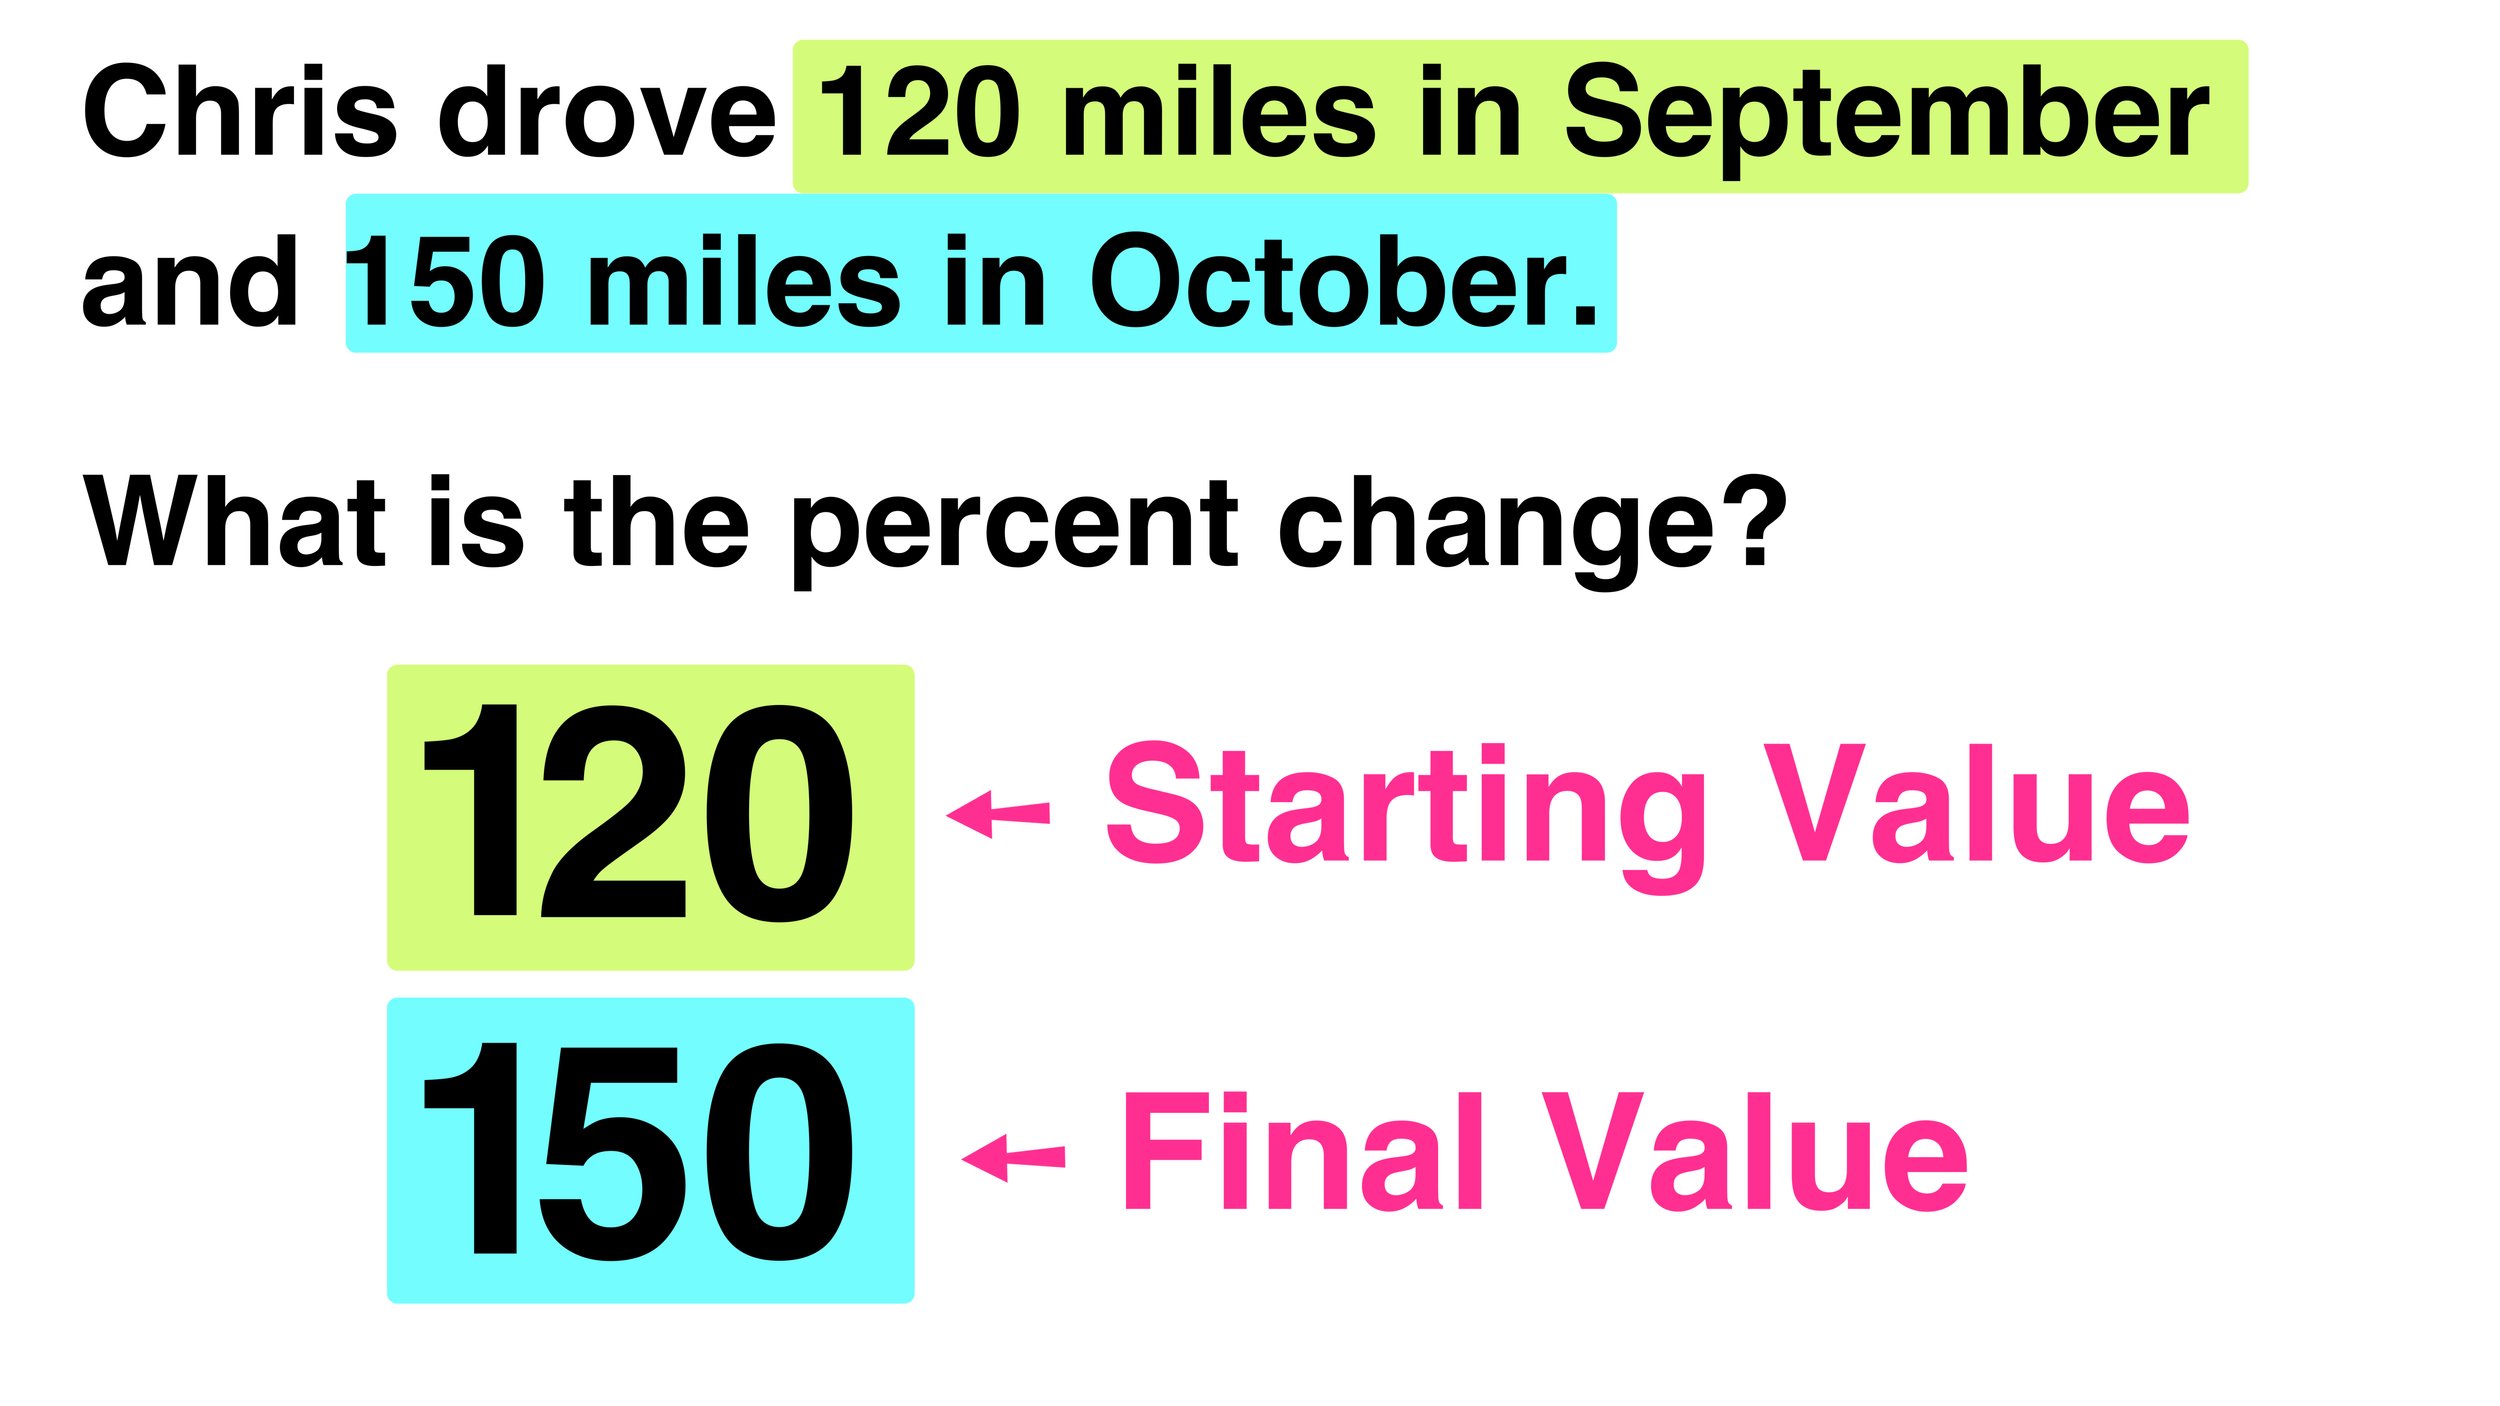
Mastering how to find the percentage change is more than just learning a formula; it’s about developing a fundamental literacy in the language of money. It empowers you to dissect financial reports, critically evaluate investment pitches, and accurately gauge your own financial progress. From tracking micro-level changes in your daily spending to macro-level shifts in global economies, the ability to calculate and interpret percentage change provides a clarity that is indispensable.
By consistently applying this tool, you move beyond merely observing numbers to truly understanding their significance and implications. This deeper insight enables proactive decision-making, better risk assessment, and ultimately, a more confident and effective approach to managing your finances and building lasting wealth. Make percentage change a cornerstone of your financial toolkit, and unlock a new level of financial empowerment.
aViewFromTheCave is a participant in the Amazon Services LLC Associates Program, an affiliate advertising program designed to provide a means for sites to earn advertising fees by advertising and linking to Amazon.com. Amazon, the Amazon logo, AmazonSupply, and the AmazonSupply logo are trademarks of Amazon.com, Inc. or its affiliates. As an Amazon Associate we earn affiliate commissions from qualifying purchases.